24.04.25 Morning ForecastPairs on Watch -
FX:AUDUSD
FX:NZDCAD
FX:USDJPY
A short overview of the instruments I am looking at for today, multi-timeframe analysis down to what I will be looking at for an entry. Enjoy!
Priceactionanalysis

#NIFTY Intraday Support and Resistance Levels - 24/04/2025Gap down opening expected in nifty. Expected opening near 24200 level. 24200-24300 levels are the consolidation zone for the today's session. Strong upside rally expected if nifty starts trading and sustain above 24300 level. Any downside only expected below 24200 level. Downside 24000 level will act as a strong support for today's session.

[INTRADAY] #BANKNIFTY PE & CE Levels(24/04/2025)Today will be slightly gap down opening expected in index. After opening 55050 level will act as a strong support for today's session. Expected reversal from this level. Upside above 55550 level there will be strong bullish rally expected upto 55950+ level in today's session. Any major downside only expected below 55000 level.

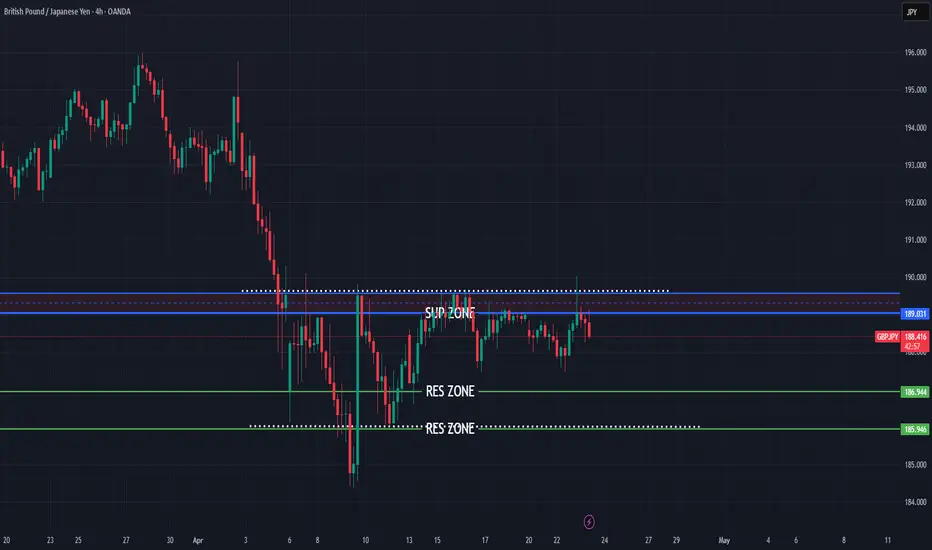
GBPJPY short bearish push expecting
OANDA:GBPJPY price action based trade, here short bearish push expecting till bottom line.
SUP zone: 189.050
RES zone: 186.950, 185.950
23.04.25 Morning ForecastPairs on Watch -
FX:GBPAUD
FX:AUDCAD
FX:USDCHF
A short overview of the instruments I am looking at for today, multi-timeframe analysis down to what I will be looking at for an entry. Enjoy!

Bullish Breakout on NAS100 – Momentum ShiftingNASDAQ 100 (US100) – Bullish Setup Developing
1. Falling Wedge Breakout:
Price has broken out of the falling wedge (purple trendlines), signaling a potential reversal to the upside.
2. Retesting Breakout Zone:
Current price action is retesting the breakout level near the 18,000 zone, indicating potential support forming.
3. Trendline Confluence:
The breakout aligns with the lower boundary of the broader ascending channel (blue), acting as dynamic support.
4. Strong Bullish Rejection at Lows:
Price showed strong buying interest near 17,700, forming a bullish rejection wick and bounce.
5. Clean Target Ahead:
Next key resistance zone lies around 18,540, where price may face selling pressure again – this matches previous structure and descending channel resistance.
6.Momentum Shift Noted:
Lower highs and lower lows structure has been invalidated, hinting at a possible trend shift.
Thanks for your Time..

#NIFTY Intraday Support and Resistance Levels - 23/04/2025Gap up opening expected in nifty. After opening if nifty sustain above 24250 level then upside rally upto 24500+ level expected in index. Upside 24500 level will act as a strong resistance for today's session. Any further strong rally only expected after breakout of this level. Any downside movement only expected if nifty starts trading below 24200 level.

[INTRADAY] #BANKNIFTY PE & CE Levels(23/04/2025)Today will be gap up opening expected in index near 55950 level. After opening expected banknifty will trade in between level of 55550 to 55950 zone in starting session. Strong upside rally expected if banknifty gives breakout of 56000 level and starts trading above 56050. This upside rally can goes upto 56450+ level in today's session. Any major downside only expected below 55450 level.

22.04.25 Morning ForecastPairs on Watch -
FX:AUS200
FX:AUDUSD
FX:EURUSD
FX:GBPUSD
A short overview of the instruments I am looking at for today, multi-timeframe analysis down to what I will be looking at for an entry. Enjoy!

Let the Resistance Cross & Sustain!Bullish Divergence on Weekly as well as Monthly TF.
Hidden Bullish Divergence on Daily TF.
Immediate Resistance is around 8.20 - 8.30
Important Resistance Zone 9.80 - 10.90
Crossing & Sustaining will expose 13 - 13.50 initially.

#NIFTY Intraday Support and Resistance Levels - 22/04/2025Today slightly gap up opening expected in nifty. After opening if nifty starts trading above 24250 level then expected further bullish rally upto 24500+ level in today's session. 24000-24200 level will act as a consolidation zone for today's session. Any major downside only expected below 24000 level.

[INTRADAY] #BANKNIFTY PE & CE Levels(22/04/2025)Today will be flat or slightly gap up opening expected in banknifty. After opening it will face immediate resistance at 55450 level. If banknifty gives breakout of this resistance zone and starts trading above 55550 level then expected strong bullish rally towards the 55950+ level in today's session. Downside 55050 will act as an important support level for banknifty.

Gold Price Analysis April 21Gold price is currently at ATH and trading strategy is difficult. Gold is facing the round port level of 3400 and the lower boundary is the Break out zone around 3386. Any pullback of gold is considered as an opportunity to buy 3420 can be considered as today's boundary.

21.04.25 Morning ForecastPairs on Watch -
FX:EURNZD
FX:EURAUD
FX:EURUSD
FX:AUDUSD
A short overview of the instruments I am looking at for today, multi-timeframe analysis down to what I will be looking at for an entry. Enjoy!

XAUUSD TRADE IDEAhi all
this my trade plan until end of this month
good luck
**My trading strategy is not intended to be a signal. It's a process of learning about market structure and sharpening my trading my skills also for my trade journal**
Thanks a lot for your support

[INTRADAY] #BANKNIFTY PE & CE Levels(21/04/2025)Slightly gap down opening expected in banknifty. After opening expected downside movement upto 54050 level. 54000 level will act as a strong support for today's session. Expected reversal from this level towards the 54450+ and this can be extend for further upside rally if banknifty starts trading above 54550 level. Above this level banknifty can goes upto 54950+ level in today's session. Any major downside only expected below 53950 level.

#NIFTY Intraday Support and Resistance Levels - 21/04/2025Today will be flat opening expected in nifty. After opening 23850 will act as a resistance for today's session. If nifty starts trading below this resistance level then expected downside upto 23600 support level. Strong bullish rally expected in nifty if it's started trading above 23900 level. This upside bullish rally can goes upto 24200+ level in today's session.

How Smart Money is Positioning in EUR/USD – 5 Scenarios UnfoldedLiquidity Maps & Trap Zones: EUR/USD 1H Breakdown
EUR/USD SMC Analysis – Scenarios Overview
1. Case 1 – Immediate Pump:
The market may pump directly from the current market price (CMP) and take out the external range liquidity resting above the current highs.
2. Case 2 – 15-Min Demand Reaction:
The market could react to the 15-minute demand zone , showing a bullish response and pushing higher toward the 1H supply zone .
3. Case 3 – Inducement & Distribution:
Combined with Case 2, the market may first mitigate the 15-minute demand , then take out the inducement (IdM ) near the 1H supply zone . From there, distribution may begin within that supply range, leading to a drop toward the discount zone .
This would likely involve a fake breakout to the upside (liquidity sweep), trapping buyers and hitting the stop-losses of early sellers before reversing sharply.
4. Case 4 – 1H CHoCH and Triangle Breakdown:
A Change of Character (CHoCH) may occur on the 1H timeframe directly from the current price, leading to a downside move. This scenario would also break the rising triangle pattern , triggering entries from price action traders and increasing market volatility as liquidity accelerates the move downward.
5. Case 5 – 1H Supply Rejection & Free Fall:
The market may react from the 1H supply zone and reject aggressively, resulting in a free fall all the way down to the previous CHoCH level , confirming strong bearish intent from premium to discount.
Thanks for your time..

Bitcoin may see $67k - Monthly timeframeHere is the monthly chart of the bitcoin. Based on price action analysis, we have a broad bull channel. We can see 2 price action signs here:
1- Second leg in the bull channel, we call it second leg trap
2- A climactic move to the top of the channel (biggest bull bar late in the trend)
Given the context, there is 60% chance that we see the bottom of the climactic move, which is $67,000.
The pessimistic perspective is that the bitcoin may see and test the bottom of the channel, around $50k.

For Educational purpose only.The primary objective of the trading strategy is to generate consistent returns while managing risk effectively. Define whether you are trading for short-term profits, long-term growth, or a combination of both.

US500 BULLISH SYMMETRICAL TRIANGLEhi
Fundamental view
The **US500 index** dropped due to several key factors affecting the U.S. stock market:
📉 **Tech Stock Decline** – Technology stocks faced heavy pressure, especially after **Nvidia** plunged **6.9%** due to U.S. restrictions on AI chip exports to China. Other stocks like **AMD (-7.3%)** and **Micron Technology (-2.4%)** also fell.
💰 **Federal Reserve Uncertainty** – Remarks from **Fed Chair Jerome Powell** raised concerns in the market. Powell warned that new tariffs could trigger higher inflation and slow economic growth, making investors uncertain about interest rate policies.
🛍️ **Surge in Retail Sales** – Retail sales jumped **1.4%** in March as consumers rushed to buy before new tariffs took effect. This highlights economic uncertainty, pushing investors to sell their stocks.
Overall, a mix of trade tensions, uncertain monetary policy, and a tech stock sell-off caused the **US500 index to drop 120.93 points (-2.24%)** on **April 16, 2025**.
Technical view
Yes, the **bullish symmetrical triangle** pattern is often a strong signal for upward price movement. When the price moves within this pattern, it usually indicates a **tightening volatility** before a **breakout**, which can present a good market entry opportunity.
🔍 **Breakout Confirmation**
1️⃣ Increased trading volume when price breaks above the **upper trendline**.
2️⃣ A closing candle above the **triangle resistance** for a valid signal.
3️⃣ Price targets can be measured using the pattern’s initial height as a projection.
📈 **Potential Price Movement**
If the breakout happens, the price could surge toward the next **resistance level**. However, if the breakout fails and price moves below support, the pattern could turn **bearish**.
Warren Buffett famously said, “Be greedy when others are fearful.”
good luck
**My trading strategy is not intended to be a signal. It's a process of learning about market structure and sharpening my trading my skills also for my trade journal**
Thanks a lot for your support

BTC POTENTIAL TRIPLE TOP PATTERNhi
From the previous chart, the price successfully broke through the upper trendline and started to rise. This could indicate that bullish momentum is taking over. Waiting for the price to break the upper trendline is a solid strategy for confirming bullish momentum. However, there is a potential triple top pattern forming, which could indicate that the price may face rejection at a key resistance level 86056.35
If the triple top pattern becomes more apparent and the price fails to break above resistance, it could signal the start of a bearish move. In this scenario, trading volume and price action around the resistance zone are crucial to observe. If volume declines and selling pressure increases, the price may drop further.
good luck
**My trading strategy is not intended to be a signal. It's a process of learning about market structure and sharpening my trading my skills also for my trade journal**
Thanks a lot for your support

1st trade analysis after long pause on EUR/AUDhello,
my name is kirollos and this is my first try after long pause of trading.
this is EUR/AUD currency.
I know that most of bank are in holiday today but lets try this.
there is a downtrend on high-time frame like 30min and 1h , and there is a corrective move (channel) on 5min time-frame.
I drew fib level and the correction move reach the golden ratio between 50% and 61.8% , then I drew fib extension to predict the next move and I would be satisficed with 61.8% as my first take profit target.
I my forecast that liquidity move to me side which encourage me to continue.
feel free to criticize me idea .. I love to hear any thing from you but please clarify your idea to me to understand.
