Gold Buy Setup – Smart Money Flow & Institutional Order PositionGold (XAU/USD) is showing bullish potential, aligning technical, fundamental, and liquidity factors for a high-probability setup. Let’s break down the market structure, trade execution, and institutional flows that support this move.
📊 Trade Execution & Technical Breakdown
🔹 Entry Zone: Price retraced into a key demand zone aligning with the 0.62 Fibonacci level (2902.190).
🔹 Confluences: ✅ Trendline support held, confirming bullish momentum.
✅ Fibonacci retracement (50%-79%) aligned with institutional order blocks.
✅ Liquidity sweeps confirmed smart money accumulation.
🔹 Target Zones:
📈 First target: 2,926.183 (previous high).
📈 Final target: 2,950.176 (-0.62 Fibonacci extension).
📌 Market Structure:
The 1H timeframe suggests a bullish continuation pattern.
Daily EMAs are trending upwards, reinforcing buying pressure.
Supertrend indicator on the 4H supports bullish sentiment.
🎯 Institutional Positioning & Market Depth
📌 Commitment of Traders (COT) Report Insights:
📈 Institutional traders increasing long positions, signaling confidence in an uptrend.
📉 Retail traders are majority short, fueling a potential short squeeze.
📌 Liquidity Data:
Volume profile shows high demand near 2902, confirming strong buy-side interest.
Market depth data from Prime Market Terminal indicates institutional buy orders stacking in this range.
⚡ Fundamental Drivers – Key News & Events
📊 Economic data influencing XAU/USD:
📈 ISM Manufacturing PMI (53.5) vs. forecast (52.8) – Initially strengthened USD.
📈 Durable Goods Orders +3.2% – Positive US data caused a pullback.
📉 Gold supported by weaker USD following liquidity rebalancing.
🛑 Impact on Trade:
✔️ Initial USD strength provided a discounted long entry on Gold.
✔️ Market reacted with bullish momentum as institutional flows aligned with demand zones.
📈 Volatility & Liquidity Insights
📌 Prime Market Terminal Liquidity Analysis:
ATR (Average True Range) increased, signaling upcoming volatility.
High-volume nodes align with the 2902 support area.
Institutional order flow confirms bullish positioning.
🔥 Conclusion – High-Probability Long Setup
✅ Smart money accumulation & institutional order flow confirm a bullish bias.
✅ Confluence of technical, fundamental, and liquidity factors supports upside movement.
✅ Potential targets: 2,926 → 2,936 → 2,950.
📌 Did you catch this move? Let me know your thoughts in the comments! 🚀💬
Priceactionanalysis

USD/JPY – Precision Short Trade Breakdown🔥 Executed a precise short trade on USD/JPY this morning, aligning with institutional order flow and Prime Market Terminal insights. Here’s the full breakdown of how this setup played out!
🔍 Trade Setup & Analysis:
📌 Entry: 149.300 – Price rejected a key supply zone & Fibonacci retracement level.
📌 Stop Loss: 149.558 – Above key liquidity & invalidation area.
📌 Take Profit: 148.504 (first TP), 148.213 (final target).
📌 Risk-Reward Ratio: 1:3
📊 Prime Market Terminal Insights That Confirmed This Trade:
🔻 Institutional Positioning & Market Flow:
✔ Smart Money Report:
Large institutions were heavily net short USD/JPY, with leveraged funds reducing their long exposure.
Dealer intermediaries (banks and liquidity providers) also added more short positions, indicating further downside momentum.
✔ COT (Commitment of Traders) Data:
Open interest showed a significant drop in long positions, suggesting weakness in USD/JPY.
Hedge funds and asset managers increasing short exposure aligned with my bearish bias.
✔ DMX Open Interest:
66% of institutional traders were short on USD/JPY, confirming my sell-side setup.
Short positioning had increased by 34% in the last session, reinforcing my downside expectation.
🔻 Volatility & Liquidity Insights:
✔ Average True Range (ATR) Analysis:
ATR showed a high probability of an extended move, suggesting the potential for price to hit my targets.
Recent daily ranges indicated USD/JPY had room to move another 100+ pips to the downside.
✔ Session Range & Market Structure:
Liquidity grab above 149.300 supply zone, followed by strong rejection and sell-off.
Previous session lows were swept, indicating smart money targeting deeper liquidity.
Institutional orders clustered around 148.200, suggesting a likely downside target.
🔻 High-Impact News That Influenced USD/JPY:
📢 Japanese Unemployment Rate (Actual: 2.5% | Forecast: 2.5%) → No surprise, minimal impact.
📉 Business Capex (MOF YY) (-0.2% vs. 8.1% previous) → Indicated economic slowdown, weakening JPY demand.
📰 U.S. Economic Data Later Today:
Redbook YY (USD) expected at 6.2% – could impact USD sentiment.
Fed’s Williams speech on monetary policy could affect USD volatility, reinforcing our bias.
🎯 Trade Execution & Outcome:
✅ TP HIT! Price dropped as expected, hitting both targets with precision.
🚀 Perfect confluence of:
✅ Smart money selling pressure
✅ Liquidity sweep & supply zone rejection
✅ High-probability move from ATR analysis
📸 Prime Market Terminal Screenshots Included:
📊 DMX Open Interest → Confirmed institutions were net short.
📊 COT Data → Showed decline in long positions.
📊 ATR & Volatility Charts → Supported extended downside movement.
📊 Session Ranges & Market Structure → Confirmed liquidity grab & supply zone rejection.
🔑 Key Takeaways from This Trade:
✔ Trade with institutional momentum – Always check positioning before entering!
✔ Multiple confirmations = High probability setups – Don’t rely on a single indicator.
✔ Liquidity is key – Smart money moves price to hunt liquidity, trade accordingly.
✔ Fundamentals matter – Weak JPY capex data helped push price lower.
💬 What’s your view on USD/JPY? Will we see further downside? Drop your thoughts below!
📊 Follow for more trade setups, market analysis & strategy breakdowns!

Avoid Market Maker Traps: Liquidity Sweeps & FVG ExplainedUnderstanding Market Maker's Perspective: Liquidity Sweeps and Fair Value Gaps (FVG)
In this educational post, I'll dive into the smart money concepts (SMC) that help traders understand market behavior from a broker or market maker's perspective. This analysis will focus on liquidity sweeps, Fair Value Gaps (FVG), and how market makers use these strategies to manipulate price movements.
What is a Liquidity Sweep?
A liquidity sweep occurs when the market pushes through a known level of liquidity, such as stop losses or pending orders. This action often creates sharp wicks or sudden moves, typically engineered by smart money to gather liquidity for their positions.
Fair Value Gap (FVG) Explained
An FVG is a price gap between a consecutive bullish and bearish candle (or vice versa), leaving a void in the market. These gaps often act as magnets for price, as market makers seek to "fill" these gaps, using them as traps for retail traders.
The Retail Trader's Perspective
Many new traders view the FVG as a signal to enter the market, expecting price to move in their favor immediately. They often set stop losses below recent lows, providing market makers with a clear liquidity target.
How Market Makers Exploit Liquidity
Market makers often execute a classic trap strategy:
Push the price up slightly to create a false sense of security for retail buyers.
Execute a sharp move down to trigger stop losses and capture liquidity below key levels.
Finally, reverse the price direction sharply to the upside, aligning with their true market intent.
Practical Trading Strategy
For new traders, understanding this concept can help avoid common traps:
Avoid entering trades at the FVG without confirmation.
Look for signs of a liquidity sweep, such as long wicks or strong rejections.
Enter trades only after seeing a market structure shift (MSS) that confirms the true direction.
Conclusion
By thinking like a market maker, traders can align their strategies with smart money concepts, improving their chances of success. Always remain patient, seek confirmation, and avoid the traps set by market manipulation.
This post aims to educate traders on avoiding common pitfalls and developing a more strategic approach to trading using smart money concepts.

06.03.25.25 Morning ForecastPairs on Watch -
FX:GBPAUD
FX:GBPNZD
FX:USDCHF
A short overview of the instruments I am looking at for today, multi-timeframe analysis down to what I will be looking at for an entry. Enjoy!

#NIFTY Intraday Support and Resistance Levels - 06/03/2025Gap up opening expected in nifty above the 22400 level. After opening if it's sustain above this level and gives breakout of 22500 then expected further upside rally upto 22750 level in today's session. In case nifty starts trading below 22400 level then possible downside in index upto 22150 level in opening session.

[INTRADAY] #BANKNIFTY PE & CE Levels(06/03/2025)Today will be gap up opening expected in banknifty. Expected opening above 48550 level. After opening if banknifty sustain above this level then possible upside rally upto 48950. This level will act as a strong resistance for today's session. Any major downside rally expected below 48450 level. This downside rally can goes upto 48050 and can extend further in case breakdown of 48000 level.

Gold Price Analysis March 5⭐️Fundamental Analysis
Gold prices (XAU/USD) have stalled after two days of gains due to rising US bond yields, putting pressure on non-yielding gold. However, gold may be supported by safe-haven demand amid escalating trade tensions.
Specifically, the US imposed a 25% tariff on imports from Mexico and Canada, while China also increased tariffs to 20%, raising concerns about trade retaliation. At the same time, the US's suspension of military aid to Ukraine also prompted investors to seek gold. In addition, the situation became more tense when President Donald Trump and Ukrainian President Zelenskyy disagreed on peace negotiations.
⭐️Technical Analysis
It is clear that gold is rising and heading towards the resistance level of 2929. This is considered a key area for gold. If broken, gold will continue to increase in price to ATH 295x. If Gold breaks the trend and falls, 2903 will no longer be meaningful and it will be at the 2896 area that Gold will really have a price reaction.

Gold’s rally: $3,000/oz in Q1 2025 or a trap? New peak and sell?Gold has recently provided long traders with opportunities to step in and buy, but could the market be setting a trap—luring traders toward an all-time high (ATH) only to tumble shortly after? The $3,000 level is often seen as a sentimental milestone, yet there’s no historical trading record of gold sustainably reaching or surpassing it. So far, the rally appears driven by geopolitical tensions and typical price action behavior. Are we on the cusp of seeing gold hit $3,000 per ounce as early as Q1 2025, or is the market misleading us into thinking the pot is ready to boil over?
Two scenarios seem plausible (see image):
Gold reaches a new ATH, triggering a sell-off that draws in more buyers while allowing price action to build momentum toward $3,000/oz.Gold hits $3,000/oz, and the market turns that level into a new floor rather than a ceiling.
But if that happens, where does it go from there? That remains unclear.
What are your thoughts?
*Not financial advice.
Side note: I initially bought at $2,833.00 and took an early exit. Now holding a new entry at $2,895.00.
#FxHyenas

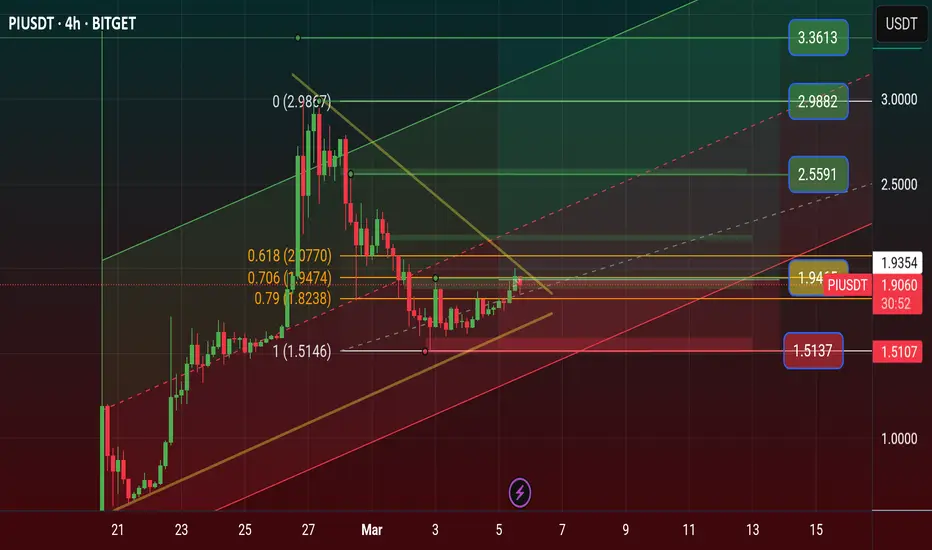
$PIUSDT Price Road to $11 Price Prediction 2025 Pi Network News: Can Pi Coin Price Hit $11? Key Levels Revealed, Pi Already Get place 11 of the Market.
Pi Network has gained 6.8% in the past 24 hours, outperforming major cryptocurrencies like Bitcoin (+7.5%), Ethereum (+8.9%), XRP (+11.1%), BNB (+9.8%), and Solana (+7.8%). But that’s not the real surprise.
Since its mainnet launch, PI's price has skyrocketed by an incredible 1,775.77%, while the overall crypto market has dropped by 11% in the same period. That’s a staggering contrast - and a sign that something big is happening.
With PI breaking key resistance levels and speculation about a major exchange listing growing, investors are wondering: How much higher can PI go? Could we see a breakout past $2? Let’s dive in.
💗 Why Is PI’s Price Rising?
Since February 20, PI has gained an incredible 1,775.75%, with a 7.5% jump in just the last 24 hours. This steady rise shows that Pi Network is moving independently of the broader market, maintaining strong momentum.
Key Reasons Behind PI’s Price Rally
Several factors are driving PI’s price increase:
Mainnet Migration Deadline Approaching
Pi Network is reaching its final deadline for users to migrate their holdings. According to a recent blog post from the team, March 17 is the last day to complete the migration. This deadline may be increasing buying pressure as investors prepare for the next phase.
🧡 Potential Binance Listing
Speculation around a Binance listing is another major factor. In a recent Binance community poll, over two-thirds of participants supported listing PI. If Binance or other major exchanges list it, the price could see a significant boost.
US Election Impact on Crypto
Donald Trump’s return to office is bringing a more crypto-friendly stance from the US government, which could benefit projects like Pi Network.
💝 Can PI Break $2.2?
Experts believe that if PI moves past the $2.2 resistance level with strong volume, it could rally toward $11. However, if it fails to break through, selling pressure could push it down to $1.5 Stoploss price area
To maintain its bullish trend, PI needs to hold support above $1.7. The price is currently just 1.11% below the key $2.2 level, making the next few days crucial in determining its next move.
🩷 Never Miss a Beat in the Crypto World!
Stay ahead with breaking news, expert analysis, and real-time updates on the latest trends in Bitcoin, altcoins, DeFi, NFTs, and more.
Pi Network has defied market trends and harsh criticism before, and if history is any guide, this rally might just be getting started.
🩵 Why Is Pi Coin’s Price Rising?
Pi Coin’s price is rising due to increasing exchange interest, migration deadlines, and strong community support, pushing demand higher.
💜 Nano History Will Pi Coin Reach $11?
If Pi breaks the $2 resistance with strong volume, experts predict a rally toward $11. Failure could lead to a drop below $1.5
💛 Is Binance Listing Pi Coin?
Binance has not officially listed Pi yet, but a recent community poll shows strong support, increasing the chances of a future listing.
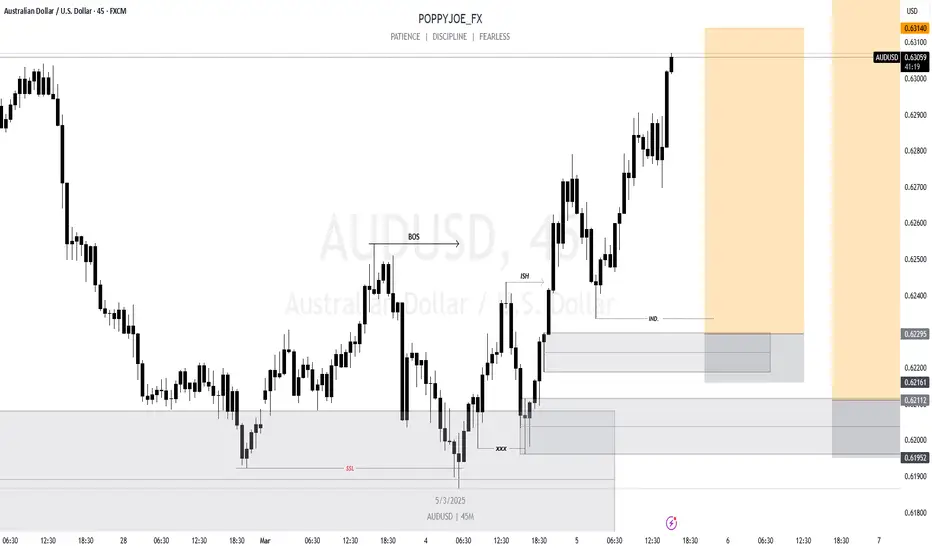
AUDUSD LONG TRADE IDEA📈 AUDUSD Buy Setup – Model 2 in Action! 🚀
I'm anticipating a BUY on AUDUSD based on my Model 2 strategy: SH + BOS + IDM + PDA. The market structure is aligning perfectly, and this setup is looking 🔥!
Will you be taking this trade? Let me know your thoughts in the comments! 💬👇
📌 Like, share, and drop your opinions below – let’s analyze together! 🚀📊
#ForexTrading #AUDUSD #TradingStrategy #MarketAnalysis
Gold Price ActionHello Traders!
I've marked the liquidity levels and drawn the supply and demand zones on the chart. After a liquidity grab, there's a potential drop from the fresh supply zone. I've kept the charts clean for easy analysis.
As always, manage your risk carefully. Good luck, trade safe, and wishing you all the best!

05.03.25 Morning ForecastPairs on Watch -
FX:USDJPY
FX:EURUSD
FX:USDCHF
A short overview of the instruments I am looking at for today, multi-timeframe analysis down to what I will be looking at for an entry. Enjoy!

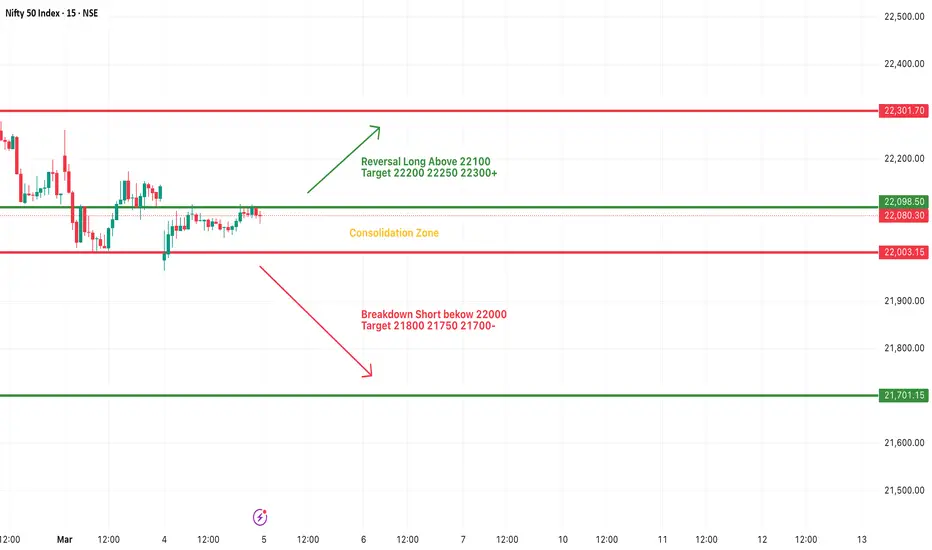
#NIFTY Intraday Support and Resistance Levels - 05/03/2025Today will be flat or slightly gap up opening expected in nifty near 22100 level. In last trading session nifty consolidated between the 22000-22100 zone. Any major upside rally only expected if nifty starts trading and sustain above 22100 level. Downside 22000 is the crucial support for nifty. Below this support level expected sharp downside fall in index.
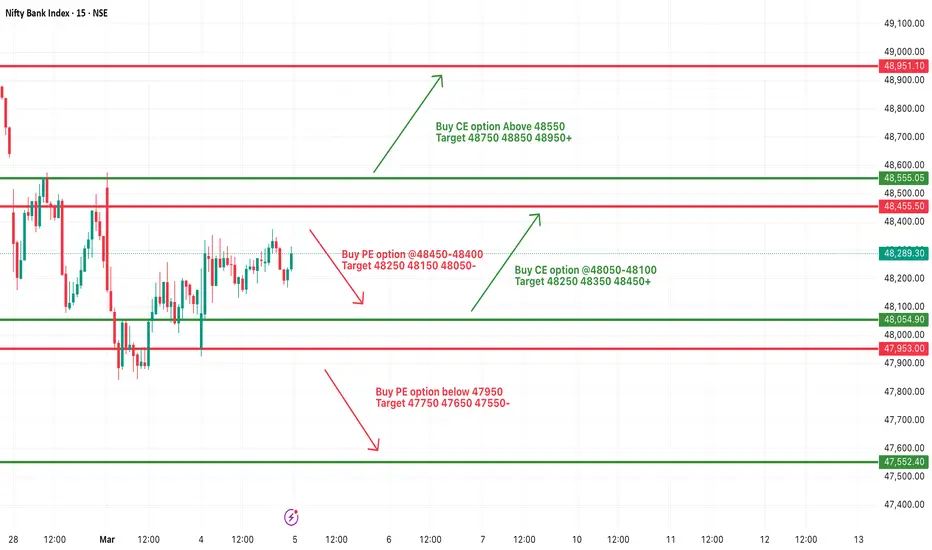
[INTRADAY] #BANKNIFTY PE & CE Levels(05/03/2025)Today will be flat opening expected in index. After opening it will trade in between the 400+ points range from 48050-48400 points. Any strong upside rally only expected above 48550 level. Downside 48050 level will act as a important support for today's session. Any major downside rally only expected below 47950 level.
Gold Price Analysis March 4⭐️Fundamental Analysis
The market is concerned about the risk of a global tariff war that seems inevitable. US President Donald Trump affirmed to impose 25% tariffs on Canada, Mexico and increase tariffs on China to 20%, leading to retaliatory measures from China and Canada, which could escalate into a full-blown trade war.
In addition, Trump suspended military aid to Ukraine, causing tensions with European allies. The market continues to monitor the upcoming US employment data, which could impact the Fed's interest rate policy, affecting the USD and gold prices.
⭐️Technical Analysis
Today's price range is focused on 2905 and 2877. The Dow trend will still be prioritized when Gold finds it difficult to close above important resistance zones. The Sell zones of 2905 and 2918 are heavily concentrated by sellers today. The furthest target of the week for gold will be to touch the bottom of last week around 283x. Pay attention to important price levels to have a reasonable BUY and SELL strategy.


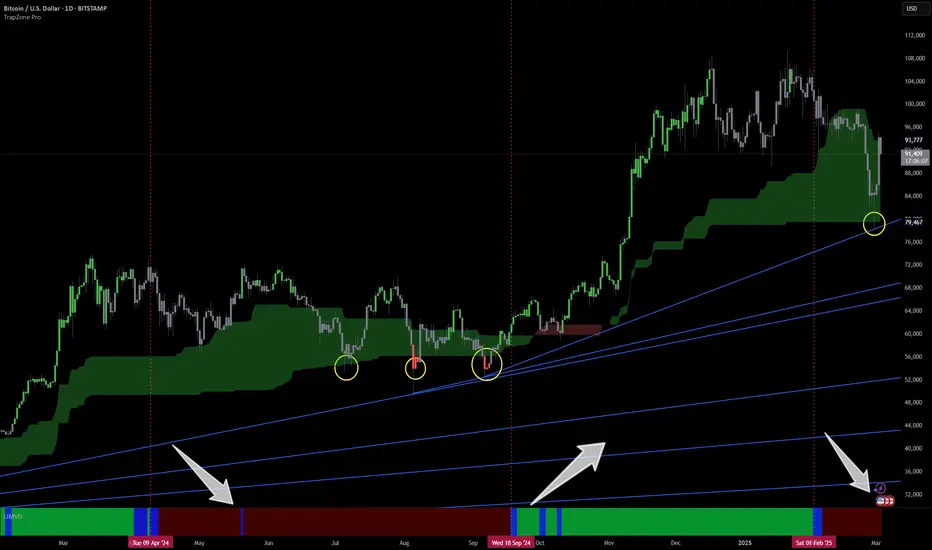
BITCOIN Technical analysis - This price action is familiar!See for yourself.
Since Apr 24 we had red UMVD and market went sideways. This is exactly what's happening right now. We have RED UMVD after a new high and now we just had first bounce from the bottom Green TrapZone. No Longs till we get fresh GREEN UMVD.
Small size plays only till, buy the bottom and sell the tops with this red UMVD.
Will post the hourly for close up next. Happy trading and stay safe, dear snowflakes!
04.03.25 Morning ForecastPairs on Watch -
FX:EURUSD
FX:GBPUSD
A short overview of the instruments I am looking at for today, multi-timeframe analysis down to what I will be looking at for an entry. Enjoy!

#NIFTY Intraday Support and Resistance Levels - 04/03/2025Gap down opening expected in nifty near the 22050 level. After opening if nifty sustain above 22050 level then only expected upside movement in index. Upside 22300 level will act as a strong resistance for today's session. Major downside fall expected in nifty in case it's starts trading below 22000 level. This downside can goes upto 21700 level.

[INTRADAY] #BANKNIFTY PE & CE Levels(04/03/2025)Today will be slightly gap down opening expected in market. After opening important level for banknifty is 48050. If it is sustain above this level then expected upside rally upto the 48450 level. Major downside expected below 47950. This downside can be possible of 400-500+ points in index. Upside 48450 level will act as a strong resistance for today's session.

EUR/USD: Bearish Outlook – Targeting 1.03630 & Below 📊 Market Structure & Key Levels
EUR/USD is currently rejecting a key supply zone (1.0450 - 1.0480), showing strong signs of continued downside pressure. The pair is in a bearish trend, with price action confirming lower highs and lower lows, as seen in the Prime Market Terminal charts.
📉 Key Levels to Watch:
Supply Zone: 1.0450 - 1.0480 (Strong resistance & liquidity zone)
Demand Zone: 1.03630 - 1.03219 (Institutional liquidity target)
Extended Bearish Target: 1.02687 (Deep liquidity grab area)
🔍 Trade Setup: Bearish Bias Towards Key Support Levels
📌 Entry: Sell between 1.0450 - 1.0480
🎯 TP1: 1.03630 (Liquidity Zone)
🎯 TP2: 1.03219 (Institutional Liquidity Grab)
🎯 TP3: 1.02687 (Extended Downside Target)
❌ SL: 1.05150 (Above Key Resistance)
📉 Why This Trade? (Prime Market Terminal Analysis)
✔️ Bearish Market Structure – The 1D & 4H trend remains bearish, confirming a downward trajectory. Supertrend is bearish, and price is trading below the 72 EMA & 288 EMA, showing weak bullish momentum.
✔️ Liquidity Targets Identified – Market depth analysis from Prime Market Terminal reveals a lack of strong buy orders above 1.0450, suggesting that sellers dominate.
✔️ Volume Profile Analysis – The visible range (VPVR) highlights a high-volume node at 1.03630, making it a strong area for price to seek liquidity.
✔️ Commitment of Traders (COT) Data – Institutional positioning indicates an increase in short contracts for the EUR, aligning with the bearish trend.
✔️ Order Flow & Market Depth – Prime Market Terminal shows institutional sellers stacking sell orders at 1.0450, while liquidity pools rest below 1.03630 and 1.03219, making these ideal targets for price.
📰 High-Impact News to Watch
⚠️ HICP Flash Inflation Data (EUR - March 3, 2025) – Any deviation from expectations could drive EUR volatility.
⚠️ ISM Manufacturing PMI (USD - March 3, 2025) – A stronger-than-expected report could strengthen USD and drive EUR/USD lower.
⚠️ Fed's Musalem Speech (March 3, 2025) – A hawkish stance could accelerate EUR/USD downside pressure.
📌 Final Thoughts: Follow the Trend & Manage Risk!
EUR/USD remains firmly bearish, with liquidity resting below 1.03630. The confluence of institutional positioning, bearish trend confirmation, and market depth insights support a sell bias. Watch price action at key levels and manage your risk accordingly!
🔥 What’s your bias? Drop your thoughts in the comments! 🔥

Let us Swing GBPUSD !!!Hello everyone, happy new week and a happy new month of March to you all !!!
First of, fundamentals are heavy on the pounds this week, coupled with the fact that this is non-farm payrolls week. (Fundamentals).
Secondly, there was a market Structure shift last week which is signaling more bearish momentum.
This setup overall has a stop loss of less than 40 pips from the H4 Order Block but if you need a tighter Stop, you definitely can go sharpen the entry in a lower timeframe.
Use proper risk and money management and do not over-leverage your account.
Most especially, do your own analysis !

Brenker block or Order Block + Inducement = Profits EverywhereHello everyone, happy new week and a happy new month of March to you all !!!
First of, fundamentals are heavy on EURUSD this week, like really heavy. Coupled with the fact that this is non-farm payrolls week. (Fundamentals).
Secondly, there was a market Structure shift last week which is signaling shorts.
This setup overall has a stop loss of less than 35 pips from the breaker block but if you need a tighter Stop loss then you can use the other point of interest which is the order block i marked out.
Use proper risk and money management and do not over-leverage your account.
Most especially, do your own analysis !
