#NIFTY Intraday Support and Resistance Levels - 11/04/2025Gap up opening near 23000 level expected in nifty. After opening if nifty starts trading above 23050 level then expected further upside rally upto 23250+ level in opening session. Downside 22800 level will act as a strong support for today's session. Any major downside rally only expected if nifty not sustain above level and starts trading below 22750 level.
Priceactionanalysis

[INTRADAY] #BANKNIFTY PE & CE Levels(11/04/2025)Today will be strong gap up opening expected in banknifty. Expected opening above 51000 level. If banknifty starts trading and sustain above 51050 level then expected further upside rally upto 51450+ level and this can be extends for further 400-500+ points if gives breakout of 51550 level. Below 50950 level expected downside movement in index upto 50550 support level.

10.04.25 Morning ForecastPairs on Watch -
FX:EURGBP
FX:NZDCAD
FX:AUDJPY
A short overview of the instruments I am looking at for today, multi-timeframe analysis down to what I will be looking at for an entry. Enjoy!

Gold Analysis April 9D1 frame is a Doji candle with unclear buying and selling power. but the market is still in the structure of a corrective downtrend.
H4 shows a strong increase from 2970 to 3050 due to data from fundamental analysis
Trading scenario: Gold is approaching the fionacci retracement zone. Pay attention to the two SELL zones today 3063-3065 and the zone 3089-3091.
For gold to move towards the upper SELL zone, gold needs to surpass 3047. If it does not break 3047 and close below 3039, wait for a retest to SELL to 3021 in the US session. If it does not break 3021, then BUY again in this zone. If it confirms closing below 3021, hold at 2990 today.

09.04.25 Morning ForecastPairs on Watch -
FX:EURAUD
FX:EURNZD
FX:EURGBP
A short overview of the instruments I am looking at for today, multi-timeframe analysis down to what I will be looking at for an entry. Enjoy!

#NIFTY Intraday Support and Resistance Levels - 09/04/2025Today will be slightly gap down opening expected in nifty. After opening if nifty starts trading below 22450 level then possible sharp downside rally in index upto 22250 level. 22250 will act as a strong support for today's session. Any major downside in index expected below this support level. Upside rally expected if nifty starts trading and sustain above the 22550 level in today's session

[INTRADAY] #BANKNIFTY PE & CE Levels(09/04/2025)Today will be flat opening expected in index. After opening if banknifty sustain above 50550 level then expected upside movement upto 50950 in today's session. Major downside expected if banknifty starts trading below 50450 level. This downside rally can goes upto 50050 support level. 50000-50050 is the important support for index. Any Strong downside only expected below this support zone.

EURUSD - Short Trade Confirmation :
1. Bearish Order-Flow
2. Market retraced to the supply zone with the help of previous demand, which is liquidity now
3. Tapped into the premium supply zone
4. M5 CHoCH to the downside
5. Previous high reacted as an Inducement
6. Entered in the supply tap
The only thing that is concerning the trade is market tapped into the 15m support trend-line. Once the trend-line is taken out with the strong bearish candle closure, that can add an confluence to the trade.
Thanks for the time..

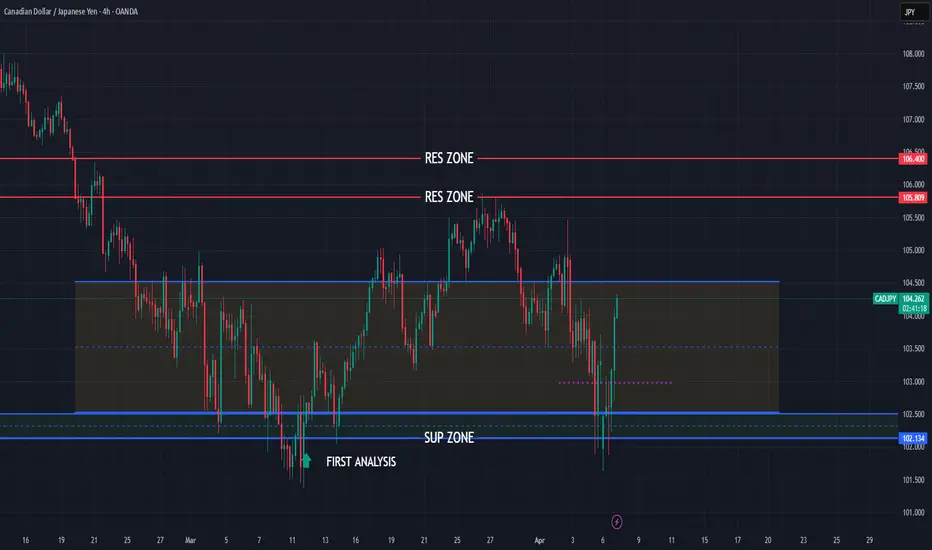
CADJPY still bullish expecting
OANDA:CADJPY first analysis highly accurate it's attached.
In first analysis i am share bullish view, having op we are not see some special big bullish move and based on PRICE ACTION analysis expecting here new bullish push.
SUP zone: 102.500
RES zone: 105.800, 106.400
08.04.25 Morning ForecastPairs on Watch -
FX:EURNZD
FX:EURAUD
FX:CHFJPY
FX:EURGBP
A short overview of the instruments I am looking at for today, multi-timeframe analysis down to what I will be looking at for an entry. Enjoy!

#NIFTY Intraday Support and Resistance Levels - 08/04/2025Gap up opening in nifty. After opening if nifty sustain above 22500 level then possible upside move upto 22750+ level in opening session. 22750 level will act a strong resistance expected reversal from this level. If nifty starts trading below 22400 then possible sharp downside rally upto 22050 in today's session.

[INTRADAY] #BANKNIFTY PE & CE Levels(08/04/2025)Today will be gap up opening expected in banknifty near 50500 level. After opening if banknifty starts trading above 50550 level then expected upside rally upto 50950 level in today's session. 50950 will act as a strong resistance. Bullish movement can reversal from this level. In case banknifty starts trading below 50450 then possible further sharp downside rally upto 50050 and this can extend upto 49550 level if index gives breakdown of 50000 level and starts trading below 49950.

SPX WEEKLY 7TH APRIL 2025Welcome to SPX weekly. I have deeply discussed the price action here. If you have any doubts, feel free to leave a message or comment below.
NOTE:DO NOT SHORT

07.04.25 Morning ForecastPairs on Watch -
FX:EURUSD
FX:GBPUSD
FX:EURGBP
FX:GBPCAD
A short overview of the instruments I am looking at for today, multi-timeframe analysis down to what I will be looking at for an entry. Enjoy!

#NIFTY Intraday Support and Resistance Levels - 07/04/2025Strong gap down opening expected in nifty near 22050 level. After opening if nifty sustain above 22050 level and gives reversal then expected some correction rally upto 22450 level. This level will act as a strong resistance for today's session. Any bullish side rally can reverse from this level. Downside in case nifty gives breakdown of 22000 level and starts trading below 21950 then expected sharp downside upto 21550 level in today's session.

[INTRADAY] #BANKNIFTY PE & CE Levels(07/04/2025)Today will be huge gap down opening expected in banknifty near 1500+ points downside possible. Possible banknifty will open near 49750 level in today's session. After opening if any correction can reverse from 50450 level. Downside next support for banknifty is near 49550 level. If banknifty not hold this support level and starts trading below 49450 level then expected further selling and downside movement in index for 700-1000+ points upto the 48550 level.

04.04.25 Morning ForecastPairs on Watch -
FX:GBPUSD
FX:USDJPY
FX:NZDUSD
A short overview of the instruments I am looking at for today, multi-timeframe analysis down to what I will be looking at for an entry. Enjoy!

#NIFTY Intraday Support and Resistance Levels - 04/04/2025Gap down opening expected in nifty near 23200 level. After opening if nifty starts trading below this level then possible strong downside upto 23000 level in opening session. Currently consolidated movements in nifty. If nifty sustain above 23250 level then possible upside movement upto 23450 level. For today's session 23450 level will act as a strong resistance for index.

[INTRADAY] #BANKNIFTY PE & CE Levels(04/04/2025)Today will be gap down opening in banknifty. After opening if banknifty starts trading below 51450 level then expected downside upto 51050 level. For today's session 51000 level will act as a strong support for banknifty. Any major downside only expected below 50950 level. Strong upside rally possible if index starts trading and sustain above 51550 level.

Gold Analysis March 4Fundamental Analysis
Persistent concerns over the potential economic impact of US President Donald Trump’s tit-for-tat tariffs could act as a catalyst for the safe-haven precious metal.
Meanwhile, risk-off sentiment, coupled with expectations that a tariff-induced slowdown in the US economy could force the Federal Reserve (Fed) to resume its rate-cutting cycle early, has caused a sharp decline in US Treasury yields. This, in turn, has pushed the US dollar (USD) to its lowest level since October 2024 and helped limit the downside in non-yielding gold. Therefore, it would be prudent to wait for a sharp sell-off to confirm that XAU/USD has topped out.
Technical Analysis
Today’s trading range is likely to see a fairly high probability of a drop. If it breaks 3116, gold will find its way back to 3081. In case gold breaks the downward structure as analyzed in the upward direction, pay attention to the SELL zone around 3148-3150. Wishing everyone a successful trading day.

03.04.25 Morning ForecastPairs on Watch -
FX:EURAUD
FX:GBPAUD
A short overview of the instruments I am looking at for today, multi-timeframe analysis down to what I will be looking at for an entry. Enjoy!

My Retrace and Bull Run For EUR/USD After Tariff Announcements!The chart is pretty clear, I wouldn't advise you trade this however this is my idea of where price could move so leave a comment with any ideas you might have, Happy Trading!!!

Gold Price Analysis April 2The D1 candle has a red candle and the selling pressure has started to take profit of Gold but it is still unclear.
The most recent H4 candle cluster shows 2 important price zones 3135 and 3108. Breaking this boundary will form a new trend.
Trading plan: Gold pushes to 3108 and does not break this zone in the European session, then BUY GOLD to 3124. At the end of the European session, if it breaks 3124, then keep the order to 3135 and 3164 in the US session if it breaks the resistance. If it breaks 3108, do not buy anymore but wait for Sell Break out 3108, target day 3084, pay attention to the price reaction at 3100 (resistance of last night's session). If 3100 is broken, then SELL DCA, not BUY at 3100. Scenario 2: Price does not return to 3108 first but to 3124 in the European session. If it is not broken, then SELL 3124 to 3108 and breaks the 3108 area in the US session, then the TP scenario is the same as scenario 1. If 3124 is broken, then 3135 waits for a breakout when it breaks, it will be better to SELL down today. (Note the SELL scalp point around 3142)
