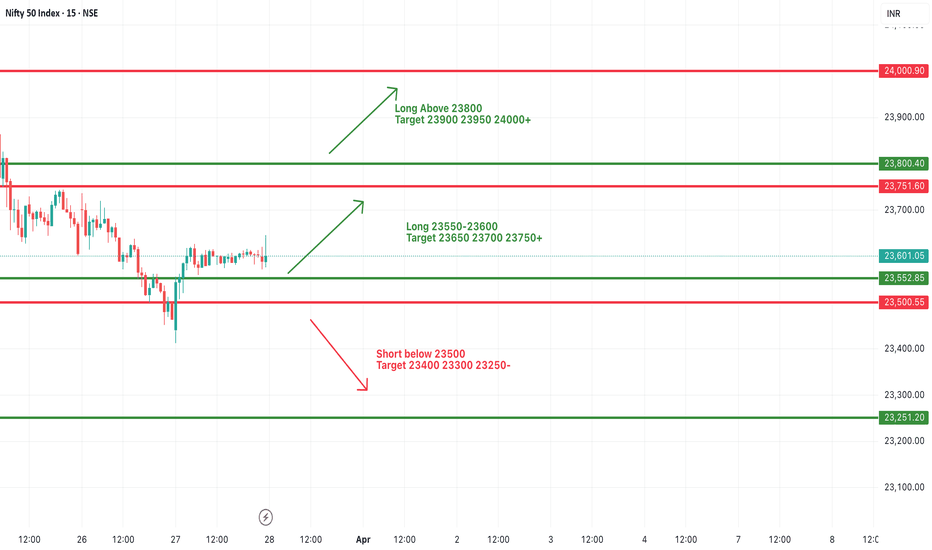
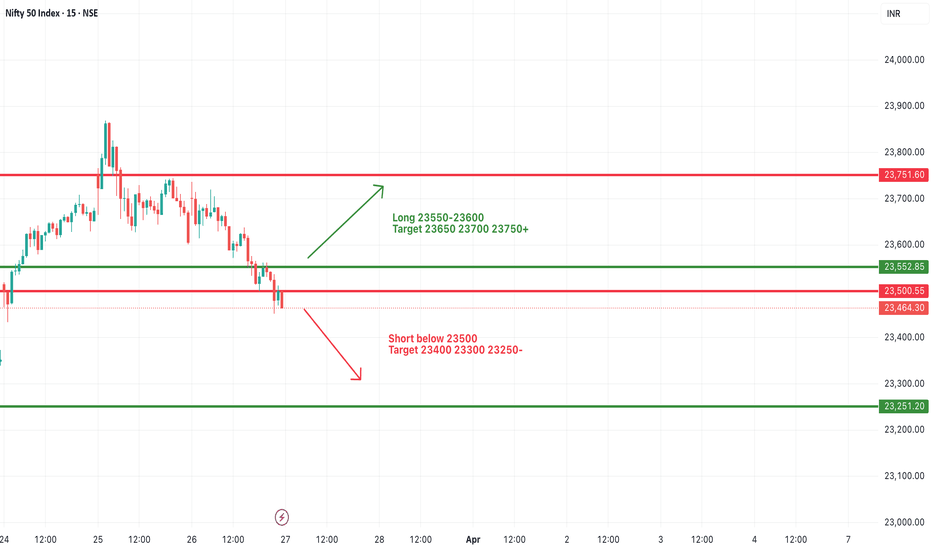
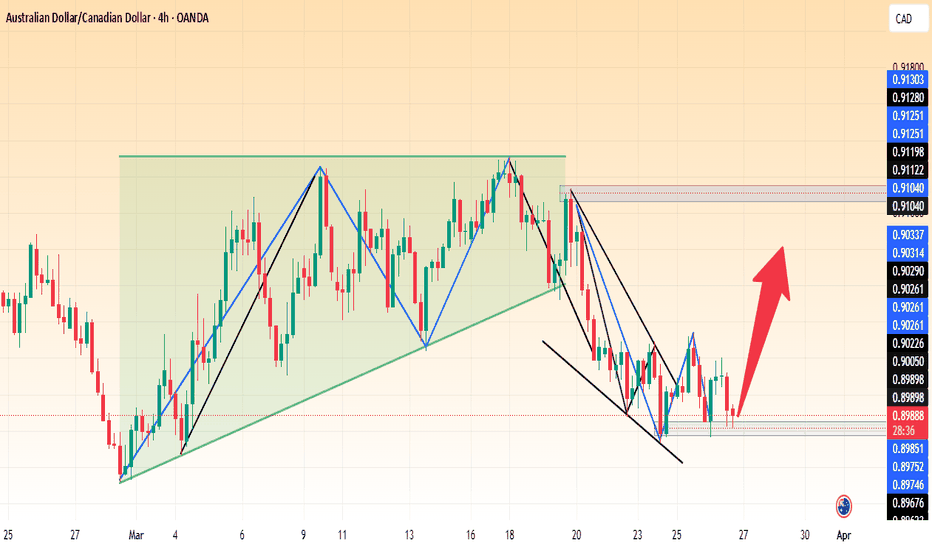
SP500 1D | PlanThe reaction and closes of the price in the current area are very important. A close above the 200 EMA and DO within a few days is crucial. If the price fails to recapture the dark blue box as I indicated, I expect to see the price action, brush movement I have drawn below. The area of the purple box where MO and pMO are located will be the target.
Happy Trading
Priceactionanalysis
Gold August 2. Approaching all-time high🌿Fundamental Analysis
Gold prices showed absolute strength in the European session on Friday ahead of the US Non-Farm Payrolls (NFP) data for July. The official jobs data will indicate the current state of the labor market, which will influence market speculation about the US Federal Reserve (Fed) cutting interest rates in September.
Investors will also focus on Average Hourly Earnings data, a key measure of wage growth that boosts consumer spending and ultimately drives price pressures.
Meanwhile, the deepening risk of an all-out war between Iran and Israel has improved Gold’s appeal as a safe haven. Iran has vowed to retaliate for the assassination of Hamas leader Ismail Haniyeh with an Israeli airstrike in Tehran.
🌿Technical Analysis
In terms of Elliot wave, Gold may have formed wave 5 and is trading in an abc recovery wave. or a recovery could occur after Nonfarm pushing gold prices to the 2442-2430-2422 support zone to continue to return to wave 5 to break the all-time high.
The 14-day relative strength index (RSI) is rising to near 60.00. If RSI rises above that level, the momentum will continue to increase strongly.
We will wait for recovery waves to buy gold today, or look for resistance zones to catch the recovery wave.
SELL zone 2472 - 2474 SL 2478
SELL zone 2482-2484 SL 2487
BUY zone 2433 - 2431 SL 2427
BUY zone 2422 - 2420 SL 2416
Gold benefits after FOMC announcement☘️Fundamental analysis
Gold prices hovered around the $2,450 region on Thursday and are currently trading just below a two-week high. Traders were bullish amid the prospect of the Federal Reserve (Fed) rate-cutting cycle coming to a head, underpinning the yellow metal without yield.
Bets were reaffirmed by the Fed’s relatively dovish outlook on Wednesday, which sent US Treasury yields to multi-month lows and boosted the US Dollar (USD). Geopolitical tensions in the Middle East also added to the upside. Positive Outlook for Safe-haven Gold That said, the risk-on tone is generally seen as a drag and cap on XAU/USD.
☘️Technical Analysis
From a technical perspective, the breakout above the 2430 resistance last night has officially put gold in the bullish phase of wave 3 of the Elliot Wave pattern. Furthermore, if there is a move above 2450, a return to the old highs is not far away. Hence, some further strength towards the next relevant hurdle near the $2,468-2,469 region, en route to $2,483-2,484.
On the other hand, today’s Asian low, around the $2,437 region, now seems to protect the immediate downside ahead of the $2,432 region. Any further declines can now be viewed as buying opportunities and remain capped near the resistance breakout point of $2,413-2,412.
The RSI is in the overbought zone, indicating that buying interest is still high and the possibility of a push higher for gold remains in favor. The bullish channel is still holding strong with major support around 2422. The two EMAs are expanding with EMA 34 above EMA 89. Overall the market is still in a strong uptrend and we will wait for recovery points to BUY.
Resistance: 2452 - 2459 - 2464 - 2475
Support: 2433 - 2425 - 2420 - 2412
SELL zone 2472 - 2474 stoploss 2478
BUY zone 2433 - 2431 stoploss 2427
BUY zone 2422 - 2420 stoploss 2416
GBPNZD Good potential Currency pair to dropAs I look at this chart, I consider this as a good potential chart to drop further.
However I just recently see this opportunity and didn't set my order, but I will set my pending order based on the sell order I put on the chart.
If you found my analysis suitable for yourself, please like and subscribe to get access on my new analysis and updates.
Good luck!
Ethereum 2nd Test on our demand zoneEthereum decided not to continue with the trend but to conduct a second test before the rally. This pattern is very natural when the market breaks a channel and seeks equilibrium points in demand zones.
Our plan remains in place. Remember that markets need to make pauses or retests before taking action. Additionally, we must consider that markets, in general, have been bearish—we are in a bear market. However, the points of interest I have marked are based on historical prices and significant liquidity, so we can expect aggressive movements once the price reaches the indicated zones.
Thank you for your support, and don't fear these bear markets; on the contrary, we should average in and take advantage of the opportunities they offer us.
Regards
SWING IDEA - BIRLASOFTBirlasoft , a leading global IT services company, is showing technical signals that suggest a promising swing trading opportunity.
Reasons are listed below :
720 Resistance Zone Breakout : The 720 level has been a significant resistance zone, and the price has recently broken out above this level decisively, indicating strong bullish momentum.
Bullish Engulfing Candle on Daily Timeframe : The formation of a bullish engulfing candle on the daily chart indicates strong buying pressure and further supports the bullish case.
Price Action Above 50 EMA : The stock is trading above the 50-day exponential moving average (EMA), reinforcing the overall bullish sentiment and providing a strong support level.
Volume Spike : A noticeable increase in trading volumes confirms the strength of the price move and indicates growing investor interest.
Target - 790 // 855
Stoploss - Daily close below 670
DISCLAIMER -
Decisions to buy, sell, hold or trade in securities, commodities and other investments involve risk and are best made based on the advice of qualified financial professionals. Any trading in securities or other investments involves a risk of substantial losses. The practice of "Day Trading" involves particularly high risks and can cause you to lose substantial sums of money. Before undertaking any trading program, you should consult a qualified financial professional. Please consider carefully whether such trading is suitable for you in light of your financial condition and ability to bear financial risks. Under no circumstances shall we be liable for any loss or damage you or anyone else incurs as a result of any trading or investment activity that you or anyone else engages in based on any information or material you receive through TradingView or our services.
@visionary.growth.insights
SWING IDEA - CAPLIN POINT LABORATORIESCaplin Point Laboratories , a leading pharmaceutical company known for its focus on generic formulations with strong fundamentals, presents an attractive opportunity for swing traders and investors.
Reasons are listed below :
Support Zone at 1200-1250 : Caplin Point Laboratories has established a strong support zone in the range of 1200-1250, showcasing its resilience and attracting buying interest at these levels.
Bullish Hammer on Weekly Timeframe : A bullish hammer candlestick pattern observed on the weekly timeframe signals a potential reversal of the downtrend and indicates bullish sentiment among investors.
Bullish Engulfing on Daily Timeframe : The formation of a bullish engulfing candlestick pattern on the daily timeframe, engulfing ten previous daily candles, reinforces the bullish outlook and suggests a shift in momentum in favor of Caplin Point Laboratories.
0.5 Fibonacci Support : Finding support at the 0.5 Fibonacci level strengthens the bullish case and provides a solid foundation for potential upward movement.
Higher Highs : The stock has consistently formed higher highs, reflecting a trend of increasing bullish momentum and indicating potential for further upward movement.
Trading Above 50 and 200 EMA on Weekly Timeframe : Caplin Point Laboratories is trading above both the 50 and 200 Exponential Moving Averages (EMA) on the weekly timeframe, further confirming its bullish momentum.
Target - 1410 // 1540 // 1620
Stoploss - weekly close below 1207
DISCLAIMER -
Decisions to buy, sell, hold or trade in securities, commodities and other investments involve risk and are best made based on the advice of qualified financial professionals. Any trading in securities or other investments involves a risk of substantial losses. The practice of "Day Trading" involves particularly high risks and can cause you to lose substantial sums of money. Before undertaking any trading program, you should consult a qualified financial professional. Please consider carefully whether such trading is suitable for you in light of your financial condition and ability to bear financial risks. Under no circumstances shall we be liable for any loss or damage you or anyone else incurs as a result of any trading or investment activity that you or anyone else engages in based on any information or material you receive through TradingView or our services.
@visionary.growth.insights
SWING IDEA - ROSSARI BIOTECHConsider a compelling swing trade opportunity in Rossari Biotech , a leading specialty chemicals manufacturer in India, renowned for its innovative and sustainable solutions across various industries.
Reasons are listed below :
Price at Support Zone : Rossari Biotech is trading at its support zone, where it was initially listed, indicating potential buying interest and stability at these levels.
Doji Candle Formation : A doji candlestick pattern has formed, confirming the bullish momentum indicated by the preceding marubozu candle. This suggests that the price is holding onto higher levels and may continue to move upward.
0.618 Fibonacci Support : Finding support at the 0.618 Fibonacci level strengthens the bullish case, providing a solid foundation for potential upward movement.
Initiation of Double Bottom Pattern : The beginning of the formation of a double bottom pattern suggests a potential trend reversal and bullish continuation, indicating a shift in market sentiment.
Increase in Volumes : An increase in trading volumes reflects growing market interest and potential accumulation by investors, adding confirmation to the bullish thesis for Rossari Biotech.
Target - 809 // 890
StopLoss - weekly close below 655
DISCLAIMER -
Decisions to buy, sell, hold or trade in securities, commodities and other investments involve risk and are best made based on the advice of qualified financial professionals. Any trading in securities or other investments involves a risk of substantial losses. The practice of "Day Trading" involves particularly high risks and can cause you to lose substantial sums of money. Before undertaking any trading program, you should consult a qualified financial professional. Please consider carefully whether such trading is suitable for you in light of your financial condition and ability to bear financial risks. Under no circumstances shall we be liable for any loss or damage you or anyone else incurs as a result of any trading or investment activity that you or anyone else engages in based on any information or material you receive through TradingView or our services.
@visionary.growth.insights
GBPUSD under sell pressureBased on the chart on 1H timeframe , It expect that the support line hold the price above 1.2830 but this area break clearly and price dropped.
So I have bearish outlook to this chart.
If you are interested to access more charts, signals and updates, please like and subscribe.
Good luck!
Gold forms wave 5 of the Elliot wave☘️Fundamental analysis
At the beginning of the Asian trading session on July 25, gold fell deeper than 1%, as of the time this article was completed, gold was trading at 2,372 USD, equivalent to a decrease of 25Dollar during the day.
But times have changed and things have changed now so I changed my mind. The Fed should cut interest rates, preferably at its interest rate meeting next week.
Gold traders are now awaiting second-quarter US GDP data today (Thursday), as well as the latest personal consumption expenditures (PCE) price index on Friday, as this is the gauge Fed's preferred inflation.
Although gold has been supported by news from India that has reduced import tax on gold and silver from 15% to 6%. But the main reason why gold prices are still being sold off is partly due to profit-taking motivation, and a Partly because Trump's victory will support the Dollar, Trump is known as the President with a harsh tariff stance.
The main factor currently supporting gold prices is market expectations that the Federal Reserve may actually decide to cut interest rates before September.
☘️Technical analysis
After reaching the 0.5 Fibo retracement zone of the gold downtrend, wave 5 has formed and we are waiting for the end of wave 5 to catch the recovery wave. Note support points to BUY around 2363-2362. If this price range is broken, the next strong support zone is around 2350.
Gold has formed a falling price channel with key resistance levels at 2384 and 2400. Today's price range zones are used to trade news and enter orders when the signal touches an important price zone.
Trading signals
SELL zone 2398 - 2400 Stoploss 2404
SELL zone 2382-2384 stoploss 2387
BUY zone 2364 - 2362 stoploss 2358
BUY zone 2352 - 2350 stoploss 2346
Wishing you a successful trading day
Waiting for recovery to buy✨Fundamental Analysis
Gold prices extended gains and traded near the psychological 2400 level. The US Personal Consumption Expenditures (PCE) price index data released on Friday showed a modest increase in inflation in June and raised expectations of the imminent start of the Federal Reserve's (Fed) interest rate cutting cycle. This led to further declines in US Treasury yields, which also supported gold prices.
Traders also preferred to wait for the outcome of the two-day Federal Open Market Committee (FOMC) meeting on Wednesday. This, along with important US macroeconomic data scheduled at the beginning of the new month, including the Non-Farm Payrolls (NFP) report, will provide fresh impetus to gold.
✨Technical Analysis
Buyers are struggling to capitalize on the bullishness in the European session to push gold towards the 2,400 level. Meanwhile, the momentum above the $2,400 round figure is likely to face some resistance near the 2,408 area, around the $2,432 area.
On the other side. The immediate support that gold receives is around the 2,382-2,380 level. Weakness below $2,380 may be more unlikely to push the price back to the breakout zone, currently anchored near the $2,360-2,359 area.
The bullish trend is preferred by investors and they are waiting for a nice retest to get a BUY signal in line with the main trend of the market.
Resistance: 2408 - 2431
Support: 2382 - 2365
SELL price range 2408-2410 Stoploss 2413
BUY price range 2380 - 2382 stoploss 2377
XAUUSD | GOLDSPOT | New perspective | follow-up detailGold prices surged 1% on Friday as U.S. Treasury yields fell, driven by optimism for a potential interest rate cut by the Federal Reserve in September. Data showed U.S. prices rose modestly in June, giving Fed policymakers fresh evidence of progress in their battle against inflation. The personal consumption expenditures (PCE) price index increased by 0.1% last month, pushing benchmark 10-year note yields to a one-week low.
In this video, we analyze the impact of these fundamental dynamics on the Gold market and explore the technical implications on the charts. With the Federal Reserve's monetary policy decision coming up next week, the central bank is expected to keep rates unchanged. However, this meeting could set the stage for the first rate cut in September.
What can we expect from the gold market in the coming week?
XAUUSD Technical Overview:
This week, we're focusing on the crucial $2,390 level. This is a big deal for gold traders - it could be a make-or-break point. If gold stays above $2,390: Bulls might take control, potentially pushing prices higher and setting up new highs. If gold maintains selling pressure below $2,390: Bears might gain the upper hand, and prices could head south respecting the descending channel in the process. Join me as we explore these factors and potential opportunities in the gold market. Like, subscribe, and hit the notification bell for the latest analysis and insights!
#Gold #GoldPrices #FederalReserve #InterestRates #Forex #Trading #MarketAnalysis #TechnicalAnalysis #PCE #USInflation #TreasuryYields #Investing #Finance #EconomicData #ForexTrading #XAUUSD📺🔔💼
Disclaimer Notice:
Trading in the foreign exchange market and other instruments carries a high risk and may not be suitable for all investors. The content provided here is for educational purposes only. Evaluate your financial situation and consult with a financial advisor before making any investment decisions. Past performance is not indicative of future results.
Gold is supported to increase☘️Fundamental Analysis:
Gold prices are rising above $2,420 on Wednesday, reversing an intraday decline to $2,400. Israel’s attack on the Lebanese capital in retaliation for a rocket attack in the Golan Heights on Saturday has raised the risk of further escalation of geopolitical tensions in the Middle East.
In addition, the outlook for sluggish global economic growth and the further retreat of the US Dollar (USD) from a near three-week high hit on Tuesday are in the gold’s favor. However, bulls may refrain from placing aggressive bets and prefer to wait for further signals on the Federal Reserve’s (Fed) interest rate cut path. Therefore, the focus will remain on the outcome of the two-day Federal Open Market Committee (FOMC) meeting, scheduled to take place later today. This, along with geopolitical developments, will determine the trajectory for gold.
☘️Technical Analysis:
From a technical perspective, the recent rebound from the vicinity of $2,350 or the 50-day Simple Moving Average (SMA) support and the subsequent move above $2,400 favors bullish traders. Moreover, the oscillators on the daily chart have started to gain positive traction and support the further upside outlook. Moreover, the strength to break above the $2,412-2,413 zone reaffirms the positive outlook and would now lift Gold prices towards last week’s high around $2,432. Sustained strength to break above the latter zone would suggest that the corrective decline from the all-time high reached earlier this month is over.
On the other hand, the $2,400 mark now looks to protect the immediate downside ahead of the $2,388-2,390 zone below which gold could slide back to the 50-day SMA, currently anchored near the $2,359 zone. A convincing break through the latter zone, leading to a further decline below last week’s low, around the $2,353 zone, would be seen as a fresh trigger for bearish traders and leave XAU/USD vulnerable.
Resistance: 2429 - 2433 - 2459
Support: 2400 - 2392 - 2388
SELL price zone 2431 - 2433 stoploss 2437
BUY price zone 2391 - 2389 stoploss 2385
BUY scalp price zone 2399 - 2397 stoploss 2394
EURUSD Analysis week 31🌐Fundamental Analysis
After recovering to 1.0870 early Thursday, EUR/USD lost momentum and closed the trading day almost unchanged at just higher 1.0850 as the US Dollar (USD) benefited from upbeat data releases. Although risk sentiment appeared to be improving early Friday, the Euro struggled to attract buyers.
Next week, the key EU-wide Harmonized Consumer Price Index (HICP) inflation figures will drop on Wednesday, giving investors a clear picture of when they can expect the ECB to cut interest rates next after policymakers cut by 25 basis points in June. EU-wide HICP inflation for the year ending July is expected to have eased to 2.3% from 2.5% YoY.
On the US side, the Fed will also deliver its latest rate call, which is expected on Wednesday. The US central bank is widely expected to keep rates on hold in July, but investors will be watching for any major changes in policy makers’ rhetoric. Next Friday will also see the US Non-Farm Payrolls, a key data point for pricing in the possibility of a September rate hike.
🕯Technical Analysis:
EURUSD remains in an uptrend, with a clear formation of wave 5 of the Elliot Wave pattern with technical support at 1.085-1.083. In the event of a completed wave 5, the pair could top around 1.100.
EURUSD is hesitating around the EMA 34 and EMA 89, although showing an uptrend, the narrowing of the EMAs also increases the possibility of a trend reversal. RSI is trading below 50 but still above the 14-day moving average. This shows that investors are hesitant to choose sides at the moment. The upside is still in favor of investors who prefer wave trading.
The support level of 1.084 is the key zone that determines the trend of the currency pair. If the structure is broken to move to the lower support zone, 1.077 will be the immediate area to play a role. On the other side, the first price reaction can be considered at the top resistance of 1.095, the highest level can be 1.100, the end of the wave pattern can be at Fibonacci 1.272
Resistance: 1.095-1.100
Support: 1.283-1.276
📈Trading signals📉
SELL GBPUSD zone 1.100-1.102 Stoploss 1.104
BUY GBPUSD zone 1.076-1.274 Stoploss 1.272
Gold hesitates around the round port level of 2400☘️Fundamental Analysis
Gold prices attracted some buying on Tuesday, although they remained confined within the previous day’s wider trading range and below the $2,400 mark. A weaker tone in equity markets, coupled with geopolitical risks stemming from conflicts in the Middle East, turned out to be key factors supporting the safe-haven commodity. Moreover, growing acceptance that the Federal Reserve (Fed) will begin its rate-cutting cycle in September should continue to benefit gold bulls.
The focus will remain on the outcome of the two-day Federal Open Market Committee (FOMC) meeting on Wednesday. This, along with key US macro data, including Friday’s Non-Farm Payrolls (NFP) report, will influence the USD and XAU/USD price dynamics. This makes the case for buying gold after the pullback from the all-time high more deliberate
☘️Technical Analysis
From a technical perspective, the failure to accept the level above 2,400 and the subsequent decline requires caution before positioning for any meaningful upside. Gold is trading in a descending channel and the immediate resistance is around 2,392. If this zone is broken, the round-robin resistance around 2,400 will act as a brake on any rapid upside. Some further buying could push gold towards 2,409 and 2,431, helping gold regain its bullish position. On the other hand, some selling could push gold towards the lower boundary of the descending channel. The support level at 2,367 acts as the first hurdle before gold retraces to the monthly low around 2,350.
RSI on the lower time frames is showing that buying is still strong. Combined with the two tight EMA 34 and EMA 89 lines, it can be seen that the upward trajectory will be more favored by investors at the present time.
Resistance: 2400 - 2407 - 2412 - 2418
Support: 2376 - 2367 - 2361 - 2353
SELL zone 2410 - 2412 Stoploss 2415
SELL zone 2430-2432 Stoploss 2435
BUY zone 2354 - 2352 Stoploss 2348
BUY zone 2367-2365 Stoploss 2362
SWING IDEA - CDSLConsider a promising swing trade opportunity in Central Depository Services Limited (CDSL) , a leading securities depository in India, facilitating the holding and transfer of securities in electronic form.
Reasons are listed below :
Breakout from Strong Resistance at 2000 : CDSL has successfully broken above a significant resistance zone at 2000, with a strong close, indicating potential bullish momentum.
Bullish Marubozu Candle on Daily Timeframe : The presence of a bullish Marubozu candlestick pattern on the daily timeframe suggests strong buying momentum and potential upward movement.
Breakout from 5+ Months of Consolidation : The stock has broken out from a consolidation phase lasting over 5 months, indicating a significant shift in market sentiment and potential for sustained upward movement.
Spike in Volumes : A notable spike in trading volumes reflects growing market interest and potential accumulation by investors, adding confirmation to the bullish thesis for CDSL.
Trading Above 50 and 200 EMA : CDSL is trading above both the 50 and 200 Exponential Moving Averages (EMA), confirming bullish bias and indicating potential for trend continuation.
Higher Highs : The stock consistently forms higher highs, reflecting increasing bullish momentum and reinforcing the potential for further gains.
Target - 2200 // 2400
StopLoss - Daily close below 1820
DISCLAIMER -
Decisions to buy, sell, hold or trade in securities, commodities and other investments involve risk and are best made based on the advice of qualified financial professionals. Any trading in securities or other investments involves a risk of substantial losses. The practice of "Day Trading" involves particularly high risks and can cause you to lose substantial sums of money. Before undertaking any trading program, you should consult a qualified financial professional. Please consider carefully whether such trading is suitable for you in light of your financial condition and ability to bear financial risks. Under no circumstances shall we be liable for any loss or damage you or anyone else incurs as a result of any trading or investment activity that you or anyone else engages in based on any information or material you receive through TradingView or our services.
@visionary.growth.insights
SWING IDEA - SUZLON ENERGYA potential swing trade opportunity in Suzlon Energy - a leading renewable energy solutions provider in India.
Reasons are listed below :
Strong Support at 34-36 : Suzlon Energy has found a robust support level in the 34-36 range, indicating resilience and potential buying interest at these levels.
Bullish Engulfing Candle : A bullish engulfing candlestick pattern, confirming the hammer formed in the previous week, suggests potential upward momentum.
0.382 Fibonacci Support : Finding support at the 0.382 Fibonacci level reinforces the bullish outlook, providing a solid foundation for potential upward movement.
Trading Above 50 and 200 EMA : Suzlon Energy is trading above both the 50 and 200 Exponential Moving Averages (EMA), indicating positive momentum and potential bullish trend continuation.
Constant Higher Highs : The stock has been forming constant higher highs, reflecting a trend of increasing bullish momentum and reinforcing the potential for further gains.
Target - 49 // 60
Stoploss - weekly close below 35
DISCLAIMER -
Decisions to buy, sell, hold or trade in securities, commodities and other investments involve risk and are best made based on the advice of qualified financial professionals. Any trading in securities or other investments involves a risk of substantial losses. The practice of "Day Trading" involves particularly high risks and can cause you to lose substantial sums of money. Before undertaking any trading program, you should consult a qualified financial professional. Please consider carefully whether such trading is suitable for you in light of your financial condition and ability to bear financial risks. Under no circumstances shall we be liable for any loss or damage you or anyone else incurs as a result of any trading or investment activity that you or anyone else engages in based on any information or material you receive through TradingView or our services.
@visionary.growth.insights
SWING IDEA - ATUL LTDAtul Ltd , a prominent Indian chemical manufacturing company, is exhibiting technical patterns that suggest a potential swing trading opportunity.
Reasons are listed below :
Strong Support Zone : The 5750-6000 range has proven to be a robust support zone, with prices bouncing off this level, indicating buying interest and a potential reversal.
Double Bottom Pattern on Weekly Timeframe : This pattern, characterized by two distinct troughs at similar levels, is a bullish reversal signal. It suggests that the downtrend may be over, and a new upward trend could be starting.
Reversal from Golden Fibonacci Zone : The price reversed from the 0.618 Fibonacci retracement level, often referred to as the "golden zone." This adds weight to the potential for an upward move.
Bullish Engulfing Candle on Weekly Timeframe : The recent weekly candle engulfed the previous 8 weekly candles, indicating a significant shift toward bullish sentiment and suggesting a potential strong rebound.
Increase in Volumes : A noticeable spike in trading volume often confirms the strength of a price move, indicating greater participation and confidence in the direction of the trend.
Target - 7200 // 7550
Stoploss - weekly close below 5600
DISCLAIMER -
Decisions to buy, sell, hold or trade in securities, commodities and other investments involve risk and are best made based on the advice of qualified financial professionals. Any trading in securities or other investments involves a risk of substantial losses. The practice of "Day Trading" involves particularly high risks and can cause you to lose substantial sums of money. Before undertaking any trading program, you should consult a qualified financial professional. Please consider carefully whether such trading is suitable for you in light of your financial condition and ability to bear financial risks. Under no circumstances shall we be liable for any loss or damage you or anyone else incurs as a result of any trading or investment activity that you or anyone else engages in based on any information or material you receive through TradingView or our services.
@visionary.growth.insights
SWING IDEA - AFFLE (INDIA) LTDAffle India , a global technology company specializing in mobile advertising, is showing technical patterns that suggest a potential swing trading opportunity.
Reasons are listed below :
Ascending Triangle Pattern : The stock is forming an ascending triangle pattern, a bullish continuation pattern that indicates increasing demand and the potential for an upward breakout.
Repeated Resistance Testing (1250-1300) : The 1250-1300 resistance zone has been tested multiple times. The stock is now poised to potentially break through this level, indicating strong bullish momentum.
Bullish Marubozu Candle : The recent formation of a bullish marubozu candle suggests strong buying pressure and the potential for further upward movement.
Trading Above 50 and 200 EMA : Affle India is trading above both the 50-day and 200-day exponential moving averages, indicating a strong uptrend and providing robust support levels.
Consistently Making Higher Highs : The stock is consistently making higher highs, indicating a sustained uptrend and ongoing bullish sentiment.
Target - 1500 // 1880
Stoploss - weekly close below 1050
DISCLAIMER -
Decisions to buy, sell, hold or trade in securities, commodities and other investments involve risk and are best made based on the advice of qualified financial professionals. Any trading in securities or other investments involves a risk of substantial losses. The practice of "Day Trading" involves particularly high risks and can cause you to lose substantial sums of money. Before undertaking any trading program, you should consult a qualified financial professional. Please consider carefully whether such trading is suitable for you in light of your financial condition and ability to bear financial risks. Under no circumstances shall we be liable for any loss or damage you or anyone else incurs as a result of any trading or investment activity that you or anyone else engages in based on any information or material you receive through TradingView or our services.
@visionary.growth.insights
SWING IDEA - ASHOK LEYLANDAshok Leyland, one of India's leading commercial vehicle manufacturers, presents a compelling opportunity for swing traders.
Reasons are listed below :
Cup and Handle Pattern : The stock has formed a cup and handle pattern, indicating a potential bullish continuation. This pattern suggests a brief consolidation followed by a breakout, typically leading to an upward trend.
Breakthrough of Resistance Zone : The 160-level was a strong resistance point, but the price broke through it, retested, and is now forming new higher highs, indicating a continuation of the upward trend.
Bullish Marubozu Candle on Weekly Timeframe : This candle, characterized by a lack of upper and lower shadows, suggests strong bullish momentum and consistent buying pressure.
Breaking a Long Consolidation Phase : Ashok Leyland has broken out of a consolidation phase that lasted for 6 years, signaling a significant change in market sentiment and a potential start of a new bullish phase.
Weekly Engulfing Candle : The weekly engulfing candle has enveloped the price action of the past 40 weeks, indicating a substantial shift in momentum and suggesting further upward movement.
0.5 Fibonacci Support : The 0.5 Fibonacci retracement level provides strong support, indicating that the price might continue to rally after retracements or dips.
50 EMA Support on Weekly Timeframe : The price is above the 50 exponential moving average, providing additional support and confirming the upward trend.
Trading at All-Time High : Ashok Leyland is currently trading at an all-time high, indicating strong bullish sentiment. However, traders should be mindful of potential pullbacks or overbought conditions at such levels.
Target - 215 // 250 // 300
StopLoss - weekly close below 160
Disclaimer :
Decisions to buy, sell, hold or trade in securities, commodities and other investments involve risk and are best made based on the advice of qualified financial professionals. Any trading in securities or other investments involves a risk of substantial losses. The practice of "Day Trading" involves particularly high risks and can cause you to lose substantial sums of money. Before undertaking any trading program, you should consult a qualified financial professional. Please consider carefully whether such trading is suitable for you in light of your financial condition and ability to bear financial risks. Under no circumstances shall we be liable for any loss or damage you or anyone else incurs as a result of any trading or investment activity that you or anyone else engages in based on any information or material you receive through TradingView or our services.
@visionary.growth.insights
GBPCHF downward consideration!Based on the chart, price is in a clear strong down trend and currently it comes below a support area which it is possible to act as resistance.
The short position is my current pending order on the chart.
I will share my tradings and if you are interested, you can like and follow me to get access to my new signals and updates on chart.