21.03.25 Morning ForecastPairs on Watch -
FX:NZDJPY
FX:AUDJPY
FX:EURUSD
FX:GBPUSD
A short overview of the instruments I am looking at for today, multi-timeframe analysis down to what I will be looking at for an entry. Enjoy!
Priceactionanalysis

#NIFTY Intraday Support and Resistance Levels - 21/03/2025Flat opening expected in nifty. Expected opening near 23200 level. This level will act as an immediate resistance for nifty. Any downside reversal expected from this level. Downside 23000 level will act as a strong support for today's session. Any downside movement can revers from this support level. Strong upside rally expected if nifty starts trading above 23250 level. This rally can be 200-250+ points in today's session.

[INTRADAY] #BANKNIFTY PE & CE Levels(21/03/2025)Today will be flat opening expected in banknifty. After opening if it's sustain above 50050 level then expected upside rally upto 50450+ level in opening session. Any major downside only expected below 49950 level. Downside 49550 level will act as a strong support for today's session.

20.03.25 Morning ForecastPairs on Watch -
FX:EURUSD
FX:GBPUSD
FX:AUDJPY
FX:NZDJPY
A short overview of the instruments I am looking at for today, multi-timeframe analysis down to what I will be looking at for an entry. Enjoy!

#NIFTY Intraday Support and Resistance Levels - 20/03/2025Gap up opening expected in nifty above 23000 level. After opening if nifty sustain above this level then expected strong upside rally upto 23250+ level in today's session. Any downside movement only expected below 22950 level. Downside 22750 level will act as a strong support for today's session. Any major downside only expected below this support level.

[INTRADAY] #BANKNIFTY PE & CE Levels(20/03/2025)Today will be gap up opening expected in banknifty. After opening if banknifty starts trading above 50050 level then expected strong further upside rally upto 50450+ level. Any downside movement only expected if banknifty starts trading below 49450 level in today's session.

USDJPY Price ActionHello Traders,
Due to USD weakness, this pair presents a potential short opportunity. We have a valid supply zone, strengthened by liquidity presence.
🔹 Trade Plan:
1️⃣ Wait for a liquidity sweep before entering.
2️⃣ Let the price tap into the supply zone.
3️⃣ Switch to a lower timeframe (5M or 15M) for precise entry confirmation.
4️⃣ Look for a Mitigation Block or Fair Value Gap (FVG) as an entry trigger.
⚠️ Risk Management is Key:
Always manage risk, avoid greed, and never trade blindly.
Stick to your plan, and let the market come to you.
Wishing you all the best & happy trading! 🚀📊 Thank you!

19.03.25 Morning ForecastPairs on Watch -
FX:AUDJPY
OANDA:UK100GBP
FX:AUDCHF
FX:USDJPY
A short overview of the instruments I am looking at for today, multi-timeframe analysis down to what I will be looking at for an entry. Enjoy!

Gold Price Analysis March 18⭐️Fundamental Analysis
The ceasefire between Israel and Hamas collapsed as Israel attacked targets across Gaza, killing at least 100 people. Tensions escalated further with unconfirmed reports that the US sank an Iranian intelligence-gathering vessel.
These developments have pushed investors to seek gold as a safe-haven asset, especially amid geopolitical risks and global economic uncertainty due to the US-China trade war.
In addition, US retail sales data for February raised concerns about an economic recession, supporting gold prices but putting pressure on the USD. However, the greenback recovered on Tuesday ahead of the Fed's policy meeting on Wednesday.
⭐️Technical Analysis
Gold is near its all-time high and there is no reasonable technical analysis method to trade it. We still favor retracements and buy up with the trend. 3020 and 3040 are two psychological zones the market is waiting for. nice retracements for BUY signals are waiting around 2980 - 2960 - 2945

#NIFTY Intraday Support and Resistance Levels - 19/03/2025Gap up opening expected in nifty. After opening expected resistance near 22950 level. Possible reversal from this level. Downside 22750 level will act as a support for nifty. Strong upside rally expected if nifty starts trading above 23000 level. This upside rally can goes upto 23250+ level in today's session.

[INTRADAY] #BANKNIFTY PE & CE Levels(19/03/2025)Today will be gap up opening in index. Expected opening above 49500 level. After opening if it's sustain above this level then this upside rally can goes upto 49950+ level in opening session and it can be extend for further 400-500+ points in case banknifty starts trading above 50050 level. Any downside possible below 49450 level. Downside 49050 level will act as strong support level for today's session.

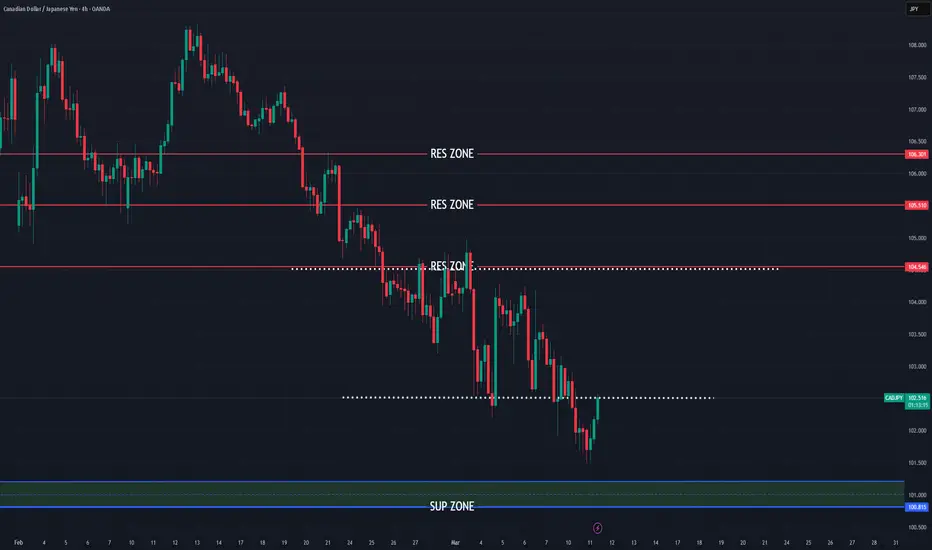
CADJPY having strong bullish signs
OANDA:CADJPY PA based trade, currently price on bottom line, JPY showing signs of losing power, with some other currencies it's already confirmed bearishness. We are have and event GDP from JPY today, which looks like its have impact here.
Here now expecting strong bullish push till top trend line (RES zone) and having look we will see and break of top trend line and higher bullishness is exepcted here
SUP zone: 101.200
RES zone: 104.550, 105.500, 106.300
USDJPY Price ActionHello Traders,
I've marked a Liquidity Area and another Supply Zone on the chart. Here's what might happen next: after sweeping the liquidity, the price could touch the Supply Zone and then drop. Before acting on this, make sure you switch to either the 5-minute or 15-minute timeframe and clearly mark a Demand Zone there.
Wait patiently for the breakout. When the price breaks through that Demand Zone on the lower timeframe, set a pending order. Place your stop-loss at the recent swing high, and set your take profit at the next targeted Liquidity Level.
Many traders often wait for Fair Value Gaps (FVG), but this causes them to miss opportunities. Especially if you're struggling to pass trading challenges, give this method a try. Managing your risk carefully is the key to success.
Good luck and happy trading!
Thank you!

18.03.25 Morning ForecastPairs on Watch -
FX:EURNZD
FX:GBPNZD
FX:GBPUSD
A short overview of the instruments I am looking at for today, multi-timeframe analysis down to what I will be looking at for an entry. Enjoy!

#NIFTY Intraday Support and Resistance Levels - 18/03/2025Gap up opening expected in nifty. Expected opening near 22700 level. After opening if nifty starts trading above 22750 level then possible strong upside rally upto 22950+ in today's session. Any downside or reversal expected near a 22700 level. Downside 22550 level will act as a strong support for today's session. Major downside only expected below 22500 level.

[INTRADAY] #BANKNIFTY PE & CE Levels(18/03/2025)Today will be gap up opening expected in index. After opening if banknifty sustain above 48550 level then possible strong upside rally upto 48950+ level and this rally can be extend for further 400-500+ points in case banknifty starts trading above 49050 level. 48950 level will act as a resistance level for upside rally. Expected reversal from this level. Any major downside only expected below 48450 level.

Gold Price Analysis March 17⭐️Fundamental Analysis
Persistent concerns over escalating trade tensions and their impact on the global economy, coupled with geopolitical risks, continued to act as a bullish driver for safe-haven bullion. In addition, bets that the Federal Reserve (Fed) will cut interest rates multiple times this year further bolstered the non-yielding yellow metal.
The prospect of further policy easing by the US central bank sent the US dollar (USD) tumbling near multi-month lows touched last week, further supporting gold prices. However, a positive shift in global risk sentiment, bolstered by optimism over China’s stimulus measures announced over the weekend, capped XAU/USD’s gains. Traders also appeared reluctant, opting to wait for the outcome of the FOMC’s two-day policy meeting on Wednesday.
⭐️Technical analysis
Gold is in a difficult trading phase when the price range is unclear for buying and selling zones, pay attention to the 2980 zone today for BUY strategies. If it breaks this zone, the strategy will only SELL to 2955. In case gold breaks 2994, there will be a new AT H in the last trading sessions in Europe and America today.

GBPCAD Price ActionHello Traders,
As you can see, I've marked the Demand Zone, based on the 2-hour timeframe. Additionally, I've highlighted Liquidity Levels, clearly distinguishing between those already swept and the valid ones remaining.
On the 15M timeframe, you'll notice I've marked the Breakout Block, also identified as the Supply Zone. If the price breaks this Supply Zone, you should set a pending order. There are two effective ways to enter this market: either through an FVG (Fair Value Gap) or a Breaker Block entry.
Your trade can be held for up to one day, with the stop-loss positioned at the recent swing low. Remember, it's crucial to manage your risk responsibly and avoid greed. This structure repeats itself consistently.
Wishing you the best and happy trading!
Thank you.

XAG/USD +4% Missed Trade In this short recap I cover a missed trade on OANDA:XAGUSD (Silver).
I was looking for the insurance entry structure as explained, this failed and I missed the 4H limit order play by minutes. A lovely position nonetheless and a great lesson learned for myself moving forward.
I hope you enjoyed, any questions drop them below!

Gold (XAU/USD) - Potential Liquidity Sweep Before ReversalGold has been in a strong uptrend, forming a rounded bottom pattern, which led to a breakout above key resistance. Currently, price is consolidating near the all-time high (ATH) around $3,005, suggesting a potential liquidity sweep before a larger move.
📌 Key Observations:
Rounded Bottom Formation: A bullish reversal pattern led to a breakout.
Consolidation Zone: Price is ranging just below the ATH, likely gathering liquidity.
Liquidity Sweep & Weak Highs: The chart suggests a push above the ATH to trigger stops before a potential reversal.
Projected Bearish Move: A break lower could lead to a corrective move towards $2,920 - $2,800 in the coming sessions.
⚠️ Trading Plan:
Bullish Scenario: A clean breakout above ATH with strong volume could invalidate the bearish setup.
Bearish Scenario: If the liquidity sweep occurs and price fails to hold above ATH, a strong sell-off could follow.
Traders should watch for confirmation signals before entering any positions. Stay cautious and manage risk effectively!
📊 What are your thoughts? Will gold continue higher or reverse? Share your views below!
#XAUUSD #Gold #Trading #Forex #LiquiditySweep #ATH

17.03.25 Morning ForecastPairs on Watch -
FX:GBPAUD
OANDA:UK100GBP
FX:NZDJPY
FX:USDJPY
A short overview of the instruments I am looking at for today, multi-timeframe analysis down to what I will be looking at for an entry. Enjoy!

EUR/GBP - Bearish Rejection from Resistance
This 4-hour chart of EUR/GBP indicates a potential sell opportunity following a rejection from a key resistance level.
Key Observations:
Resistance Level: Price is struggling to break above 0.84200, suggesting strong selling pressure.
Bearish Structure: The price action shows a rejection at resistance, forming a potential lower high.
Target Support: The next major support level is around 0.83448, followed by 0.82562 for further downside.
Trading Plan:
📉 Sell Entry: After price confirmation below 0.84000
🎯 Take Profit: First target at 0.83448, second target at 0.82562
🔴 Stop-Loss: Above 0.84300 to minimize risk
Technical Indicators to Watch:
✅ Bearish Candlestick Patterns confirming resistance rejection
✅ RSI Divergence or overbought conditions
✅ Break & Retest Confirmation before entering a short trade

#NIFTY Intraday Support and Resistance Levels - 17/03/2025Expected gap up opening in nifty near 22500 level. After opening this is an important level for nifty. If nifty starts trading and sustain above 22550 level then expected upside rally upto 22700+ level. Downside reversal expected if nifty not sustain above level and starts trading below 22500. Downside 22350 level will act as a strong support for today's session.
