ETHUSDT Long by TeamPWRTradesTeamPWRTrades ETH Long Idea
Although the general Crypto market has been showing weakness, we are expecting Bullish movement for ETH in the next coming days. Based on Daily candles there is still a possibility of ETH heading towards it's daily support zone at 1800. Our team recommends using low leverage 1-2% of capital for this trade due to the daily volume signaling a possibility of ETH reclaiming 2500-2800 zone.
Enter
1: 2160
2: 2210
TP1: 2500
TP2: 2800
SL: 2088
Trade Active
Happy Trading,
TeamPWR
Priceactionanalysis

Move toward the level of 73,000 unitsAccording to the January 21 analysis, after identifying the trading range and determining its highs and lows, we expected Bitcoin to complete this pattern at 92,303.
However, after reaching this level on the daily timeframe, the price made a strong spike, breaking the large trading range between 92,303 and 106,436, entering a new phase and movement.
After its adventure at 86,903, this asset continued its downward movement, breaking through this range as well. Currently, it has reached a new price level at 80,000, driven by the strong spike movement.
Now, we must wait to see whether this direct movement will continue or if it will proceed with some delay and consolidation.
It is important to note that if this level is lost, Bitcoin’s price on the daily timeframe could potentially extend its move down to 73,000, which is also the expected level. The reason is that such a strong spike movement requires a powerful support level for correction or a temporary halt in this dominant wave.

28.02.25 Morning ForecastPairs on Watch -
FX:AUDNZD
FX:GBPUSD
FX:EURUSD
A short overview of the instruments I am looking at for today, multi-timeframe analysis down to what I will be looking at for an entry. Enjoy!

[INTRADAY] #BANKNIFTY PE & CE Levels(28/02/2025)Today will be gap down opening expected in banknifty near 48550 level. After opening this is the important support for today's session. Major downside only expected if banknifty starts trading below 48450 level. Currently banknifty consolidated in between range of 48550 to 48950 level. Any bullish side rally only expected after the breakout of 49050 level.

EUR/NZD Analysis: Bullish Continuation After Retracement?🔹EUR/NZD 1H Technical Analysis
▪️Market Structure & Trend:
The market is in a bullish structure, forming higher highs and higher lows. The recent price action suggests a potential pullback before continuing the uptrend.
▪️Key Levels
- Support (Point of Interest - POI): 1.83660
- Resistance (Target Area): 1.84930
- Current Price: 1.84052
▪️Price Action & Expected Movement:
- The price has reached a short-term resistance zone and is showing signs of consolidation.
- A retracement to the POI (1.83660) is likely before further upside movement.
- If buyers step in at this demand zone, a bullish continuation toward the 1.84930 target is expected.
▪️Trade Considerations
- Bullish Scenario: Look for confirmation of support at the 1.83660 zone before entering a long position.
- Bearish Scenario: A break below the POI could indicate further downside, invalidating the bullish bias.
▪️Conclusion:
The market remains bullish, but a short-term pullback to the 1.83660 support zone could offer an optimal buy opportunity for a move toward 1.84930. Traders should watch for bullish confirmation signals at the POI before entering a trade.
😊Don't Forget To Hit The Like Button & Share Your Thoughts In Comments.

Gold Price ActionHello Traders,
I have marked a key zone on the 4-hour chart, highlighting liquidity areas that need to be grabbed. Based on this setup, there is a strong possibility that the price will rise.
Looking at today's economic forecast, the USD appears slightly weaker due to higher-than-expected unemployment claims. Additionally, I have identified divergence, which further supports a potential bullish move.
You can consider entering a long position, but always ensure proper risk management. Stay disciplined, avoid over-leveraging, and don’t let greed take over.
Wishing you all the best and happy trading!
Thank you.

27.02.25 Morning ForecastPairs on Watch -
FX:AUDNZD
FX:NZDUSD
OANDA:AU200AUD
FX:EURUSD
A short overview of the instruments I am looking at for today, multi-timeframe analysis down to what I will be looking at for an entry. Enjoy!

#NIFTY Intraday Support and Resistance Levels - 27/02/2025Flat opening expected in nifty. After opening important level to watch is 22500. If nifty starts trading below this level then sharp downside rally expected upto 22300 in opening session. Any upside move only expected if it's sustain above 22550 level. Upside 22750 level will act as a resistance for today's session.

[INTRADAY] #BANKNIFTY PE & CE Levels(27/02/2025)Today will be flat opening in index near 48550 level. After opening this is the important support for banknifty. Any major downside only expected below this support level. If banknifty starts trading below 48450 then possible sharp downside upto 48050 level. Upside 48950 level will act as a resistance. Any upside rally can reversal from this level.

AUD/USD – High Probability Long Setup1️⃣ Trade Execution – Why I Took the Long Position
Today's AUD/USD trade was a perfect setup combining Fibonacci retracements, institutional order flow, and seasonality trends from Prime Market Terminal. The confluences aligned well for a high-probability long entry.
💡 Entry Details:
✅ Entry: 0.6380 (Key demand zone + Fibonacci golden zone)
✅ Stop Loss: 0.6365 (Below market structure)
✅ Take Profit: 0.6429 - 0.6450 (Previous supply zone & liquidity target)
✅ Risk-Reward Ratio: 3:1
🎯 Result: Currently in profit, monitoring for further upside! ✅
2️⃣ Why This Trade Worked – A Breakdown of the Confluences
📊 Fibonacci Retracement – Textbook Pullback & Bounce
Price retraced into the 61.8%-78.6% Fibonacci zone (0.6380 - 0.6365) and bounced perfectly.
The bullish move followed an impulse leg, suggesting smart money accumulation in this zone.
📈 Smart Money & Order Flow – Trading with Institutions
🔹 Order flow from Prime Market Terminal shows major liquidity pools accumulating long positions.
🔹 DMX Data: 43% long vs. 57% short, indicating potential for a reversal as shorts get trapped.
🔹 COT Data: Institutional traders increasing their net long exposure on AUD.
🕵️♂️ Seasonality & Historical Trends Supported the Long
📊 Seasonal Prime data indicates AUD/USD historically trends higher in late February & March.
📅 Next 3-5 day forecast shows bullish probability, reinforcing the long bias.
📉 Technical Confirmation – Structure & Momentum
✅ SuperTrend flipped bullish on the 4H chart
✅ Price is trading above key moving averages (EMA 6, 24, 72, 288)
✅ Broke above short-term resistance, confirming upward momentum
3️⃣ Key Takeaways from This Trade
🔹 Trading with smart money flow and against retail sentiment increases trade probability.
🔹 Seasonality trends aligned perfectly, adding confidence in the setup.
🔹 Fibonacci, EMAs, and Prime Market Terminal data provided a precise entry.
🔹 Patience and risk management ensured a well-executed trade.
📌 Final Thoughts – What’s Next for AUD/USD?
🚀 With this bullish breakout, I’m looking for further longs on dips, targeting the 0.6450 - 0.6480 zone.
👀 What’s your outlook on AUD/USD? Are you long or short? Let’s discuss in the comments!
🔗 Follow me for more institutional trade setups & contrarian trading ideas!

Gold price analysis February 26⭐️Fundamental analysis
Gold prices rose sharply in the middle of the week thanks to weak US economic data, causing the USD and bond yields to weaken. Concerns about tariffs with Canada, Mexico and the risk of a trade war helped gold maintain its upward momentum.
However, gold prices may face difficulties as the USD recovered slightly after the US House of Representatives passed a budget plan, supporting Trump's tax policy. The US-China meeting on tariffs also restrained the increase, but risk aversion still boosted the demand for safe-haven gold. Investors also followed the speech of Fed officials for more signals about the market.
⭐️Technical analysis
Gold prices unexpectedly increased in the Asian session with the force pushing back to the breakout zone of 2930. The price range of gold has been noted on the chart with the small range of 2892-2942 and the large range of 2868-2978. Gold closing below 2912 will signal a Downtrend and head towards the lower band. On the other hand, Gold's upward path faces more resistance around 2921 and 2930.

GBP/USD - Weekly Liquidity & Fair Value Gaps AnalysisOverview
The British Pound (GBP/USD) is currently trading around 1.2652, showing a bullish recovery after sweeping weekly sell-side liquidity. Price has reacted from a weekly fair value gap (W.FVG) / BISI and is approaching key resistance levels.
Key Levels & Liquidity Zones
📌 Weekly Sellside Liquidity: Taken, leading to a bullish reversal.
📌 Weekly Buy-side Sweep: Possible target around 1.2774 (50% retracement).
📌 W.FVG // BISI (Bullish Imbalance Sellside Inefficiency): Acting as support.
📌 W.FVG / SIBI (Sell-side Imbalance Buy-side Inefficiency): A potential rejection zone around 1.2774.
Technical Outlook
🔹 Bullish Reversal: The price has bounced from key liquidity zones, suggesting further upside.
🔹 Fair Value Gaps (FVGs): The market has filled some inefficiencies but still has upside targets.
🔹 Potential Scenarios:
A continuation towards 1.2774 (weekly resistance & FVG fill).
A possible rejection at that level before resuming the trend.
Trade Plan
✅ Bullish Bias: Looking for pullbacks into support (W.FVG) for long opportunities.
❌ Bearish Confirmation: Rejection from 1.2774 could signal a retracement.
📊 Risk Management: Stop-loss placement below recent structure lows.
🔥 Watch these liquidity sweeps and fair value gaps for potential trading opportunities!
📌 Like & Follow for more trade ideas! 🚀

26.02.25 Morning ForecastPairs on Watch -
FX:AUDNZD
FX:EURNZD
A short overview of the instruments I am looking at for today, multi-timeframe analysis down to what I will be looking at for an entry. Enjoy!

Gold Analysis May 25⭐️Fundamental Analysis
Market sentiment remained cautious on Tuesday due to concerns over Trump tariffs and Nvidia's upcoming earnings report. The US dollar continued to hold its strength on risk-off sentiment, limiting gold's gains. However, gold prices remained supported by falling US Treasury yields and rising trade war risks.
Bond yields fell on a strong auction and weak PMI data, raising expectations that the Fed will cut interest rates twice this year. Meanwhile, trade tensions escalated as the Trump administration considered tightening controls on chip exports to China.
⭐️Technical Analysis
Gold prices are still operating in a wedge of 2928 and 2952. The 2958 zone is also quite easy to create a false ATH. 2968-2970 acts as the most important resistance for Gold at the moment, which is considered the weekly resistance level. Watch out for gold falling, there could be a deep drop to 2906-2900.

$104K and Counting: Can Bitcoin Sustain Its Momentum?COINBASE:BTCUSD - Daily
Current Price: 97,520
Executive Summary:
Is Bitcoin Set for a Correction After Hitting $104,000?
Bitcoin has hit significant milestones, with two of our predicted targets—$90,000 and $100,000—successfully achieved, delivering a remarkable gain of 46.44% and 3,307,221 pips. After climbing to $104,000, Bitcoin entered extreme overbought territory across daily, weekly, and monthly charts, signaling exhaustion. With the formation of an ascending channel and overbought signals, a potential correction could be on the horizon. Here’s what to expect next.
Analysis:
In our earlier analysis, we predicted key price targets of $90K, $100K, and $110K. Bitcoin successfully hit $90K and $100K, eventually climbing to $104K—a remarkable gain of 46.44% and 3,307,221 pips. However, this rally propelled Bitcoin into extreme overbought territory across multiple timeframes, signaling a potential need for correction.
On November 6, Bitcoin broke out of a falling wedge/handle pattern, driving the price to $104K. Since November 12, it has been ascending within a channel—a formation that often precedes a downward correction. Coupled with extreme overbought conditions on daily, weekly, and monthly charts, Bitcoin now shows clear signs of buyer exhaustion.
Potential Correction Level:
Fibonacci Retracement (50%): $85,327.80
Key Levels to Watch:
• Extreme Overbought: $112,500
• Overbought Resistance: $106,250
• Ultimate Resistance: $100,000
• Major Support: $75,000
Thank you for taking the time to read this analysis. Wishing you great success in your trading journey! Always prioritise proper risk management to achieve sustainable growth in the markets. Good luck with your trades!

25.02.25 Morning ForecastPairs on Watch -
FX:EURCAD
FX:EURNZD
A short overview of the instruments I am looking at for today, multi-timeframe analysis down to what I will be looking at for an entry. Enjoy!

#NIFTY Intraday Support and Resistance Levels - 25/02/2025Slightly gap down opening expected in nifty. After opening if nifty starts trading below 22500 level then possible sharp downside of 150-200 points occurs in nifty. This downside rally can goes upto the 22300 level. Upside 22750 will act as a major resistance for today's session. Any upside rally can be reversal from this level.

[INTRADAY] #BANKNIFTY PE & CE Levels(25/02/2025)Today will be slightly gap down opening expected in banknifty near 48550 level. After opening if banknifty starts trading below 48450 level then possible strong downside rally in index towards the 48050 level. Any bullish side rally only expected if it's sustain above 48550 level. Upside 48950 level will act as a strong resistance. Any bullish side rally can be reversal from this level.

Gold price analysis February 24⭐️Fundamental Analysis
The uncertainty surrounding former US President Donald Trump's tariff policy and global economic risks continue to strengthen gold's role as a safe-haven asset. In addition, geopolitical tensions and pessimistic sentiment towards the US Dollar (USD) also contributed to supporting gold prices.
However, expectations that the US Federal Reserve (Fed) will maintain high interest rates to control inflation have limited the upside of this precious metal. Investors are now focused on the US Personal Consumption Expenditures Price Index (PCE) report on Friday, important data that could influence the Fed's interest rate policy, impact the USD and the next trend of gold prices.
⭐️Technical Analysis
Gold is currently relatively difficult to trade and pay attention to the Gold range around 2953 and 2906. A relatively wide range. The further range of 2978 and 2873 will be noticed this week. In the end of the H4 candlestick session, it closed above 2941. Gold will soon have a price of 2953. On the contrary, when gold closes below 2933, we can wait for a retest around 2938-2940 to SELL. TP Gold is still around 2923. If we break this area, pay attention to 2906. Wish you a successful trading day.

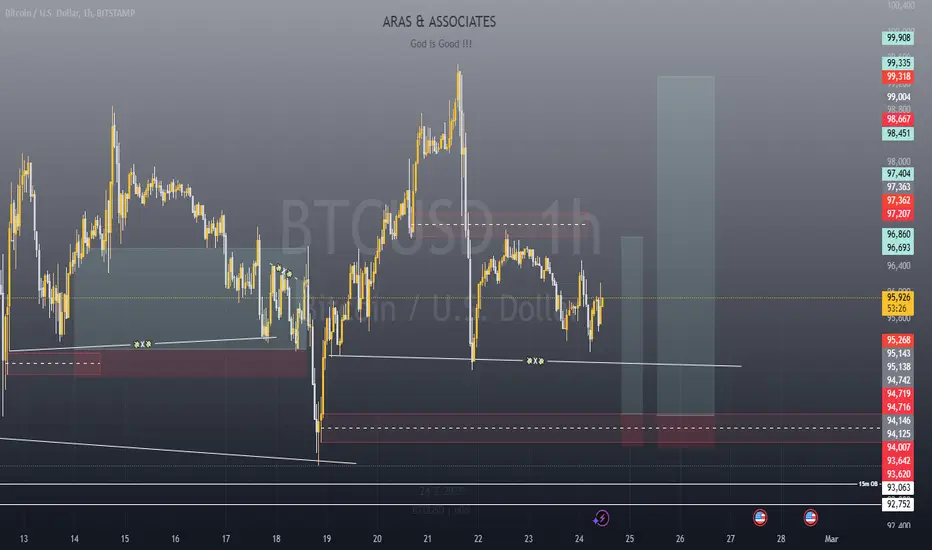
Rinse & Repeat !!!Hello everyone, a happy new trading week to you all !.
This setup is particularly a short-term buy for those looking to take advantage of BTC's range that has been refusing to take a side.
A good RRR trade that's sure to make you a bit of money. Use proper risk and money management (risk what you're willing to not get bothered by) and most especially, do your own analysis for extra confluence !.
24.02.25 Morning ForecastPairs on Watch -
FX:EURCAD
A short overview of the instruments I am looking at for today, multi-timeframe analysis down to what I will be looking at for an entry. Enjoy!

#NIFTY Intraday Support and Resistance Levels - 24/02/2025Flat or slightly gap down opening expected in nifty. After opening important level is 22750. In case nifty starts trading below this support level then possible strong downside rally in index upto 22550 in today's session. Any upside rally only expected if nifty sustain above 22800 support level. Upside 23000 level will act as a strong resistance for any bullish side rally.

[INTRADAY] #BANKNIFTY PE & CE Levels(24/02/2025)Today will be flat opening expected in banknifty. After opening if banknifty starts trading below 48950 level then expected sharp downside rally in index upto 48550 level. This downside rally can be extend for further 400-500+ points downside in case banknifty gives breakdown of 48450 level. Any bullish side rally only expected if it is starts trading and sustain above the 49050 level. Upside 49450 level will act as a strong resistance for today's session.
