[INTRADAY] #BANKNIFTY PE & CE Levels(06/02/2025)Today will be gap up opening in banknifty. After opening expected upside rally upto 50950 level if banknifty starts trading above 50550 level. 50050-50450 level are the consolidation zone for banknifty. Any major downside rally only expected below the 49950 level.
Priceactionanalysis

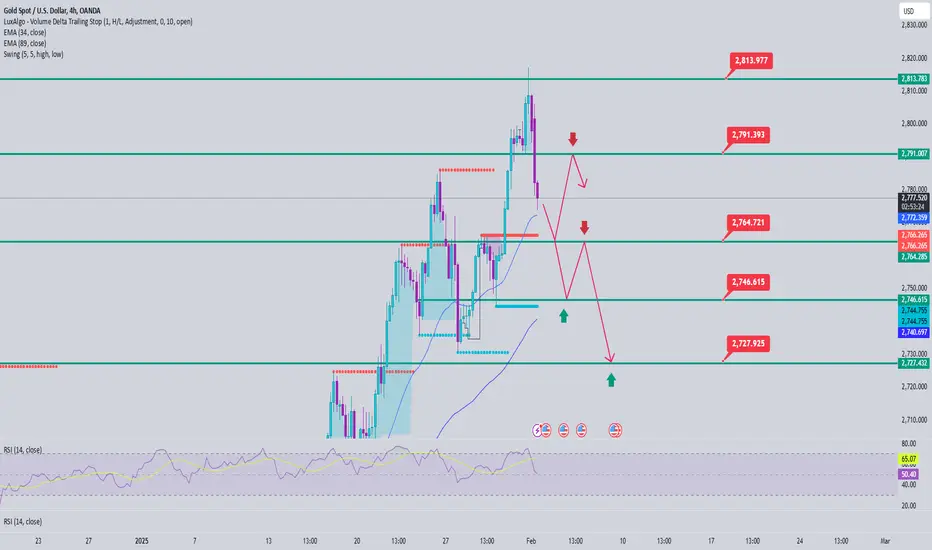
Gold Continues to rise 1H Analysis Everything explained on the chart as usual. How high can gold keep pushing?
A monumental Bull run offering many great trading opportunities! I do my best to keep trading as simple as possible. The less noise the better.. focusing on execution and consistency.

$XAU Profit Target 2 Done See on ChartBITFINEX:XAUTUST Chart Analysis of Price Prediction 2025 see more chart...
Gold price flat lines above $2,760 level as traders keenly await FOMC decision Gold Price Forecast: XAU/USD nears $2,750 as Fed’s decision looms
From a technical perspective, the recent breakout through the $2,720-2,725 horizontal barrier and positive oscillators on the daily chart suggest that the path of least resistance for the Gold price remains to the upside. A subsequent move above the $2,772-2,773 area will reaffirm the constructive outlook and lift the XAU/USD beyond the $2,786 area, or the highest level since October 2024 touched last Friday, towards the all-time peak, near the $2,790 zone. Some follow-through buying, leading to a strength beyond the $2,800 mark, will be seen as a fresh trigger for bullish traders and pave the way for an extension of a well-established uptrend witnessed over the past month or so.
XAU/USD Current price: $2,753.60
The Federal Reserve will likely keep rates on hold in today’s monetary policy meeting.
The United States will publish the preliminary estimate of the Q4 GDP on Thursday.
XAU/USD could extend its slide in the near term amid prevalent US Dollar demand.
Gold is under modest selling pressure on Wednesday as caution rules ahead of the Federal Reserve’s (Fed) monetary policy announcement. The United States (US) central bank is widely anticipated to keep the benchmark interest rate unchanged after trimming 25 basis points (bps) and settling it at 4.25%-4.5% in December.
Support levels: 2,747.20 2,734.60 2,716.50
Resistance levels: 2,764.85 2,777.30 2,789.95
Disclaimer: This article is for informational purposes only and does not constitute financial advice. Always conduct your own research before making any investment decisions.

AMD PRICE ACTION FEB 5TH 2025This is the price action of AMD at its very best & exclusively for viewers on trading view.
I have discussed in depth price action of AMD and if you have any doubts feel free to leave a message or your comments below.

05.02.25 Morning ForecastPairs on Watch -
FX:AUDUSD
FX:NZDCAD
A short overview of the instruments I am looking at for today, multi-timeframe analysis down to what I will be looking at for an entry. Enjoy!

#NIFTY Intraday Support and Resistance Levels - 05/02/2025Gap up opening expected in nifty. After opening expected nifty will continue it's bullish rally towards the 23950+ level in today's session. 23650 level will act as a strong support for today's session. Major downside only expected if nifty not sustain above level and starts trading below 23600. Below this level sharp downside expected upto the 23400 level.

[INTRADAY] #BANKNIFTY PE & CE Levels(05/02/2025)Today expected gap up opening in banknifty. After opening if banknifty starts trading above 50550 level then expected further upside rally of 400-500+ points in today's session. Downside 50050 level act as a important support for today's session. Any major downside rally only expected below the 49950 level.

$BTC Bounce Back Again $100K Price, New Long Setup see on chartBINANCE:BTCUSDT Bounce Back Again $100K Price, New Long Setup see on chart...
News: Bitcoin Leads US Equity Markets Amid Macro Developments, Yet Stays Resilient: Report
Bitcoin (BTC) is becoming increasingly sensitive to macroeconomic factors. In fact, the digital asset is leading equity markets in the United States in response to President Donald Trump’s latest economic and policy changes.
Over the last four days, President Trump’s announcements havetriggeredincreased uncertainty in global markets, leading to a decline in bitcoin’s price. Bitcoin fell below $100,000 and even touched an intraday low of $91,657 on Monday.
Since bitcoin rallied during President Trump’s inauguration, the cryptocurrency has continued to show a downward trend. BTC formed the double top structure at the $108,000 level and has been trading in a 15% range since mid-November.
Bitfinex analysts said such 15-20% ranges often resolve in either an upward or downward direction within 80-90 days. This means BTC will experience a decisive price move in the coming weeks, still under the influence of macroeconomic developments.
As the financial markets process the implications of the tariff hikes, Bitfinex believes BTCfacesfurther downside unless legacy assets recover. Even if legacy markets do not see significant recovery, analysts are confident in bitcoin’s long-term trajectory, which they have described as compelling.
“In conclusion, while Bitcoinʼs short-term volatility may continue in response to macroeconomic influences, its long-term outlook remains positive,” Bitfinex analysts added.
BINANCE:BTCUSDT LONG SETUP HERE
Entry Price: $96,651.98
Stoploss Zone: $91,206.57
Leverage: 11x use 11% of your margin balance.
This Long Setup 4 Target Price Level here
1 Take Profit: $100,443.31
2 Take Profit: $103,772.29
3 Take Profit: $107,087.34
4 Take Profit: $111,059.81
Disclaimer: This article is for informational purposes only and does not constitute financial advice. Always conduct your own research before making any investment decisions. Digital asset prices are subject to high market risk and price volatility. The value of your investment may go down or up, and you may not get back the amount invested. You are solely responsible for your investment decisions and Binance is not available for any losses you may incur. Past performance is not a reliable predictor of future performance. You should only invest in products you are familiar with and where you understand the risks. You should carefully consider your investment experience, financial situation, investment objectives and risk tolerance and consult an independent financial adviser prior to making any investment.

nifty50NSE:NIFTY
ONE SHOULD WAIT FOR FURTHER Breakout ON WEEKLY BASIS.
Note :
1. One should go long with a Stop Loss, below the Trendline or the Previous Swing Low.
2. Risk :Reward ratio should be minimum 1:2.
3. Plan your trade as per the Money Management and Risk Appetite.
Disclaimer :
>You are responsible for your profits and loss.
>The idea shared here is purely for Educational purpose.
>Follow back, for more ideas and their notifications on your email.
>Support and Like incase the idea works for you.

04.02.25 Morning ForecastPairs on Watch -
FX:NZDCAD
A short overview of the instruments I am looking at for today, multi-timeframe analysis down to what I will be looking at for an entry. Enjoy!

#NIFTY Intraday Support and Resistance Levels - 04/02/2025Gap up opening expected in nifty. After opening if nifty starts trading and sustain above 23400 level then expected upside rally upto 23600 in today's session. Expected reversal from this level in nifty. Major downside expected if nifty starts trading below 23350 level.

[INTRADAY] #BANKNIFTY PE & CE Levels(04/02/2025)Today will be slightly gap up opening expected in banknifty. Expected opening near 49450 level. After opening it will face resistance at this level and expected reversal towards the downside. Major upside rally only expected if banknifty starts trading and sustain above 49550 level. Downside 49050 will act as a important support for today's session.

Can Gold keep pushing up? 1H AnalysisWith new Tariffs in place, USD not doing all that great.. Gold has continued to be a "save" investment for many. explained on the chart, just have to wait for price action to make a move.
Important trading week.

Correction up to the target level.Following the previous analysis on January 24,
the price of Bitcoin has reached the bottom of the trading range channel.

Gold price analysis February 3⭐️Fundamental Analysis
US President Donald Trump imposed 25% tariffs on Canada and Mexico, and 10% on China, starting from 05:01 GMT on Tuesday. The reason is to combat illegal immigration and drug trafficking. Canada and Mexico responded with retaliatory tariffs, while China announced it would file a lawsuit at the World Trade Organization (WTO).
Markets reacted negatively, with the S&P 500 down 1.40% in particular, and money flows into the US dollar instead of gold. However, if China retaliates, gold, which is considered an inflation hedge, could rise. Traders will also pay attention to US and Chinese manufacturing PMI data, along with speeches from the Federal Reserve, which could impact gold prices.
⭐️Technical Analysis
Gold prices were pushed down by sellers around 2777 after hitting an all-time high. The important support of 2765 plays a role in pushing the gold price back to its upward trajectory. When the 2765 zone is broken, pay attention to the next 2 zones around 2746 and 2727. When the uptrend resumes, it will meet the reaction of the sellers around 2791 and the all-time high zone around 2814.
Gold Market Forecast: Next Week’s Trading Setup & Key Price ZoneGold continues to dominate the headlines, trading near all-time highs above $2,800 as market participants grow risk-averse. The White House’s confirmation of 25% tariffs on Canada and Mexico set to take effect on February 1 has sent ripples through the market, adding to the uncertainty.
On the macroeconomic front, December’s Core PCE Price Index—the Fed’s preferred inflation gauge—came in as expected, surpassing November’s numbers. This follows soft Q4 GDP figures and the Federal Reserve’s latest monetary policy meeting, where officials signalled that inflation risks remain tilted to the upside—strengthening the US Dollar and keeping traders on edge.
📉 So, where is Gold headed next? Will we see a breakout to fresh highs, or is a pullback on the horizon?
In this video, I break down my thought process on Gold’s next potential move and how I’m positioning myself for the upcoming trading week. 🚀
📌 Let me know your thoughts in the comments! Do you see Gold continuing its rally, or is a correction due?
#GoldPrice #XAUUSD #GoldAnalysis #GoldForecast #TradingGold #ForexTrading #Commodities #MarketAnalysis #GoldBreakout
Disclaimer Notice:
Trading in the foreign exchange market and other instruments carries a high risk and may not be suitable for all investors. The content provided here is for educational purposes only. Evaluate your financial situation and consult with a financial advisor before making any investment decisions. Past performance is not indicative of future results.

03.02.25 Morning ForecastPairs on Watch -
FX:GBPNZD
FX:NZDCAD
A short overview of the instruments I am looking at for today, multi-timeframe analysis down to what I will be looking at for an entry. Enjoy!

#NIFTY Intraday Support and Resistance Levels - 03/02/2025Gap down opening expected in nifty near the 23400 level. After opening if it's sustain above 23400 level then possible upside movement in nifty 23600 level. For today's session 23600 will act as a strong upside resistance for nifty. Major downside expected if nifty starts trading below the 23350 level this downside can goes upto 23150 level after the breakdown.

[INTRADAY] #BANKNIFTY PE & CE Levels(03/02/2025)Today will be gap down opening in banknifty. After opening if banknifty starts trading below 49450 level then possible downside target upto 49050 level in opening session. This downside rally can be extend for further 400-500+ points in case banknifty gives breakdown of 49000 level and starts below 48950 level. Any strong upside rally only expected if banknifty starts trading and sustain above 49550 level.

EURUSD another selling opportunity!Hey guys,
To keep it short, based on my previous analysis on EURUSD that the first TP target hit, I want to share another selling opportunity on this currency pair.
I consider the previous movement as a false breakout of price and a good rejection is happening.
So It can be another sell opportunity with reasonable risk/reward ratio (around 1/3).
Good luck

AAVEUSDT Breakdown Imminent ? Bearish Setup AAVE/USDT perpetual contract on the 2-hour timeframe presents a descending channel formation in the. The price has been respecting the upper and lower trendlines, showing multiple rejections at both levels. Currently, the price is testing the lower boundary of the channel, and a breakdown could trigger further downside momentum.
The short setup suggests a bearish continuation if the price breaks below the lower trendline. The entry point is positioned around the 264.57 level, with a stop-loss placed above the recent swing high to manage risk. The take-profit zone is projected toward 221.84, aligning with the next significant support level.
Key factors to consider
The price is forming lower highs and lower lows, confirming the downtrend structure.
The red zone represents the stop-loss area, ensuring risk management in case of reversal.
The blue zone marks the potential profit-taking region, which aligns with a strong demand zone.
If a breakdown occurs with strong bearish volume, it could accelerate the move toward the target zone.
A potential retest of the broken support level could offer additional confirmation before further downside.
Traders should monitor volume and market sentiment before entering the trade, ensuring that bearish momentum supports the continuation of the trend.

NEW ATH, grab twice bsl (buyers stops liquidity) and fall downNEW ATH, grab twice BSL (buyers stops liquidity) and fall down.
Hype about Trumps story end.
Right now we must go down and grab all SSL.
First target 2745(stop loss 2825)
Second and final target of my idea is 2718

Bitcoin Monthly Candle Close Colour and patterns JAN UPDATE
January Candle closed GREEN after a RED December close.
This now complicates issues greatly.
Of the previous 7 Green January Candles, 3 were after a RED December
We just created a 4th Green January after a RED December, which was the last December, 2024, current cycle.
From those 3 previous occasions, 2 of those went to a RED February and the 3rd was a close call but just managed to remain Green
Of the 3 RED February we have ever had, every one came after a Green January
Of the previous 7 Green Januaries, we had 4 Green February
The 3 Green Januaries after a RED December, went as follows ;-
The 1st was just after the 2013 ATH and led us down the slope into a Bear. The Following March was also RED
The 2nd was after Jan 2020 and the February closed RED and the March that followed saw a deep dive of near -60% before recovery that eventually led to the 1st ATH in 2021
The 3rd was in 2023 and February Closed Green but only Just and The Following March saw a 40% Rise Green
The other RED February we had was in 2012. This Followed a Green December and January and the March that followed was RED but then the Price went mental and rose to the 2013 ATH
If we are following patterns, we have a higher chance of a RED Feb and maybe March also but from that point on,. we Rise
This would actually be beneficial to Bitcoin PA as the weekly MACD is still OverBought and needs to cool off if we are going to reach for anew ATH in Q3 or Q4 2025
The real question is, are we still following patterns ?
Remeber, this is the BITCOIN chart - If BTC pulls back a bit, the ALTS will Follow
Providing BTC PA remains stable and BTC Dominace decreases, then ALTS have a chance.
But, as I mentioned early last year ( I think it was) Because Bitcoin is now a Corporate asset and seems to be being bought with a view to hold longterm, where will the Liquidity to finance an ALT Season come from ?
I think the ALT seasons we all remember are highly unlikely to return and I will explain why in a post I am currently building up where I will do the Monthly ccandle close colours for TOTAL and OTHERS Market Caps
Just got to find the time to finish them
Stay safe
