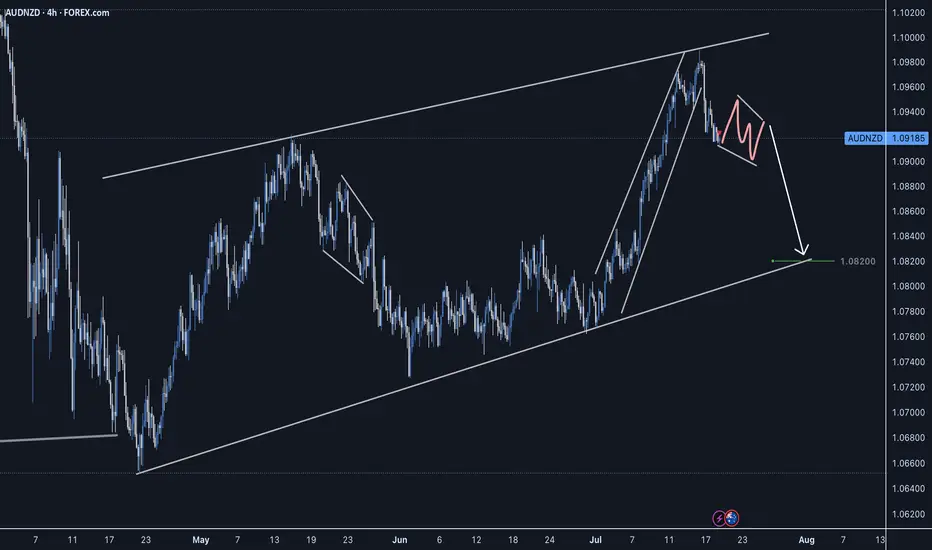
AUDNZD Short Setup - CAB EntrySellers stepping in, strong reversal impulse. Waiting for a slight correction before taking a short entry on the LTF.
Good Luck
Priceactionanalysis
Gold breaks trendline and returns to uptrend. BUY NOW!✏️ OANDA:XAUUSD A deep sweep to 3310 and bounce back to the trading range. Gold is reacting at the Trendline around the price zone of 3344. This is an important price zone that if broken will return to the uptrend and head towards 3373 soon. 3332 plays an important role in the current bullish wave structure, which is a suitable SL placement point for BUY signals.
📉 Key Levels
Support: 3332-3312
Resistance: 3344-3357-3373-3389
BUY trigger: Break and trading above Resistance 3344 (trendline, top uptrend wave 1)
BUY DCA trigger: Break Resistance 3353
Target 3373
Leave your comments on the idea. I am happy to read your views.

USDCAD bearish view
OANDA:USDCAD again on this pair, first analysis accurate, in new look having bearish view, price in PA moving, still we having nice structure, price is now come back in channel, looks like breaking first channel, which will take for confirmation and sign for bearish expectations.
SUP zone: 1.37400
RES zone: 1.36400, 1.36100

USDJPY Symmetrical Triangle – Be Ready for Breakout or BreakdownUSDJPY is currently squeezed inside a well-formed symmetrical triangle, indicating a breakout is imminent. This consolidation pattern is nearing its apex, and price action is getting tighter. A sharp move in either direction could unfold soon. Here's how to prepare:
🟢 Bullish Breakout Setup:
Entry Trigger: 1H candle close above 148.70
Stop Loss: Below last higher low or triangle support (~148.15)
Targets:
TG1: 149.20
TG2: 149.60
Final TG: 149.95–150.00
Bias: Favors trend continuation (previous uptrend)
🔍 Confirmation: Strong breakout candle with momentum and/or volume.
🔴 Bearish Breakdown Setup:
Entry Trigger: 1H candle close below 148.15
Stop Loss: Above triangle resistance (~148.70)
Targets:
TG1: 147.60
TG2: 147.20
Final TG: 146.80
Bias: Reversal or failed trend continuation
🔍 Confirmation: Clean breakdown with bearish candle close + possible re-test rejection.
⚠️ Avoid premature entries inside the triangle. Wait for a confirmed breakout or breakdown with candle close and rejection follow-up.
🎯 Tip: Triangle breakouts often result in fast directional moves. Plan your lot size based on volatility and stick to your risk parameters. This is a high-probability setup — trade with discipline.
=================================================================
Disclosure: I am part of Trade Nation's Influencer program and receive a monthly fee for using their TradingView charts in my analysis.
=================================================================

EURUSD & US30 Trade Recaps 18.07.25A long position taken on FX:EURUSD for a breakeven, slightly higher in risk due to the reasons explained in the breakdown. Followed by a long on OANDA:US30USD that resulted in a loss due to the volatility spike that came in from Trump.
Full explanation as to why I executed on these positions and the management plan with both.
Any questions you have just drop them below 👇

Gold Price Analysis July 18XAUUSD Analysis
Gold has just had a deep sweep to 3310 before bouncing back within the trading range. Currently, the price is reacting at the Trendline area around 3344. This is an important level - if broken, gold can return to the uptrend, with the nearest target at 3373.
🔹 Key Levels
Support: 3332 - 3312
Resistance: 3344 - 3357 - 3373 - 3389
🔹 Trading Strategy
BUY trigger: when price breaks 3344
BUY DCA: when price surpasses 3353
SL: below 3332
Target: 3373
💡 Note:
The 3332 area plays an important role in the bullish wave structure, suitable for placing Stop Loss for BUY orders.

18.07.25 Morning ForecastPairs on Watch -
FX:GBPAUD
FX:EURAUD
FX:EURNZD
FX:EURCAD
A short overview of the instruments I am looking at for today, multi-timeframe analysis down to what I will be looking at for an entry. Enjoy!

GBPUSD ANALYSIS From the previous trading day we can see that the pair has been making random up and down movements without a clear direction and even though we rejected a key support area the higher timeframes like daily and weekly still show bearish sentiment right now the best move is to wait

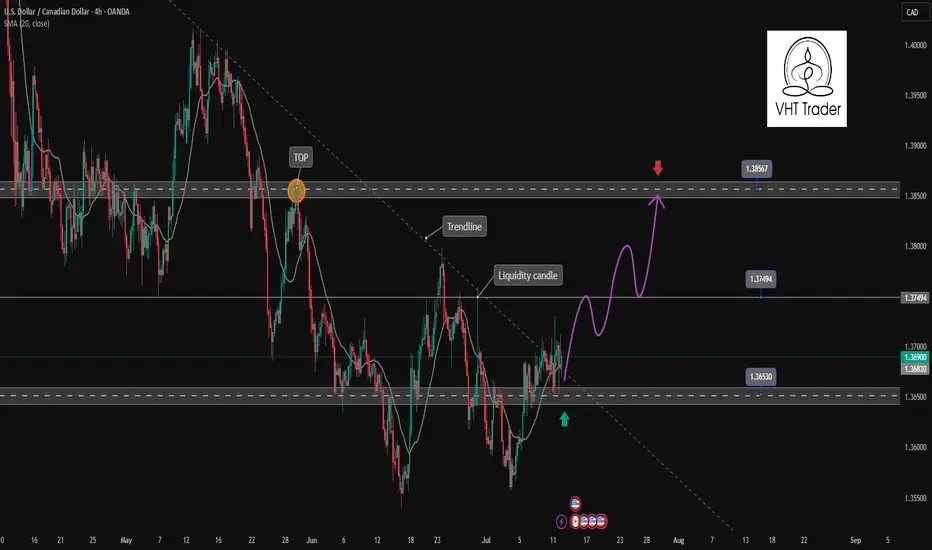
USDCAD is showing signs of bullish recovery✏️ OANDA:USDCAD has broken the Trendline structure to form a corrective uptrend. The price is still above the 20 SMA, indicating that the market's bullish momentum is still strong. The bullish wave may extend to 1.385. Pay attention to the reaction at the 1.375 liquidity candle wick zone for a positive DCA strategy.
📉 Key Levels
Support: 1.365
Resistance: 1.375-1.385
BUY Now: 1.365 (Strong support zone)
BUY Trigger: break and close above 1.375
Target: 1.385
Leave your comments on the idea. I am happy to read your views.
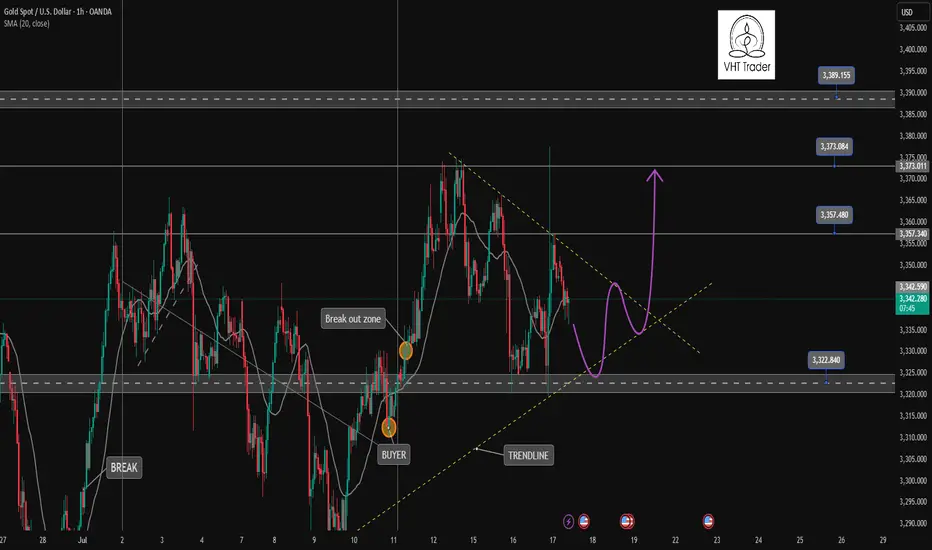
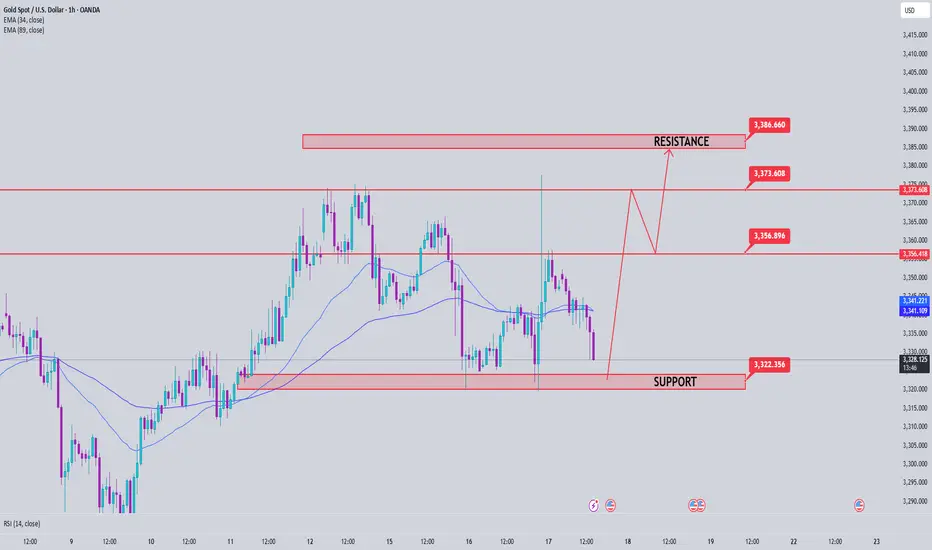
Gold returns to Sideway range waiting for new momentumOANDA:XAUUSD A sweep of liquidity back to the 3377 zone and then back into the triangle trading range. Currently, the market will wait for new momentum for the next trend. If the 3322 zone is still holding, the uptrend to 3400 is still there. This is an important price zone in today's trading day.
📉 Key Levels
BUY Trigger: rejection 3323 with bullrish confirmation
Target: 3373
SELL Trigger: Break and trading Bellow support 3321
Target: 3285
Leave your comments on the idea. I am happy to read your views.
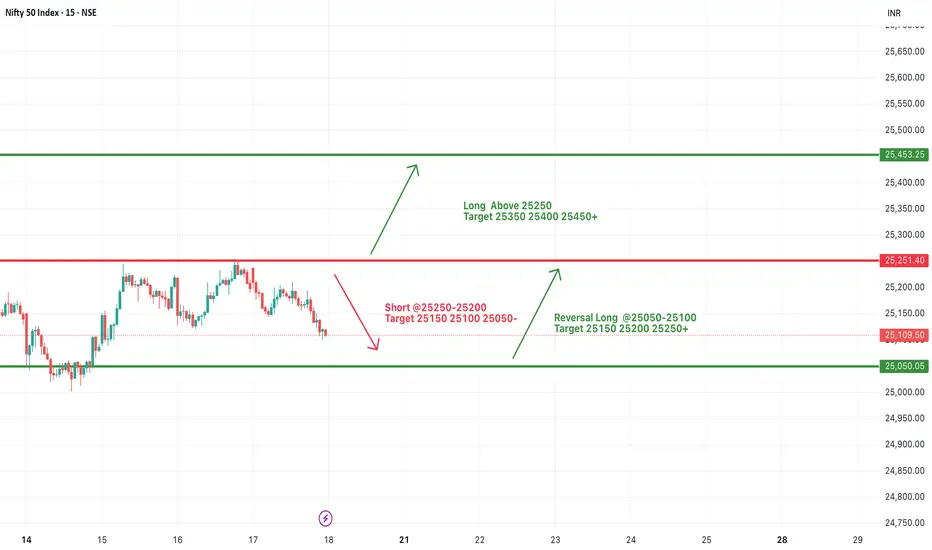
#NIFTY Intraday Support and Resistance Levels - 18/07/2025Nifty is likely to open slightly gap-up today near the 25100–25150 zone. There are no major changes from yesterday’s levels, so the same trading levels remain in focus for today’s session. If Nifty sustains above the 25250 level, we can expect an upside move toward 25350, 25400, and even 25450+ levels. This area remains a crucial resistance zone for potential bullish continuation.
On the downside, if Nifty fails to cross and sustain above 25250 and breaks below the 25200–25250 zone, we may witness a downward move with possible targets at 25150, 25100, and 25050.
A reversal long opportunity may arise in the 25050–25100 support zone if the market finds buying interest after a dip. From this level, we can expect targets around 25150, 25200, and 25250+.
The index is trading in a tight range with no fresh cues. Avoid aggressive entries and stick to level-based trades with strict stop-loss and partial profit booking.
[INTRADAY] #BANKNIFTY PE & CE Levels(18/07/2025)Bank Nifty is expected to open flat around the 56800 zone, suggesting indecision in the early session. If it manages to move upward and sustain above the 57050–57100 resistance range, it could invite bullish momentum targeting 57250, 57350, and even 57450+. A breakout above this level can trigger a continuation of upward movement, but volume and price confirmation are essential.
On the downside, if the index stays weak and slips below the 56950–56900 zone, we may see fresh bearish pressure pulling it toward 56750, 56650, and 56550 support levels. This zone remains a crucial intraday pivot for traders to watch.
A reversal opportunity may also emerge if the index drops further near 56550–56600 and then shows a sharp recovery. In such a case, targets of 56750, 56850, and 56950+ are possible, making it a good support-based bounce trade. Overall, the market might remain sideways with both opportunities for quick scalps and reversals—focus on key levels and act with strict stop losses.

SOXL — Buying on a Strong Uptrend with 30%+ Profit PotentialDirexion Daily Semiconductor Bull 3x Shares (SOXL) continues to move in a clear uptrend after breaking long-term resistance. Price is consolidating above the breakout level, indicating sustained interest from major market participants.
Long positions remain valid.
Profit targets:
First target — 39.85
Second target — 60.42
The setup offers over 30 percent profit potential. The semiconductor sector continues to lead the broader market higher.
Focus on trading with the trend. Adding on pullbacks is reasonable with proper risk management in place.

17.07.25 Morning ForecastPairs on Watch -
OANDA:US30USD
CAPITALCOM:DE40
FX:GBPJPY
A short overview of the instruments I am looking at for today, multi-timeframe analysis down to what I will be looking at for an entry. Enjoy!

Gold Price Analysis July 17XAUUSD Analysis Today
The price has cleared the liquidity to the 3377 zone, then returned to trading within the triangle. The market is currently waiting for new momentum to determine the next trend.
✅ BUY Scenario
If the 3322-3323 zone continues to hold and there is a bearish rejection signal and confirmation of buying power, gold is expected to continue its uptrend towards the 3373 - 3400 zone.
❌ SELL Scenario
If the price breaks the 3321 support with clear selling pressure, it can extend the decline to 3285.
🔑 Key Level Today
Support: 3321 - 3323
Resistance: 3373 - 3400
💡 Strategy:
Watch the price reaction at the important support zone to decide the next action.
SBIN , 1W , Bullish As the Pattern is Formed and given Breakout , enter after strong candle close in weekly Timeframe and put SL below Swing low . follow proper risk management
follow for more swing ideas like this

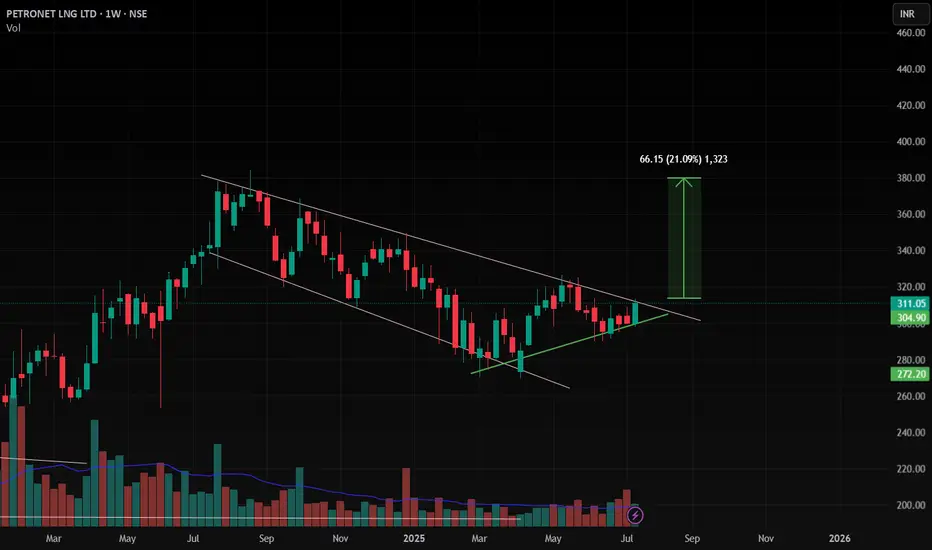
Petronet , 1W , BullishAs the Pattern is Formed and Ready for Breakout , enter after strong candle close in weekly Timeframe and put SL below Swing low . follow proper risk management
follow for more swing ideas like this
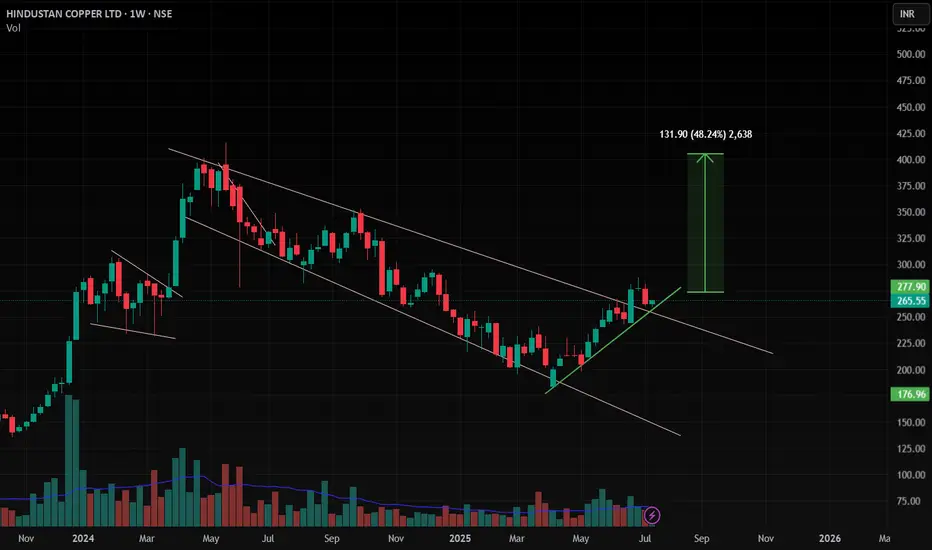
HINDCOPPER , 1W , Bullishthe Pattern is already broken out and now it is at Retest point wait patiently for strong close in weekly . then enter with proper risk management , keep SL below its Swing Low
Follow for more Swing ideas like this
[INTRADAY] #BANKNIFTY PE & CE Levels(17/07/2025)Bank Nifty is expected to open slightly gap-up near the 57100 zone. This level is a key intraday pivot. If the index sustains above 57100, it could trigger upward momentum toward the next resistance levels at 57250, 57350, and potentially 57450+. A move beyond 57550 will likely strengthen the bullish sentiment and may stretch the rally further toward 57750, 57850, and 57950+.
On the downside, if Bank Nifty fails to hold 57050–57100 and slips below 56950–56900, it may invite selling pressure, with potential downside targets at 56750, 56650, and 56550. This zone acts as short-term support, and failure to hold here could lead to further weakness.
Overall, Bank Nifty is currently in a range with bullish bias above 57100.

BUY ETHUSDT 16.7.2025Confluence order: BUY at M15
Type of order: Limit order
Reason:
- M15~FIBO 0,5-0,618 (same position)
Note:
- Management of money carefully at the price of sub key M15 (3152)
Set up entry:
- Entry buy at 3137
- SL at 3127
- TP1: 3152
- TP2: 3164
Trading Method: Price action (No indicator, only trend and candles)

16.07.25 Morning ForecastPairs on Watch -
FX:GBPJPY
FX:GBPNZD
FX:USDJPY
A short overview of the instruments I am looking at for today, multi-timeframe analysis down to what I will be looking at for an entry. Enjoy!

BUY XAUUSD 16.7.2025Trend Resumption at H1: BUY at M15
Type of order: Limit order
Reason:
- The price brokeout the sub key of M15, confirming the uptrend into main key M15.
Note:
- Management of money carefully at the price of sub key M15 (3335)
Set up entry:
- Entry buy at 3325
- SL at 3319
- TP1: 3335
- TP2: 3347
Trading Method: Price action (No indicator, only trend and candles)

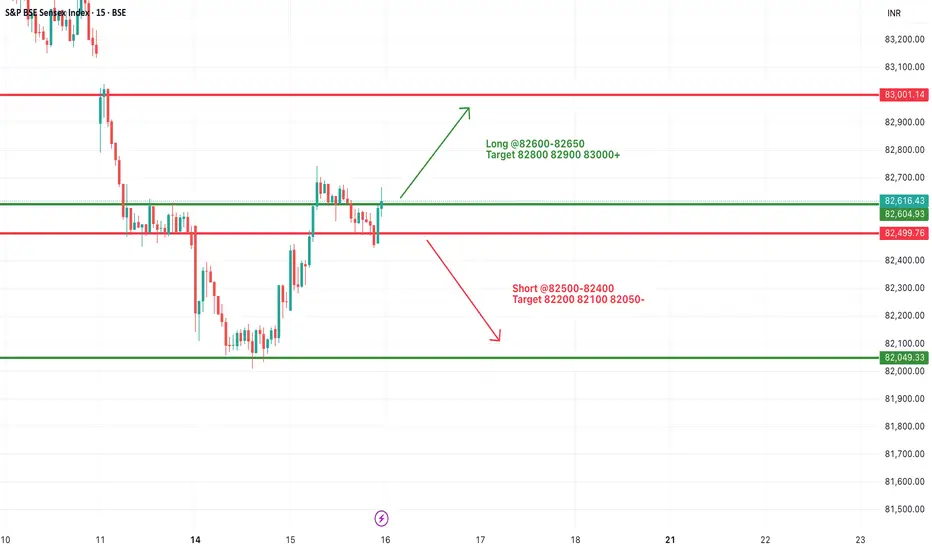
#SENSEX Intraday Support and Resistance Levels - 16/07/2025Sensex is expected to open flat near the crucial 82600–82650 resistance zone, which has acted as a turning point multiple times recently. A sustained move above this range may trigger bullish momentum toward 82800, 82900, and even 83000+. This move would indicate a positive continuation after the recovery seen from recent lows.
However, if the index faces rejection around 82600–82650, it may once again slip below 82500, opening the door for short-side opportunities with targets at 82200, 82100, and 82050. This region has seen a lot of price action over the last few sessions, so volatility may be higher.