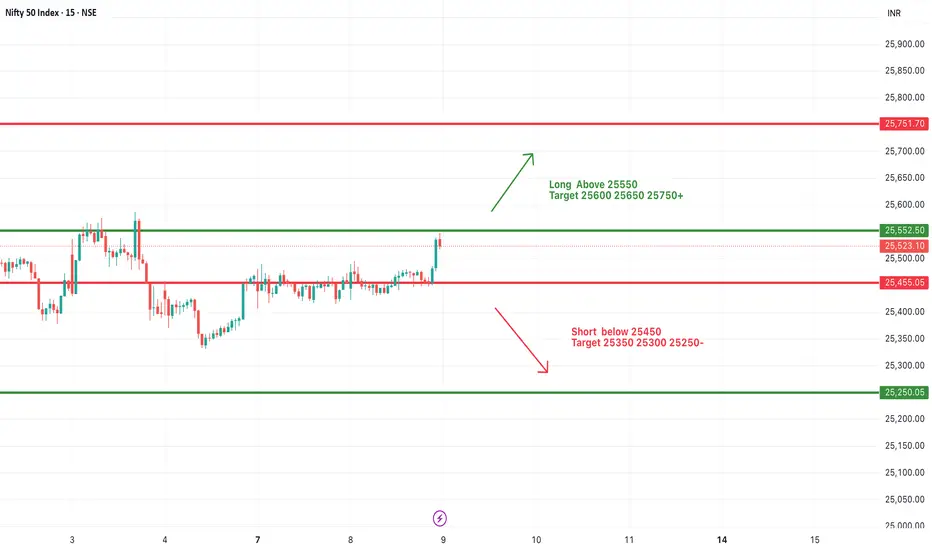
#NIFTY Intraday Support and Resistance Levels - 09/07/2025Nifty is expected to open slightly gap up around the 25500–25520 zone, showing positive momentum from the previous day’s breakout above its recent consolidation range. If the index sustains above the 25550 level, we can expect bullish continuation toward the upside targets of 25600, 25650, and 25750+ levels. This zone may act as an intraday breakout trigger.
On the downside, 25450 will now act as immediate support. Any sharp move below 25450 could invite selling pressure, and we may see a downside slide toward 25350, 25300, and 25250-. The trend remains mildly bullish above 25550, while below 25450 the trend may turn weak intraday.
Priceactionanalysis
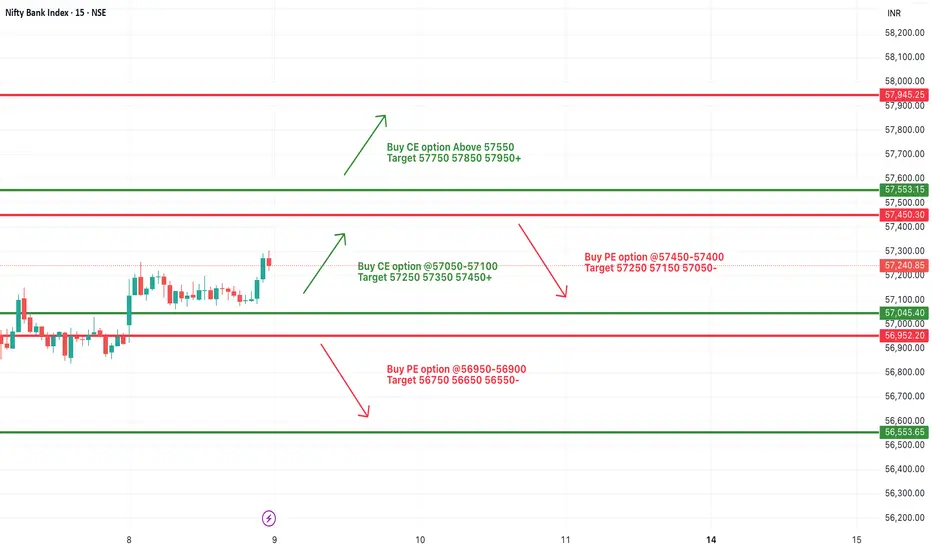
[INTRADAY] #BANKNIFTY PE & CE Levels(09/07/2025)Bank Nifty is expected to open slightly gap up today near the 57200-57250 zone, indicating mild bullish sentiment carrying over from the previous session. The index has broken out of the tight consolidation range and now approaches a key resistance near the 57400-57450 area.
A sustained move above 57550 could lead to a fresh upward rally toward 57750, 57850, and 57950+, supported by recent bullish momentum. However, if the index fails to sustain above 57400-57450, it may see a pullback, where traders should watch for possible selling pressure targeting 57250, 57150, and even 57050-.
If Bank Nifty drops below the 57100 level and especially under the 56950-56900 zone, it may turn bearish with potential downside targets at 56750, 56650, and 56550-. Overall, price action around the 57450 level will be key in defining intraday trend direction.
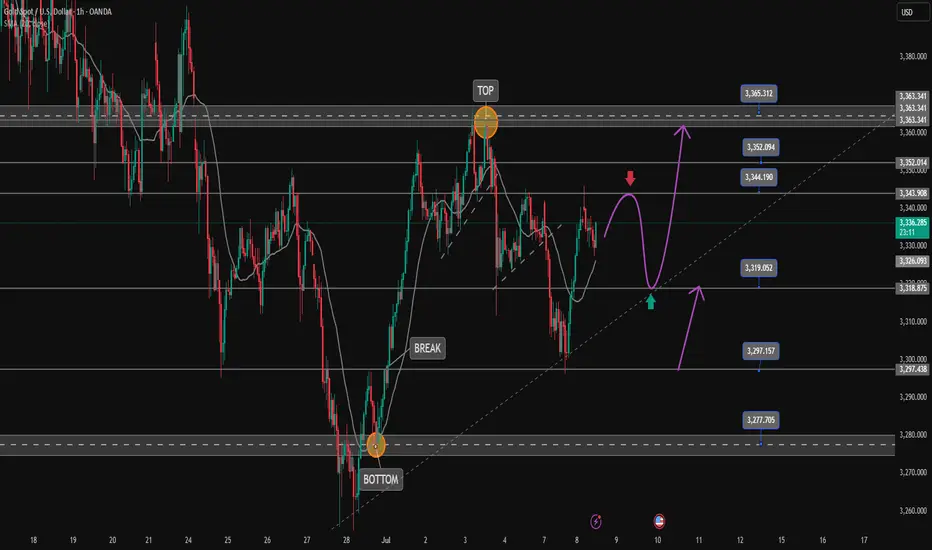
Gold (XAUUSD) – July 9 | M15 Bearish Pullback After H4 OB Tap🟡 Gold (XAUUSD) – July 9 Analysis | H4 OB Tapped, M15 Still Bearish
The market has just tapped into the H4 order block near 3280 (3288–3275) — a level we’ve been tracking closely.
However, price action shows that the H4 pullback is still active and not yet complete.
Yesterday, Gold respected the H4 supply zone (3342–3345) exactly as anticipated.
Since then, price broke below the M15 low at 3296 , confirming that bearish momentum remains valid on the lower timeframe.
🔍 Structure Breakdown
• H4: Pullback ongoing
• H4 OB: 3288–3275 (just tapped)
• M15: Broke below 3296 → Bearish trend continuation confirmed
• Current M15 State: In pullback phase
⚠️ Key Consideration:
While we are looking at bearish opportunities, keep in mind that the H4 OB (3288–3275) is a significant demand zone.
If the market begins to reclaim structure and breaks the Lower High(H4 supply zone), this could signal resumption of the H4 uptrend .
Until that happens, we remain cautiously short — but prepared to adapt.
📌 What We’re Watching
Despite the H4 OB tap, M15 remains bearish until proven otherwise.
So the focus stays on short opportunities — no longs unless structure shifts.
📍 Key M15 POI for Rejection:
→ 3322–3326 (Order Block)
→ If price pulls into this zone and gives M1 confirmation (ChoCh + micro BoS)
→ We’ll plan short setups aligned with current trend
If this zone fails, or structure flips bullish, we’ll wait patiently for a potential revisit of the H4 supply zone (3342–3345) — which remains a valid short area for high-probability setups.
🧠 Summary:
✅ H4 OB (3288–3275) tapped
❌ No bullish reversal yet — M15 still bearish
🔍 Watching 3322–3326 for possible short
📉 Bias: Bearish until structure shifts
But be flexible — if LH breaks, the game changes.
📖 Respect the structure.
The chart doesn’t reverse because you want it to —
It reverses when the market is done moving the other way.
📘 Shared by @ChartIsMirror

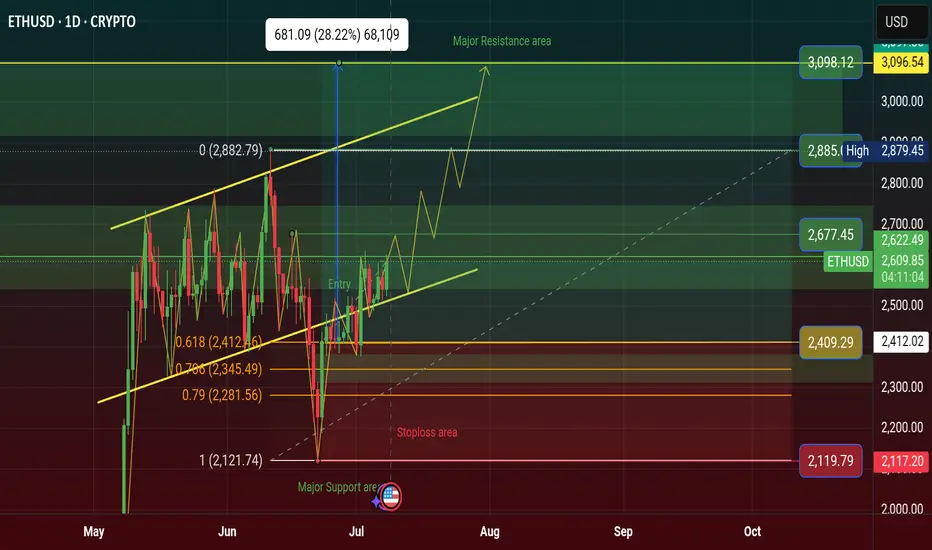
$ETH Price Will Rising $3098 in Q3, Bullish Flag Inverse AngleCRYPTOCAP:ETH price will Rising $3098 in Q3 in 2025, Price Showing a Bullish Flag Inverse Angle. it's a Reversal Pattern and Manipulation Price. See more on Chart.
Crypto News: An Ethereum address holding 900 ETH started moving coins Monday after spending nearly 10 years dormant.
The holder received these genesis coins in 2015 when ETH traded below 50 cents.
These pre-mined tokens were distributed to early Ethereum contributors before mining began.
Their current value reaches 2.2 million with ETH trading around 2,529 per coin.
This represents potential gains exceeding 5,000% from the original sub-dollar entry price.
The move follows similar whale activity, including a 27.6 million Ethereum sale in April.
Last week saw a Bitcoin whale move 8 billion after 14 years of hodling.
ETH remains 48% below its 2021 all-time high of 4,878 despite recent stability.
The holder technically isn't a whale, which requires a minimum of 10,000 ETH at current prices.
#Write2Earn #BinanceSquareFamily #ETH #SUBROOFFICIAL
Disclaimer: This article is for informational purposes only and does not constitute financial advice. Always conduct your own research before making any investment decisions. Digital asset prices are subject to high market risk and price volatility. The value of your investment may go down or up, and you may not get back the amount invested.
$SOL Price Will Hit $228 Q3, Inverse Head and Shoulder Pattern✨ CRYPTOCAP:SOL Price Will Hit $228 in Q3 of 2025 | Solana Chart Showing Inverse Head and Shoulder Pattern. It's a Bullish Reversal Pattern.
‣ Solana price is hovering below key resistance; a breakout above $159 and it's going to $228.
ETF Buzz Grows, but Price Action Still Caught in Limbo Here is why this could be the catalyst that sends price to all time highs Do THIS before that happens.
‣ Solana ETF Buzz Grows, but Price Action Still Caught in Limbo
🔸BlockNews The SEC has asked SOL ETF applicants to revise and refile submissions by end of July, fueling speculation of an ETF approval before October. Solana’s daily active addresses just hit a record 15.39 million, pointing to rising demand and user engagement on the network.
#Write2Earn #NFPWatch #BinanceSquareFamily #TrumpTariffs #SUBROOFFICIAL
Disclaimer: This article is for informational purposes only and does not constitute financial advice. Always conduct your own research before making any investment decisions. Digital asset prices are subject to high market risk and price volatility.

BTC , 4hr , BearishBTC is Forming a Pattern and it is at the top of the Another Pattern and It is facing rejection 3 Times from Above and now it is forming another pattern inside and Ready for Break Down of the Pattern , if it breaks the Pattern Down then it will be bearish almost 90% it will move to down side , if it has not given Breakdown and moving inside the small pattern then wait patiently and observe carefully .
Then it may also give Breakout for up side .
Follow Risk Management Properly
Follow for More Swing Ideas Like this .

Gold is bullish and needs more momentum at 3320The buying pressure in the US session pushed the price up and formed a bullish hammer candle on D1. Today's bearish recovery is seen as a buying opportunity to head towards the uptrend again.
3344 is the immediate resistance zone in the European session that Gold faces. Breaking this resistance zone will head towards 3365. According to the wave structure, it would be great to have a retest of 3320 to find some buying momentum and then break 3344.
SUPPORT: 3320-3297
RESISTANCE: 3345-3352-3365
SELL Trigger: Break 3320 ( Trendline & break zone)
Do you have any comments on the trading plan? I would love to hear your views.
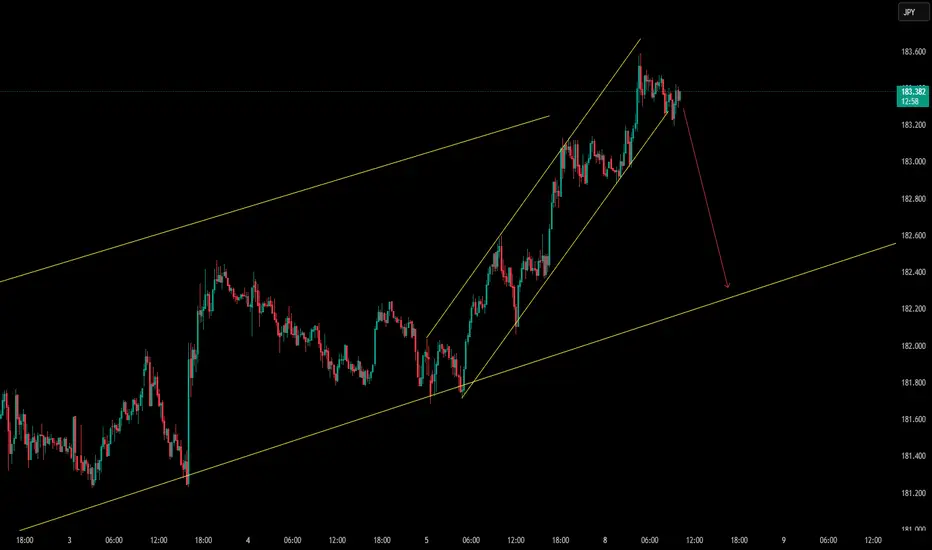
This pullback is necessary to maintain the channel structure.OANDA:CHFJPY
We're in an ascending channel on the higher time frame, and based on candlestick patterns, I expect a minor crash as the market tests the bottom of the channel.
Stay with me so we don't miss the move. ✅
Gold price analysis July 8In the previous US session, strong buying pressure pushed gold prices up and formed a bullish hammer candlestick pattern on the D1 chart - a potential sign for an uptrend recovery.
🔄 Today's scenario: The correction in the early session is considered a good opportunity to buy, expecting the price to continue the uptrend.
📍 Nearest resistance zone:
The price is currently facing the resistance zone of 3344 in the European session. If gold breaks 3344, the next target will be 3365 - the gap zone that has not been filled.
However, according to the wave structure, it would be more optimal if the price has a retest to the 3320 zone, accumulates more buying momentum and then breaks out strongly through 3344.
📉 Bearish scenario:
If 3320 is broken, especially with a trendline and support zone breakout signal, a sell strategy can be activated with a lower target.
🔸 Support: 3320 – 3297
🔸 Resistance: 3345 – 3352 – 3365
🔸 Sell is triggered if: Price breaks 3320, confirms breaking trendline & support zone.
💬 Do you have any comments on this trading plan? Leave a comment!

08.07.25 Morning ForecastPairs on Watch -
FX:EURUSD
FX:USDJPY
A short overview of the instruments I am looking at for today, multi-timeframe analysis down to what I will be looking at for an entry. Enjoy!

Trend Continuation After NonfarmToday's D1 candle started to continue the trend of NF with a decrease to 3306 in the Asian session this morning.
The bearish structure of Gold Price will continue in today's trading session towards important support zones.
The downtrend of Gold was only broken with a candle closing back above 3324. And the downtrend may reach support 3275 today.
Support 3297-3275
Resistance 3324-3343-3364
SELL Trigger: Break support 3296

#SENSEX Intraday Support and Resistance Levels - 08/07/2025Sensex is expected to open flat today around the 83400 zone, showing no major gap or volatility at the open. The index continues to move in a tight consolidation range between 83300 and 83500. A decisive move outside this zone is likely to give direction to the market.
If the index sustains above 83500, it could lead to a bullish breakout, pushing prices towards 83700, 83800, and eventually 83950+. This breakout may indicate fresh buying interest after a prolonged sideways phase.
However, if Sensex breaches the 83300 level on the downside, it could trigger selling pressure with targets at 83050, 82900, and 82800-. Traders are advised to wait for a clear breakout or breakdown before entering any trades, as the current zone lacks momentum.

#NIFTY Intraday Support and Resistance Levels - 08/07/2025Nifty is expected to open flat with no major change in the overall levels compared to the previous session. The index continues to hover near a crucial resistance zone around 25450–25500. A breakout above 25550 will indicate bullish strength and may lead to an upward move toward 25600, 25650, and even 25750+. This zone has been tested multiple times, and a decisive break can attract further buying.
On the downside, the support remains at 25450. A break below this level can invite selling pressure, with immediate targets at 25350, 25300, and 25250-. The market is clearly respecting this consolidation band, so any directional move will depend on a confirmed breakout or breakdown from these levels.
Traders should remain cautious and avoid early entries unless a clean move is seen beyond the 25550 or below the 25450 levels.

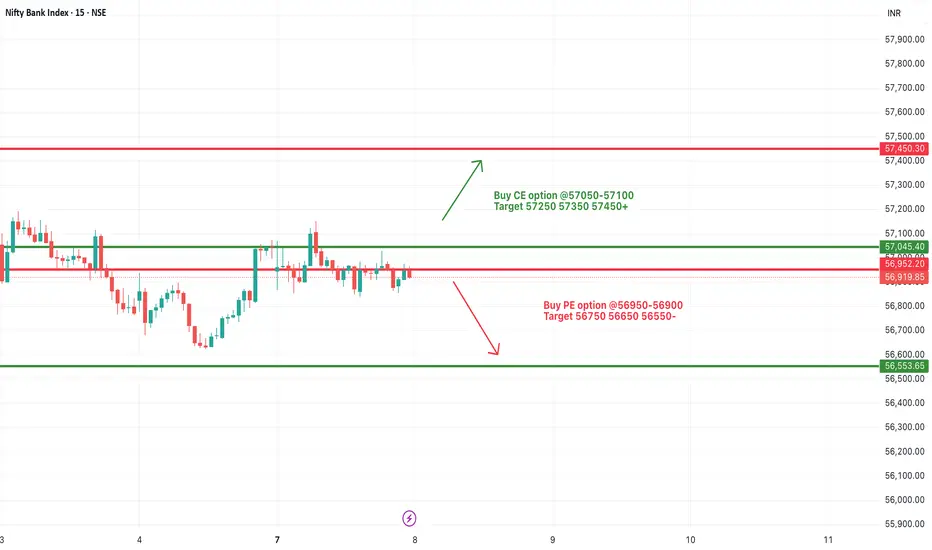
[INTRADAY] #BANKNIFTY PE & CE Levels(08/07/2025)Bank Nifty is expected to open flat with no significant change in levels compared to the previous session. The price action continues to remain within a consolidation range between 56950 and 57050. A breakout above the 57050 level could trigger bullish momentum, with potential upside targets at 57250, 57350, and 57450+. This resistance zone has been tested multiple times, and a clean breakout could attract fresh buying interest.
On the other hand, if Bank Nifty slips below the 56950–56900 support zone, it may lead to fresh selling pressure. In that case, we may see targets of 56750, 56650, and 56550 being achieved on the downside.
Since the market is currently range-bound and trading near the breakout/breakdown zones, traders are advised to stay cautious and wait for a confirmed move above 57050 or below 56950 for directional trades. Risk management is key, especially in this narrow consolidation phase.
EURCHF bullish push expecting
OANDA:EURCHF price u PAu, currently looks like its on good, valid sup zone.
From here expecting bullish push
SUP zone: 0.93400
RES zone: 0.93950, 0.94100

07.07.25 Morning ForecastPairs on Watch -
FX:AUDCAD
FX:USDJPY
FX:EURUSD
A short overview of the instruments I am looking at for today, multi-timeframe analysis down to what I will be looking at for an entry. Enjoy!

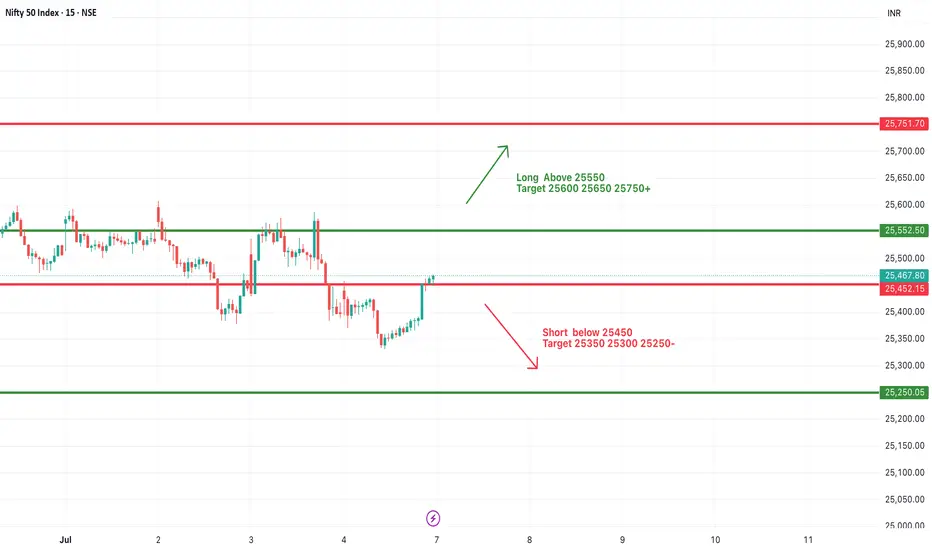
#NIFTY Intraday Support and Resistance Levels - 07/07/2025Nifty is expected to open flat near the 25450–25500 zone, which lies close to an important decision area. If Nifty manages to sustain above the 25550 level, we can expect bullish momentum to resume with upside targets of 25600, 25650, and possibly 25750+. This level marks a potential breakout zone, and holding above it could bring back buyers’ interest.
On the downside, a breakdown below 25450 may trigger fresh selling pressure, leading to downside targets of 25350, 25300, and 25250. The 25450 level has acted as both a support and resistance in recent sessions, making it a key pivot point for intraday direction.
Traders should be patient and wait for a clear breakout or breakdown above or below these levels. Volatility may be witnessed around the opening range, so it's advisable to trade with strict stop losses and manage risk through partial profit booking near targets.
Gold Trading Strategy July 3✏️D1 candle continues to increase towards the price gap zone. At the beginning of the European session, sellers accept to enter the market at this resistance price zone around 3365. The accumulation pattern of gold price is forming a triangle pattern.
The lower boundary is broken, it will lead to the breakout point of the lower boundary and vice versa, if the upper boundary of the triangle is broken, the price will move towards the next resistance.
📉 Key Levels
Resistance: 3388-3363
Support: 3330-3311-3297-3277
Buy trigger: breakout above 3363
Sell trigger: breakout below 3330
If this idea resonates with you or you have other ideas, please comment. I look forward to reading your thoughts!
Best regards, VHT Traders!

EURNZD Trade Recap +3% 2nd July 2025A long position taken on EURNZD for +3%. Full explanation as to why I executed on this position and also my management plan I put in place.
Any questions you have just drop them below 👇

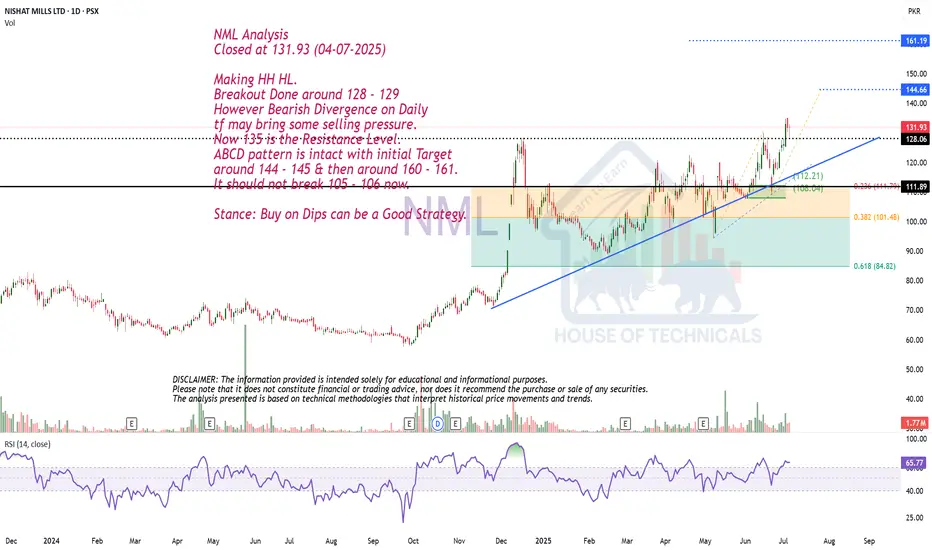
Making HH HL.NML Analysis
Closed at 131.93 (04-07-2025)
Making HH HL.
Breakout Done around 128 - 129
However Bearish Divergence on Daily
tf may bring some selling pressure.
Now 135 is the Resistance Level.
ABCD pattern is intact with initial Target
around 144 - 145 & then around 160 - 161.
It should not break 105 - 106 now.
Stance: Buy on Dips can be a Good Strategy.
04.07.25 Morning ForecastPairs on Watch -
FX:GBPJPY
FX:USDJPY
OANDA:XPTUSD
FX:EURCAD
A short overview of the instruments I am looking at for today, multi-timeframe analysis down to what I will be looking at for an entry. Enjoy!

AjantaPharma ,1W , Bullish it has Formed a Very Good Pattern in Weekly and giving Breakout ,Take the Trade after Strong Weekly Close and put the Sl below its Swing low and Follow Proper Risk Management
Follow for More Swing Ideas like this

Ultracemco , 1W , Bullish As Ultracemco is Formed pattern and giving Breakout Now , Watch Carefully after Weekly Confirmation and Take Trade and follow proper Position Sizing and Risk according to your account size
follow for More Swing Ideas like this
