GBPUSD Buy Setup! BoS + OB + 61.8–79% Fib + Trend Channel ComboGBPUSD | 30-Min Chart – High Probability Long Setup Identified
GBPUSD is showing bullish intent after a clear Break of Structure (BoS) and now offers a high-confluence buy opportunity. This setup combines Smart Money Concepts with classical technical analysis for a sniper-grade entry.
🔍 Trade Breakdown:
📈 Break of Structure (BoS):
Price broke previous highs with strong bullish momentum.
Confirmed market intent shift from ranging to bullish.
📐 Fibonacci Confluence:
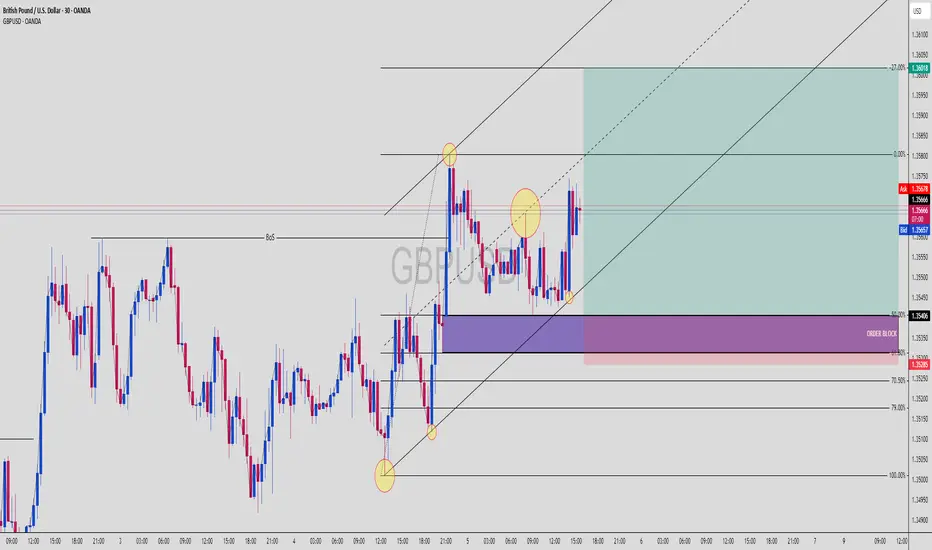
Price retraced perfectly into the 61.8% – 79% Fib zone from the latest bullish impulse.
These golden ratio levels align with an institutional Order Block (OB) and ascending trendline — high confluence entry.
🟣 Order Block Zone (OB): 1.35285 – 1.35406
The last bearish candle before bullish BoS — a clean demand zone.
OB sits within the Fib retracement zone and overlaps a mid-trendline tap.
📐 Fibonacci Levels (Swing Low to High):
61.8% = 1.35285
70.5% = ~1.35190
79% = ~1.35075
This is the institutional kill zone — OB + 61.8–79% retracement = precision buy levels.
🟡 Liquidity Sweep + Reaction:
Price swept liquidity below short-term lows and tapped the OB with a sharp bullish reaction.
Candle confirmation + lower wick shows strong rejection from Smart Money.
🧭 Projected Move:
Targeting a move toward the -27% Fib extension at 1.36018
Trendline and internal structure support bullish continuation
🔵 Projected Path:
Sweep ➝ OB/Fib confluence tap ➝ strong bullish continuation into premium territory
🧠 Chart Ninja Entry Plan:
🔹 Entry Zone: 1.35285 – 1.35406 (OB + 61.8–70.5% Fib)
🔻 SL Below: 1.35000 (beneath OB & key structure low)
📈 Target: 1.36018 (-27% Fib extension)
⚖️ RRR: 1:3+ — sniper entry with institutional precision
💬 Ninja Wisdom:
Smart Money isn’t buying breakouts — they buy retracements into OB zones with precision.
Combine OB + Fib + channel = institutional roadmap.
Let price come to you. Let retail chase. 🥷💸
📍 Save this GBPUSD setup before it hits the next impulse wave
🗣️ Drop your thoughts – are you buying this OB too?
👣 Follow @ChartNinjas88 for more institutional-grade setups daily
Priceactionforex
XAUUSD Rejection from Fib + OB Combo | Bearish Continuation?XAUUSD | Premium Smart Money Short Setup 🎯
This GOLD setup is a straight-up institutional-grade bearish continuation. Let’s break down why this is a high-probability short for Smart Money Traders.
🔍 1. Market Context
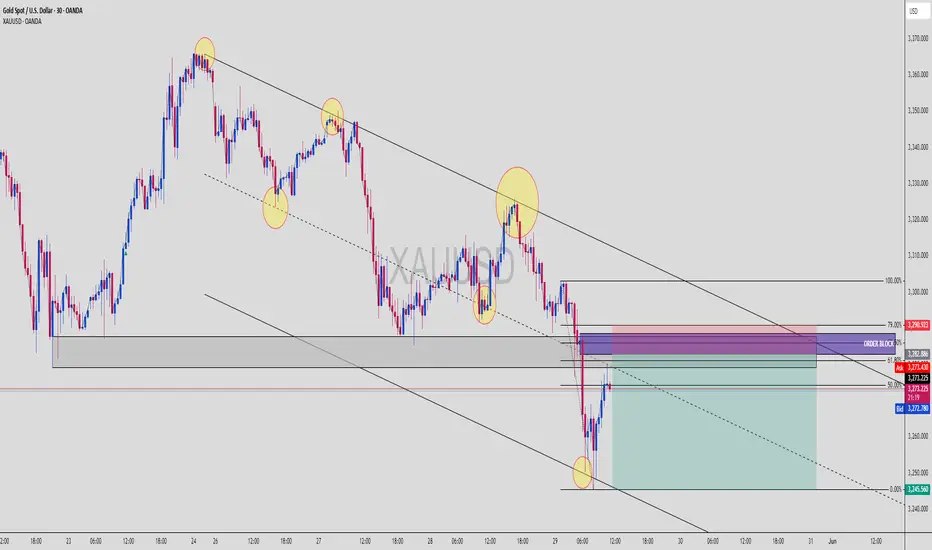
Price is trending inside a clear descending channel, tapping into the lower boundary and now pulling back.
We just had a reaction from the mid-supply zone, and price is now rebalancing into the Order Block (OB) aligned with:
🔻 79% Fibonacci Retracement
🔻 Previous Structure Break
🔻 OB + imbalance fill zone
🧱 2. Bearish Confluences
📉 Descending Channel = bearish structure
🟣 Order Block Zone = high-value area for institutional entries
📐 Fibonacci Levels = 61.8%, 70.5%, and 79% all stacked
💥 OB + 79% = high-prob sniper short
🕳 Imbalance + Liquidity Sweep = likely short continuation
🎯 3. Trade Idea
Entry: 3282.00–3290.00 (OB + 79% Fib)
Stop Loss: 3294.00 (above OB wick)
Take Profit: 3245.00 zone (channel bottom)
Perfect RR setup 👇
⚖️ 4. RRR (Risk-Reward Ratio)
💰 Entry: ~3285
🔒 SL: ~3294
📍 TP: ~3245
✅ RRR ≈ 1:4.3 = sniper level swing short 🎯
🧠 5. Smart Money Logic
Liquidity Sweep above minor high before short = engineered trap
OB reaction at fib premium zone = smart entry
Continuation expected unless price closes above 3295
📌 Save this chart — this is Smart Money flow in action
💬 Drop “Gold OB SMC 🔥” in comments if you saw this coming
🔁 Repost to help fellow traders master fib+OB sniper entries
GBPUSD Decision Point | Will the Order Block Hold or Fold?GBPUSD | Smart Money Liquidity Trap or Bullish Breakout?
Here’s a high-probability play based on Order Blocks, Fair Value Gaps, and channel structure—one of the cleanest SMC setups on cable this week.
📊 1. Market Overview
GBPUSD is currently pulling back after a sharp drop, retesting the premium zone Order Block on the H1 timeframe.
Structure remains bullish inside the ascending channel, but there’s major indecision here—will it break above the OB, or retrace deeper into the Fair Value Gap zone?
🧠 2. Dual Bias Logic
You’ve mapped out two valid SMC scenarios (marked in red & blue arrows):
🔻 Scenario 1: Bearish Trap + Deep Liquidity Grab
Price reacts from the Order Block (purple zone)
Rejects and breaks down into the Fair Value Gap (FVG) zone near 1.33300
Targets liquidity resting below prior structure
🔺 Scenario 2: Order Block Respect + Long Continuation
OB holds, price flips bullish
Pushes above 1.35260 for bullish continuation
Final target near channel top @ 1.35920–1.36000 zone
Both scenarios are textbook Smart Money setups — based on how price reacts at this OB, we’ll get the direction.
🧱 3. Key Zones
🔵 Order Block: 1.3445 – 1.3526
🔴 Fair Value Gap (FVG): 1.3330 – 1.3283
🟢 Target (Bullish): 1.3600
🔻 Target (Bearish): 1.3280
⚖️ 4. Risk-Reward Potential
Whether you go long from the FVG or short from the OB, both have:
✅ Clean entries
✅ Clear invalidation zones
✅ Strong RRR potential (1:3 to 1:4+)
📌 5. Watchlist Note
💡 If price taps into the OB and shows weak momentum, prepare for shorts targeting the FVG
💡 If it holds the OB cleanly with bullish engulfing or BOS (break of structure), ride the long back to channel highs
💬 Call to Action:
📈 Add GBPUSD to your SMC sniper list this week
💬 Comment “OB or FVG? 🤔” if you're waiting to catch the bounce
📌 Save this post for Smart Money reference setups

XAUUSD 1H | Bearish Order Block Reaction + Liquidity Sweep🔻 XAUUSD 1-Hour Breakdown — May 14, 2025
Gold gave a strong supply rejection at a marked Order Block zone. This isn’t just a pullback — it’s a potential continuation setup targeting lower lows. Here’s what’s cooking:
🧩 1. Market Structure
Clean rejection from premium OB zone at ~$3,220
Massive bearish impulse candle right after sweeping demand zone liquidity
Price formed a lower low and is now forming a lower high
🛠 2. Key Confluences
🟪 Order Block: Solid rejection with no candle closes above
💧 Liquidity Sweep: Deep wick into OB zone → trapped breakout buyers
🔺 Strong High Protected: Market respects structure, suggesting continuation
🔻 Weak Low Targeted: Clean draw to imbalance & potential sweep zone near $3,116
🧠 3. Trade Setup
Entry: Rejection near $3,207–3,220 OB
SL: Above $3,229 (invalidates structure)
TP: First TP zone near $3,116, extended TP: $3,100
RRR: 1:4 to 1:6 setup depending on partials
⚠️ 4. Risk Management
Watch for NY session reversal attempts
Secure profits at first demand zone reaction
Consider trailing stop above last bearish engulfing candle
📌 Price respects structure. If bulls don’t step in quick, sellers will run the table. This is a classic SMC bearish continuation off OB + liquidity grab — don’t sleep on it!
💬 Type “🔻” if you're riding this short wave with us!
🎯 Follow @ChartNinjas88 for sniper SMC plays every day!

EURUSD 30min Smart Money Long | Order Block + Discount Entry⚡ EURUSD 30m Smart Money Long | May 9, 2025
We're spotting a strong potential reversal after price melts into a clearly defined Order Block deep in the discount zone. Momentum slows, wicks reject the lows, and we’re stacked for a bullish bounce.
🔍 KEY CONFLUENCES:
📉 Sharp selloff into 1.12204 support
🧱 Bullish Order Block holding with rejection wicks
🧠 Smart Money Entry Zone marked just above 1.1219
📐 Price below 50% Fib = Discounted premium RR
🚀 TP targeting imbalance fill near 1.13204
📊 Setup Specs:
Pair: EURUSD
Timeframe: 30 min
Entry: 1.12204
SL: ~1.12078
TP: ~1.13204
RR: Approx. 1:6+
💡 Smart Money Logic:
Big players often load longs in these deep discount zones, right before the crowd notices the shift. This zone is layered with protection: OB, liquidity sweep, and slowed momentum — textbook for a reversal.
📈 Chart Ninja Note:
"Don’t chase — wait for price to come to you… in the discount, at the OB."

USDCHF: Very Bearish Pattern 🇺🇸🇨🇭
I see a head and shoulders pattern, being formed after a retest
of a recently broken key level.
I think that the market will go down soon and reach
0.8763 / 0.8752 levels.
❤️Please, support my work with like, thank you!❤️

GBPAUD: Classic Bullish Pattern 🇬🇧🇦🇺
GBPAUD formed a classic bullish flag pattern on a daily.
A violation of its resistance line is a strong trend-following bullish signa.
With a high probability, the market will rise at least to 1.96185 resistance.
❤️Please, support my work with like, thank you!❤️

EURCHF: Breakout & Confirmation 🇪🇺🇨🇭
EURCHF leaves a clear bullish clue after a recent breakout of a key intraday/daily resistance.
Retesting the broken structure, the price formed a range on a 4H time frame.
Its resistance has been broken.
Growth will continue at least to 0.9499
❤️Please, support my work with like, thank you!❤️

USDCHF: Bearish Pattern Identified 🇺🇸🇨🇭
Looks like all the setups that I spotted today are bearish.
One more is on USDCHF.
I see a head & shoulders pattern on an hourly time frame
that was formed after a strong intraday resistance.
Bearish breakout of its neckline is an important sign of strength of the sellers.
I think that the pair can drop to 0.8503 level.
❤️Please, support my work with like, thank you!❤️

If It Looks and Acts like a Chicken, It's Probably a ChickenA foundational concept in "pure" price action trading that underlies all trading decisions is that price will never "exactly" repeat itself. What I mean by exactly is that
current and future price will never be 100% identical to past price. At first glance it may seem the same, but when boiled down to the lower time frames, you'll notice
that current price is ever so slightly, different from past price. This makes more sense from a philisophical point of view.
If the markets are a living breathing entity just like you and I, it makes sense that past price will never repeat itself to the perfect degree. Similiar to the way you
and I, as humans, will never be identical in terms of actions, thoughts and biological makeup when compared to past versions of ourselves. Now, if the price action
trader views the markets in this way, it can make a non-price action trader confused as to how a price action trader can profit from a chaotic entity such as the
market. Afterall, a price action trader solely uses price to analyze the future direction of price. Let me explain to you how.
We all know the phrase, "If it looks and acts like a Chicken, it's probably a Chicken". Meaning that if the characteristics of a chicken are there, well.... it's probably
a chicken. Infering that 100% confirmation that a chicken is in fact, a chicken, is not nessecary for a chicken to qualify as a chicken. It's the same in price action
trading. If your price analysis dictates that price will go up, even though there are some pieces of the puzzle missing in your analysis, your analysis qualifies as
legitimate analysis. Now don't get me wrong. Just because your analysis qualifies as legitimate analysis doesn't mean price will follow in suit. That's an entirely
different subject. The point I'm trying to get across in this post is simple.
Price Action analysis cannot be so rigorous that you must wait for a 100% replication of past price. Simply for the reason that past price will "never" identically
repeat itself. This pitfall of waiting for perfect replications of past price leads to the trader becoming overly conservative. Causing you to miss out on trades
that had sufficient analysis, but was missed out on due to the "misunderstanding" that past price repeats itself. So the next time your analysis states that price
should go up; don't let the inevitable nature of markets to never repeat itself stop you from entering that trade. Remember! If it looks and acts like a chicken,
it's probably a chicken.
I hope this helps!
Have a great day!
Ken

Understanding the Story of a Currency Pair
When trading price action, it's crucial that you understand the story of the currency pair you are trading.For what current price is doing is only valuable in the overall context of what a currency pair has been doing.Just like reading a book or watching a movie, watching it from the half-way point won't allow you to understand what's happening; for current dialogue only has meaning with a context.So here's 2 things you can do to know the story of a currency pair:
1.) Analyze new price everyday to build the story. Ask yourself, " is current price confirming your perspective of the direction of a currency pair?Or is current price showing signs of a changing story? 2.) Use multiple time frames.The higher and lower time frame's stories should compliment eachother.Ask yourself " is current price on the lower time frames confirming the story on the higher time frames?"
Moreover, understanding the story of a currency pair gives the trader an understanding of the tendancies of that pair.Each pair has very different characteristics.Just like how a music composer has tendancies when composing music.Each pair has identifiable, or rather, "trademark" tendancies.For example, the Eur/Usd pair tends to be very accurate in terms of price levels.So if there's a well repected trendline and you expect price to bounce off of it, it will do so with accuracy right down to the last decimal.Moreover the Gbp/Usd tends to have many pullbacks before an extended move in a direction takes off.Having this knowledge allows for great position building as well as the understanding that there are further opportunities to enter a trade even if you missed the initial entry.
In this way, understanding the story of a currency pair and keeping this story up to date, gives a trader a general sense of "unison" with that pair.Allowing them to notice slight changes in the over-arching trend and therefore have the ability to be one step ahead of the market at all times.
That's it! I hope this helps!
Have a great day guys!
Ken

How to Stay One Step Ahead of the MarketHey Guys!
As traders, we always want the sense of being one step ahead of the market. In other words, what's happening with current price should not be of consequence to your trading. It's just another bit of information that's
added into your analysis of what will happen next. Now the polar opposite of this situation is chasing the market. Where a trader is reacting to what price is doing currently. After years of trading, one thing I can state with confidence, is that if you're chasing the market and reacting to current price, you won't make it in trading in the long-term. I mean, you may get lucky from time to time, but ultimately you're luck will run out. So the question becomes how does a trader stay one step ahead of the market? At the basic level, if a trader can stop focusing on price "direction", and instead begin focusing how price travels from point A to B, they have a shot at being one step ahead of the market. Let me explain.
As you guys know, on the Eur/Jpy pair during the month of February 2022, I was consistently taking short trades as price pulled back to the 132.80 levels. Now this is even if price at the moment of entry was moving up. ( I wasn't focusing on price direction) Instead, I was focusing on "how" price moved from point A(on the chart) to point B.(on the chart) Initially, there was 1 minute strong long strength sparking the explosive move up however, there was even stronger 1h strong short strength confirmed on the lower time frames in the beginning of the 1st range. At this point I was already viewing this pair to be short biased,(I was one step ahead of the market) and even if price continued up, as long as there was no confirmation of further long strength I will continue entering short positions. I was able to confidently take multiple short entries because "how" price was moving from point A to point B was not indicative of a long market. Or like I always say, " The lower time frame's price action wasn't complimenting the higher time frames move up." Then finally, there was further 5 minute confirmation of strong short strength and price began its descent. However, if a trader at this point was basing their trades on "current price direction", they're likely to take long positions on this pullback for a possible next move up. A devasting outcome as you can see.
So if you always find yourself on the wrong side of the market, firstly, stop putting value onto current price direction. It is just a result of previous price action. Begin asking yourself, "What is the context of the current price direction".
Or even better, learn how to read price to know how price traveled from point A to point B and begin staying one step ahead market. For if you a can do this, perhaps you will have a shot at staying in this game for the long haul.
I'm sure you guys have questions! Don't hesitate to ask! I'll gladly help!
Have a great day guys!
Ken

Characteristics of Price Action TradingHey Guys!
I know price action trading can be somewhat a mysterious and confusing style of trading. So I just wanted to jot down the basic characteristics of price action trading to help clarify this ambiguous trading style.
#1 Price action trading only uses price action to make trading decisions. No indicators, fundamental analysis, intermarket analysis, etc... Just price alone will do.
#2 The Price action trader "Reads" naked price ( using candles, trendlines, price patterns, distinct ways that price itself fluctuates) to predict how much future long/short strength there is in a asset and makes trading decisions.
#3 To the price action trader, misanalysis is never the fault of price, fundamentals, or any other analysis method. The fault is always on the price action trader's misinterpretation of price.
#4 Price action trading techniques can be directly applied to any time frame, thus can be used for any style of trading. Long term/Swing/Day Trading. Moreover can be applied to any asset class.(though some techniques must be tweaked somewhat.)
#5 The price action trader does not require a logical understanding of "why" price moves in a given direction. They have the mentality that if it works, there is no reason or need to explain it.
#6 To the price action trader, current price is more valuable than past price in terms of analysis. So what happens closer to current price has more weight in the analysis process. Thus must watch current price and cannot just buy /sell and let a higher power take the wheel.
That's it! Hope this clarifies price action trading a little!
Have a great day guys!
Ken

Price Action Lesson: The Basics of How to Read Price Part 3Hey Guys!
As you guys know I aborted 2 short entries on the NZD/USD pair yesterday to minimize my losses.
In this lesson, I'll explain how I knew to abort the short entries early by reading 1 minute price action and thus minimize the loss.
Enjoy!
Have a great day!
Ken

Price Action Lesson: The Basics of How to Read Price Part 2Hey Guys!
As you guys know the current NZD/USD daily bias is short. Or in other words, price is likely to reach 0.6591 before reaching 0.6731.
So on my last post, I mentioned I took a short entry at 0.6722 with a stop loss at 0.6591 with its main target at 0.6591 for the time being.
In this Price action lesson, I just wanted to briefly explain how I read price in order to take the short entry yesterday. Moreover, why I was able to
take the short position "comfortably" even though price pulled back to 3 pips to the stop loss level.
That's it!
Have a great day guys!
Ken
Disclaimer: This is not Personal Financial Advice.

Price Action Trading ExplainedHey Guys!
Here's a simple explanation of Price Action Trading!
In its very essence, Price Action Trading is about letting price tell you where it's headed in the future. No indicators or fundamental analysis. Just price alone will do. But in order to know what price is telling you, you must first learn "how to read price". Think of this as a language. Just like how you're reading this post and understanding my intent through the English language. A price action trader must learn the "Language of Price" before interpreting what price is telling you in terms of where it's headed in the future.
Once the language of price is mastered, a price action trader simply reads what price is telling him/her in terms of the future direction of price and makes trading decision accordingly. So, if price is telling you that it will go up in the future, you buy (or abort depending on the situation). Sell, if that's what price is telling you, and most importantly stay out of the market when price is telling you there is no bias in future long or short strength.
Take this EUR/USD Short Trade that I'm currently holding positions in: If you follow my weekly forecasts you'll know that I took 2 short trades last year in which I still have 20% in at the current moment.
Initially, when I entered these trades last year, the weekly chart's price was telling me, " Yo Ken! There's more short strength than long strength between these 2 major pivots....Just Letting you know!" (shown on the chart.)
So in other words, "Price" was telling me that it will reach the Main Target Pivot Low before reaching the Main Stop Loss Pivot High.
So, as price pulled back to the Main Stop Loss Level, I listened to "Mr. Price" and took 2 Short Entries with the risk parameters shown on the chart. Then after entry, the lower time frames were consistently telling me, " Hey Ken!There's abundant short strength in this pair! I'm headin' do---wn! "So I took out 80% of the Position at the Main Target. (Just for discipline's sake) and kept 20% in. (Hey!Why not right?)
Then from November of 2021 to the current, on each bounce long, price was telling me yet again, " I'm still headed down Ken, Just letting you know.....", so I'm currently still holding 20% of the short position.
In this way, by learning the "Language of Price", a price action trader reads what price is telling him/her and makes trading decision accordingly. There is no concept of price being wrong or right.
Thus If price does not go in the expected direction. To a price action trader, it is not "the price" that is at fault; nor is it some other Technical or Fundamental element's fault. The blame is always on the misinterpretation of price by the price action trader. For in price action trading, "Price is always Right".
Have a great day guys!
Ken

Confirming Trends with the Lower Time Frames GBP/USD ExampleHey Guys!
As you guys know, I'm currently waiting for a pullback to the 1.3313 levels for a long entry on the GBP/USD.
In order to know whether or not I will get this pullback, I look to the lower time frames to see how much long strength or short strength there is.
Now in this case, I want price to come down to my entry level, thus am looking for signs of short term short strength on the lower time frames.
As you can see in the chart, during the initial move long, there were constant signs of long strength on the 1h chart with the trendline break out, then
immediate break back into the trendline. ( Immediate break back in means: the break out candle's close and the break back in candle's open is at the same price level)
Almost giving the "sense" of a "fake" break out.
Then at the peak of the long move, another 1h trendline had a break out, however no immediate break back in. Showing waning short term long strength. (A good thing for me!)
Then soon after, a 4h trendline was broken out with no immediate break back in, showing waning long strength on the 4h chart also.
Then to top it off, there was a 15m fake double bottom that formed igniting 15m short strength. ( I cannot go into detail about fake price patterns here. )
In this way, I use lower time frame break outs to confirm strength in either direction which by default, confirms which way price will go on the higher time horizons.
In this case, I used this method to confirm whether or not I will get the pullback to 1.3313 for a long entry however, this method can also be used to confirm trends.
For if a trend analysis says that the trend is long; the lower time frame's price action should move in a "long trend way".
Just a cool trick for you guys!
Have a great day!
Ken
Disclaimer: This is not Personal Financial Advice.

GBPJPY Sell zone 1st TP
Risk free zone
Close half
if it broke the zone did pull back you can open new tread but don't forget the MONEY MANAGEMENT

USD/SGD Long Position Buy Op
Daily/4Hr
Price has been in a downtrend but it is looking like we may have a reversal/breakout happening.
The 50MA has crossed over the 200MA on the 4hr and may be pulling back to the 200MA on the Daily.
Will be looking for my buy entry on the higher low/50MA on the 4hr chart and 1hr for candle confirmations.
Entry AREA 1.33360
SL 1.33008 (35Pips)
TP 1.35000 (163Pips) 1:4.66 Risk/Reward

EUR/USD Possible Short. Sell Op 4Hr Timeframe
Price has started a downtrend and is currently in consolidation on the 4Hr timeframe.
Shooting Star and Marubozo candle on 4Hr Resistance.
Looking to get in on the LH/4Hr resistance or the pullback to the 50MA on the 1Hr timeframe.
Entry 1.21200 AREA
SL 1.21860 (66 Pips) Use proper Risk Management!
TP 1.17500 1:5 Risk/Reward
DON'T FORGET TO TRAIL YOUR SL!!

USDCAD- DOWNTREND OPPORTUNITIESI marked important zones for trend and counter trend trades in USDCAD.
Waiting for entry reasons in 5 minutes timeframe.


NZDUSD Price ActionNZDUSD Is looking to fall this week following this recent price action. Price action is showing us price breaking out of a 3 touch structure, but what is important is how we broke out. This is important because price has broke out in the formation of an ascending channel. This current ascending channel it is currently in is crucial because it could be a prime example of how Price action fools typical support and resistance traders. The normal S/R flip would indicate a buy off of a retest of its previous high. Price action catches these traders on the wrong side of the market, and has the potential of having a huge bearish move this week to the bottom of its bigger structure. Best of Luck to my traders this week!
Follow for more price action ideas :)
