GBPCAD: Pullback After a Trap 🇬🇧🇨🇦
There is a high chance that GBPCAD will pull back
from the underlined support.
The price started to grow after a false violation of that and a confirmed bearish trap.
Goal - 1.8458
❤️Please, support my work with like, thank you!❤️
I am part of Trade Nation's Influencer program and receive a monthly fee for using their TradingView charts in my analysis.
Priceactionsignals

S&P500 INDEX (US500): More Growth Ahead
US500 broke and closed above a neckline of an ascending triangle
pattern on a daily time frame.
It is a strong bullish pattern that indicates a strong bullish interest.
With a high probability, buyers will push at least to 6124 resistance.
❤️Please, support my work with like, thank you!❤️

NZDJPY: Move Up Ahead! 🇳🇿🇯🇵
There is a high chance that NZDJPY will continue rising.
I see a strong intraday bullish confirmation after a confirmed
breakout of a key daily horizontal resistance.
Next key resistance is 0.875
❤️Please, support my work with like, thank you!❤️
I am part of Trade Nation's Influencer program and receive a monthly fee for using their TradingView charts in my analysis.

NZDJPY: Another Bearish YEN Pair 🇳🇿🇯🇵
One more YEN pair that looks bearish to me is NZDJPY.
I see 2 bearish price action confirmations after a test
of the underlined horizontal resistances:
the price broke a support line of a rising wedge pattern
and a neckline of a double top.
The price may drop now to 86.66 level.
❤️Please, support my work with like, thank you!❤️
I am part of Trade Nation's Influencer program and receive a monthly fee for using their TradingView charts in my analysis.

CADCHF: Pullback From Support 🇨🇦🇨🇭
There is a high chance to see a pullback from the underlined
daily horizontal support on CADCHF.
A formation of a high momentum bullish candle
after its test and a consolidation on an hourly time frame confirms
the strength of the buyers.
Goal - 0.595
❤️Please, support my work with like, thank you!❤️
I am part of Trade Nation's Influencer program and receive a monthly fee for using their TradingView charts in my analysis.

NZDJPY: Another Bullish Confirmation 🇳🇿🇯🇵
If you remember, I already posted a bullish outlook for NZDJPY on Friday.
This morning, I spotted one more intraday bullish confirmation.
I see a breakout of a resistance line of a bullish flag pattern on an hourly time frame.
I expect a bullish movement at least to 85.9 level soon.
❤️Please, support my work with like, thank you!❤️
I am part of Trade Nation's Influencer program and receive a monthly fee for using their TradingView charts in my analysis.

NZDJPY: Strong Bullish Signal 🇳🇿🇯🇵
I spotted a nice example of the application of SMC trading
with multiple time frame analysis on NZDJPY pair.
After a test of a significant daily demand zone,
first, we see a liquidity grab where the price went beyond
the underlined zone.
A consequent bullish imbalance and CHoCH confirm
a real strength of the buyers and indicate a highly probable
bullish continuation.
Next goal - 86.43
❤️Please, support my work with like, thank you!❤️
I am part of Trade Nation's Influencer program and receive a monthly fee for using their TradingView charts in my analysis.

USDCHF: Correctional Movement Ahead?! 🇺🇸🇨🇭
USDCHF may continue a correctional movement after
a release of the today's US CPI data.
A technical price action confirmation that I spotted is a
valid Change of Character CHoCH on an hourly time frame.
We can expect a bearish continuation to 0.8358
❤️Please, support my work with like, thank you!❤️
I am part of Trade Nation's Influencer program and receive a monthly fee for using their TradingView charts in my analysis.

NZDCHF: Classic Gap Trade 🇳🇿🇨🇭
On a today's live stream with my students we discussed
a gap up opening on NZDCHF.
I have a strong feeling that it is going to be filled tonight.
A double top pattern on an hourly time frame and its neckline
violation provide a strong bearish confirmation.
Goal - 0.492
❤️Please, support my work with like, thank you!❤️
I am part of Trade Nation's Influencer program and receive a monthly fee for using their TradingView charts in my analysis.

GBPAUD: 2 Strong Bearish Confirmations 🇬🇧🇦🇺
GBPAUD is in a very bearish price action after a test
of the underlined horizontal resistance.
The price formed an inverted cup and handle pattern
and violated its neckline and a support line of a rising
parallel channel on an hourly time frame.
Probabilities will be high to see a decline at least to 2.064 support.
❤️Please, support my work with like, thank you!❤️

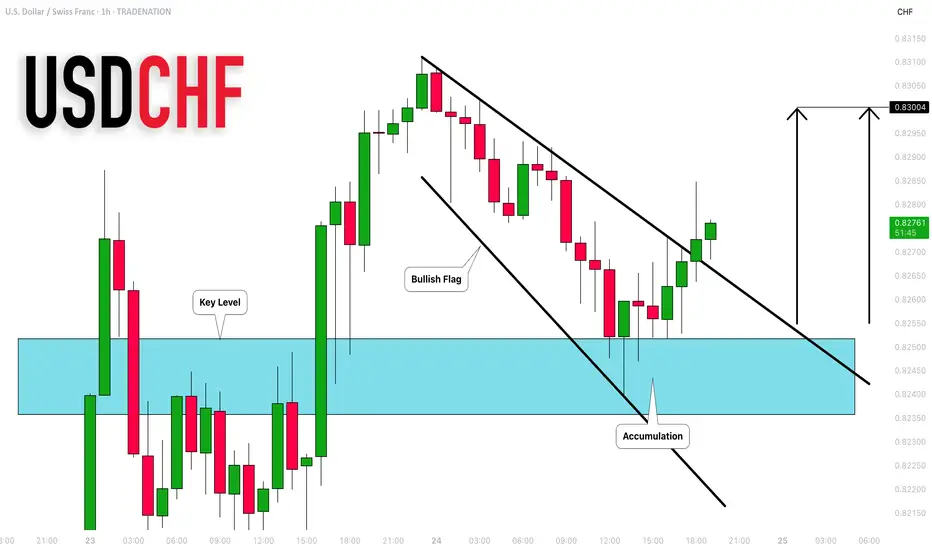
USDCHF: Very Bullish Price Action 🇺🇸🇨🇭
There is a high chance that USDCHF will go up from
the underlined blue support.
As a confirmation, I see a bullish breakout of a resistance line
of a bullish flag pattern on an hourly time frame.
Target - 0.83
❤️Please, support my work with like, thank you!❤️
I am part of Trade Nation's Influencer program and receive a monthly fee for using their TradingView charts in my analysis.
USDCHF: One More Bearish Wave Ahead?! 🇺🇸🇨🇭
It looks like USDCHF has successfully completed a consolidation
after quite an extended bearish rally.
A breakout of a support line of an ascending triangle pattern
on a 4H time frame provides a strong bearish confirmation.
We can expect a movement down at least to 0.81 level.
❤️Please, support my work with like, thank you!❤️
I am part of Trade Nation's Influencer program and receive a monthly fee for using their TradingView charts in my analysis.

USDCAD: Bullish Outlook & Pullback From Support 🇺🇸🇨🇦
There is a high chance that USDCAD will turn bullish after the market opening.
I spotted a strong bullish confirmation after a test of a key intraday/daily support.
A triple bottom formation and a breakout of its neckline provide a reliable
bullish signal.
Probability will be high that the price will bounce at least to 1.3676 level.
❤️Please, support my work with like, thank you!❤️

CHFJPY: Intraday Bullish Signal?! 🇨🇭🇯🇵
It looks like CHFJPY has completed a local correctional movement
after a formation of a strong bullish wave.
I see a violation of a resistance line of a falling wedge pattern as a confirmation.
Next goal - 175.72
❤️Please, support my work with like, thank you!❤️

AUDCAD: True Bullish Reversal?! 🇦🇺🇨🇦
AUDCAD formed a nice inverted head and shoulders pattern
after a test of a key historic support.
A bullish violation of its neckline with a strong bullish candle
provides a reliable confirmation.
I expect a correctional move at least to 0.8723
❤️Please, support my work with like, thank you!❤️

NZDJPY: Pullback From Support 🇳🇿🇯🇵
There is a high chance that NZDJPY will pull back from support.
As a confirmation, I see a double bottom pattern on an hourly time frame
and a breakout of its neckline.
Goals: 85.30 / 85.58
❤️Please, support my work with like, thank you!❤️
I am part of Trade Nation's Influencer program and receive a monthly fee for using their TradingView charts in my analysis.

EURCAD: Pullback Trade From Resistance 🇪🇺🇨🇦
EURCAD may drop from the strong daily resistance.
As a confirmation signal, I spotted a head and shoulders pattern
on that on an hourly time frame.
The price can fall at least to 1.552 support
❤️Please, support my work with like, thank you!❤️
I am part of Trade Nation's Influencer program and receive a monthly fee for using their TradingView charts in my analysis.

EURGBP: Bearish Outlook Explained 🇪🇺🇬🇧
A recent breakout of a minor daily support on EURGBP
is a reliable bearish signal.
It shows a mid-term dominance of the sellers.
I think that the price can drop at least to 0.831 support soon.
❤️Please, support my work with like, thank you!❤️
I am part of Trade Nation's Influencer program and receive a monthly fee for using their TradingView charts in my analysis.

NZDJPY: Bearish Movement Confirmed 🇳🇿🇯🇵
All Yen pairs look bearish after the early morning BoJ interest
rate decision and press conference.
NZDJPY formed an inverted cup & handle pattern on a 4H
after a test of a key daily resistance.
High momentum bearish candle indicates a strong bearish sentiment.
I think that the price may drop at least to 86.2 level.
❤️Please, support my work with like, thank you!❤️
I am part of Trade Nation's Influencer program and receive a monthly fee for using their TradingView charts in my analysis.

EURAUD: Pullback From Support 🇪🇺 🇦🇺
There is a high chance to see a pullback from the underlined support on EURAUD.
As a confirmation, I see a bullish breakout of a resistance line of a falling
wedge pattern on an hourly.
The price may touch at least 1.71575
❤️Please, support my work with like, thank you!❤️

AUDCHF: Strong Bullish Continuation 🇦🇺🇨🇭
It looks to me that AUDCHF will continue rising.
A confirmed breakout of a neckline of a cup & handle pattern
on a 4H time frame provides a strong bullish signal.
The price will likely reach at least 0.5627 level soon.
❤️Please, support my work with like, thank you!❤️
I am part of Trade Nation's Influencer program and receive a monthly fee for using their TradingView charts in my analysis.

AUDCHF: Strong Bullish Chart Pattern 🇦🇺🇨🇭
AUDCHF formed an inverted head & shoulders pattern on a 4h time frame
after a test of a key intraday/daily horizontal support.
After a deep retest of a broken neckline, we finally see a positive bullish reaction.
I think that the market will rise and reach 0.56 level soon.
❤️Please, support my work with like, thank you!❤️
I am part of Trade Nation's Influencer program and receive a monthly fee for using their TradingView charts in my analysis.

Master Price Action Trading With Expedia Group StockExpedia Group NASDAQ:EXPE stock is dropping as expected. This decline highlights the importance of understanding supply and demand imbalances, particularly on larger timeframes like the monthly chart, which many traders often overlook. Ignoring these imbalances can lead to costly mistakes, as evidenced by the current bearish price action in $EXPE.
The strong imbalance at $195 per share is helping the stock price to drop as expected. We can see bearish price action being formed with room to drop much lower. There is room to reach the latest bullish impulse in the monthly timeframe.
