XAUUSD UPDATE INTRADAY OPPERTUNITYgold is ranging the between major psychological levels so we can ex [ect the bullish momentum we have not seen the major impact on the gold after the NFP as well so we have to break the main levels that we can decide we the trend will be start
Priceactionstrategy

FLM/USDT Analysis. Good opportunity s comming.On the FLM / TETHER chart on the daily timeframe we see the formed triangle.
The main areas of support and resistance are also marked. The red line shows us the Point Of Control, this is a fair price area.
We see nice point where come together POC+Daily TL. Good opportunity to take a long.
When we switch to a lower time frame, the situation is clearer.
Now you need to find out, on lower time frames, what's going on inside the candles and decide whether there is a good opportunity to buy or sell.
I will discuss all the essentials with my students today and based on our Price action strategy we will look for a suitable place to enter.
Of course, all the conditions of our strategy must be met in order to increase the probability of a successful trade.

Ethereum is fighting hard now. Price action analysis.Ethereum is fighting on Pivot point support and level 0.618 of Fibonacci retracement.
The main areas of support and resistance are also marked. The red line shows us the Point Of Control, this is a fair price area.
When we switch to a lower time frame, the situation is clearer.
Now you need to find out, on lower time frames, what's going on inside the candles and decide whether there is a good opportunity to buy or sell.
I will discuss all the essentials with my students today and based on our Price action strategy we will look for a suitable place to enter.
Of course, all the conditions of our strategy must be met in order to increase the probability of a successful trade.

BTC SHORT IDEANeeds a great retracement. Great R/R ratio. This is a price action trade. Trade at your own risk.

Solana with nice Price actionOn the SOL / TETHER chart on the daily timeframe we see the formed triangle.
The main areas of support and resistance are also marked. The red line shows us the Point Of Control, this is a fair price area.
When we switch to a lower time frame, the situation is clearer, as we see in graph H1.
Now you need to find out, on lower time frames, what's going on inside the candles and decide whether there is a good opportunity to buy or sell.
I will discuss all the essentials with my students today and based on our Price action strategy we will look for a suitable place to enter.
Of course, all the conditions of our strategy must be met in order to increase the probability of a successful trade.

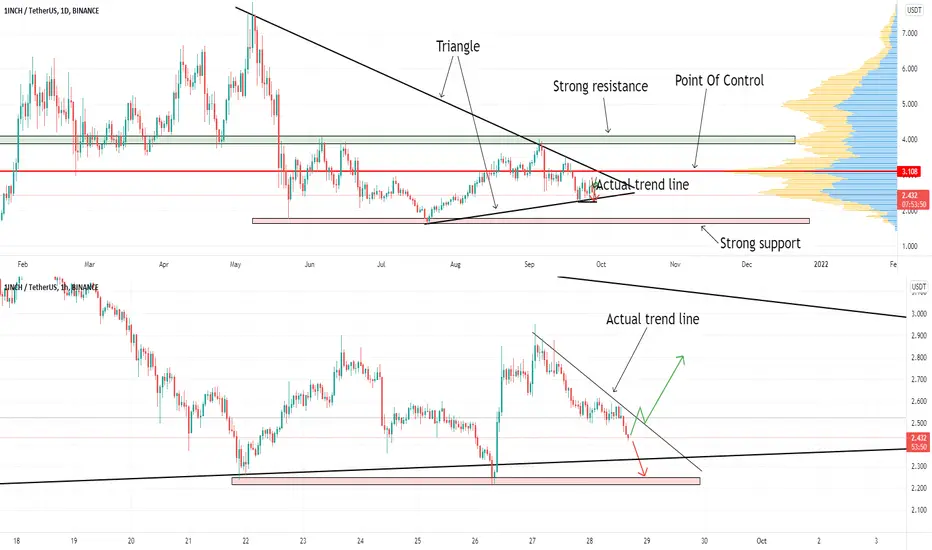
1INCH / TETHER analysis. Will we Short or Long??On the 1INCH / TETHER chart on the daily timeframe we see the formed triangle.
The main areas of support and resistance are also marked. The red line shows us the Point Of Control, this is a fair price area.
When we switch to a lower time frame, the situation is clearer, as we see in graph H1.
Now you need to find out, on lower time frames, what's going on inside the candles and decide whether there is a good opportunity to buy or sell.
I will discuss all the essentials with my students today and based on our Price action strategy we will look for a suitable place to enter.
Of course, all the conditions of our strategy must be met in order to increase the probability of a successful trade.
LTCUSD: Price action with bullish smell.We see a symmetrical triangle on Litecoin. The price responds beautifully to the S / R zone and together with the lower edge of the triangle creates a suitable place for speculation for the growth of the LTC / USD pair.
Alex, UCT team wishes you nice trading.

EURCHF Short• Broke out of a big channel – 90% chance of going to the bottom
• Downward trend creating a lower high
• Came back to retest the channel’s support
• Created a rising wedge which is now broken


NZDCAD Price ActionPrice action for NZDCAD is showing a very clear sign that price may be coming down. Higher Time Frames show price is in an ascending structure, and we have broke out of this bigger structure in a smaller ascending 1-2-3 structure. If you pay attention to the smaller time frames you could clearly see price is reaching this smaller structure's third touch in a consolidated manner. Stacking these multiple confluences, you could look for clear possible shorts near any third touch rejections, or take a short play on price's first impulse + Continuation Flag

Update GBP/CHF Quick Short RecapWasn't really looking to go short until I saw the close on the daily chart last night just before London by a few hrs. Interesting, though to see how one feed from Oanda shows something entirely different than another feed. Not a bad idea to use two different feeds to get some confirmation.
Trade well!

An Introduction To Trading Inside Bar SignalsToday’s lesson is an introduction to the inside bar signal and how to trade it. It’s really one of my favorite patterns to trade, especially on the daily chart time frame. Why, you ask?
It’s simple. The inside bar pattern shows a pause or indecision in the market, and depending on the surrounding price context it formed within, this provides us with an extremely valuable clue about what a market is about to do next.
The inside bar is yet another “tool” in your price action toolbox that will add to your trading strategy which when mastered will help improve your chances of long-term trading success.
Let’s get started with some introductory concepts and theory on inside bars…
What is An Inside Bar?
An inside bar pattern is a multi-bar pattern that consists of a “mother bar” which is the first bar in the pattern, followed by the inside bar. An inside bar pattern can sometimes have multiple inside bars within the same mother bar.
Here is what standard inside bars look like:
As you can see by the image below, inside bars can form exactly in the middle of the mother bar or close to either the high or low, there is not an EXACT way they have to look, just as long as they are contained within high to low distance of the mother bar
4 Variations of Standard Inside Bars
1. Double (multi) inside bar
The “double inside bar” consists of two inside bars within the structure of the mother bar. They are pretty common and often times you will even see 3, 4 or sometimes (rarer) even more inside bars within the same mother bar structure. These patterns signify a prolonged period of indecision in the market and they can come before very powerful breakout moves…
2. Coiling Inside Bars
Coiling inside bar patterns occur when 2 or more inside bars are “coiling” up tighter and tighter like a spring, within one another. Pay special attention when you see these because they mean the market is contracting and just like a spring wound up tighter and tighter, eventually it’s going to “release” and explode into a powerful move (in many cases).
3. Fakey Pattern (inside bar false-break )
The fakey trading pattern is very important in regards to inside bars because there is an inside bar pattern within a fakey. As you can see below, a fakey is actually a false break out from an inside bar pattern. It’s literally where price initially breaks one way from an inside bar pattern, but then quickly reverses, sucking everyone out who was wrong and then charging back the other direction. Obviously, these are giving us VERY intelligent clues as to the next potential direction in price.
4. Inside Bar Pin Bar Combo Pattern
As we all know, pin bars are one of the best price patterns you can trade and when it’s when you get a pin bar that is also an inside bar, that you have an inside bar pin bar combo pattern.
When you combine a pin bar into an inside bar, you are getting both a “wind-up” that is going to be released and a pin bar with a tail / shadow that indicates the next potential direction of the market. Hence, an inside bar is not just a pause in the market, it’s a pause with an extra piece of confluence behind it, and as a result, a more powerful price action signal.
Trading Inside Bar Patterns
There are essentially two main ways we can look to trade inside bars, as with most other patterns; as a continuation signal or as a reversal pattern.
Now, I prefer to trade them as continuation signals in trending markets on the daily chart, because that’s the easiest way to trade them quite frankly. However, inside bars CAN indeed be very powerful at major support and resistance levels as reversals. Let’s look at some examples:
1. Trading Inside Bars as Continuation Move s
The “classic” way to trade an inside bar pattern, and the way that I love trading them the most, is within a trending market, as a continuation move.
An inside bar is much easier to take in a trending market because the odds are already in your favor for trading with the trend. The inside bar will many times lead to a breakout or continuation in-line with the existing trend direction. They can provide a good structure to try to pyramid your trade into a huge win.
Tip : Avoid trading inside bars at major levels until the level has cleared, because many times such inside bars will create a false break at the major level.
2. Trading Inside Bars as “Stall Patterns” / Reversals
Sometimes, you can trade an inside bar as a reversal / stall pattern where price “stalls” out at a level and that leads to a reversal back the other direction.
In the chart below, we can see an example of a good inside bar reversal signal. Notice that the inside bar formed at a key chart level, indicating the market was hesitating and “unsure” if it wanted to move any higher. We can see a strong downside move occurred as price broke down past the inside bar’s mother bar low..
Please note that trading inside bars as reversal patterns should ONLY be tried after you have successfully mastered trading them in-line with the daily chart trend as continuation / breakout plays, as we discussed above.
Special Inside Bar Trading Tip s
Here are some of my tips and tricks when trading inside bars. These are things that I learned over the years that will improve your chances of success when trading this pattern:
1. Tighter inside bar patterns and coiling inside bar patterns often lead to explosive large break out moves. This is because of the “stored energy” that took place as the market “coiled”, that energy typically gets released in the form of a strong breakout move…
2. Patterns containing smaller inside bar patterns allow tighter stop losses and great risk reward, these are the ideal candidates.
3. Be wary of patterns with both very large mother bars and large inside bars, these can often be difficult to trade due to lots of false signals and they make it more difficult to manage risk.
4. My favorite 2 patterns are – Fakey signals and – Inside bar pin bar combos.
5. We must learn to filter inside bars because the one bad thing about them is that a lot of them form across all time frames. However, with proper training and experience on the charts, you will learn to differentiate.
CONCLUSION
This was a basic introduction to the inside bar signal and how I trade it, I cover this pattern and much more in my advanced price action trading courses. Upon joining, some of what you will learn is:
1. More inside bar variations and how to trade them.
2. More example charts.
3. Members trading discussion forum, including inside bar discussion
4. Daily members on-going daily and weekly market commentary where we discuss potential inside bar trade setups as they form.
5. Members trading videos and articles library that includes more in-depth inside bar trading training.
6. Email coaching & Support line.
7. On-going updates for free
I hope you found today’s lesson helpful and inspiring. Inside bars are truly one of the most interesting and powerful price action signals so I hope you enjoyed learning about them and that you’ll continue to do so.
Please Leave A Comment Below With Your Thoughts On This Lesson…
If You Have Any Questions, You can drop your question as comment or message me privately.

BTCUSDT 4hPossible routes and areas of support and resistance
The index of fear and greed is on 74 and greed


NZDCHF BIG SELL-DivergenceNZDCHF is expected to fall to below previous low (1.272fib ext) after divergence
was identified on the 4hr chart at 0.618 fib retracement of previous high

STELLAR: Nice Long setup.Stellar has a nice free way up.
Distribution areas act like magnets and the price likes to return to them. The current trend line is pointing up, so our next goals are the price area at the top of the chart.
More information about this trade will be shared privately with our students.

BTC Support & Resistance Areas in Price ActionThese areas are important for the short term and should not be missed

CAKEUSDT Analysis: We are looking for new fair price.On the currency pair CAKE / USDT we see how the price leaves the current fair value around level POC 15.8
The price jumps nicely up the trend line.
In addition, the fundamentals are also positive.
The only thing that could bring the price down now is the unexpected strong fall of Bitcoin.
Management and commenting on the trade will be shared with our students again.
Happy trading wishes Team UCT.

AUD/NZD - Will it hit the 62??In this vid I point out that we could see a breach of the most relevant low at some point, which is quite near the 62% retracement area of the larger timeframe parent structure. It's interesting that the low and the 62% area are about 20 pips apart, which seem to meet the pip grade concept that ICT so eloquently fleshed out.

American stocks KO
Coca-Cola stocks
In these stocks, there is a long-term uptrend in the weekly time
In daily time, we see that he twice attacked the $ 57 range and could not cross that range
In time h1, if it is seen that it is approaching its resistance in the range of $ 57 again, we will buy it because the probability of breaking the resistance is high and it can go up to the range of $ 60.
SL = 55.83

AUDUSD: We expect another decline!The EMA 200 Daily marks a down trend.
At the last candle, the bottom line of the triangle was broken.
Now the fall in prices has stopped the S / R zone from 21th Jul '21
We expect another decline to the Pivot S2 support level.

ChainLink attacks $ 30! LINK/USD analysis. We see how the price bounced off the trend line upwards. In addition, it bounced off the strong level of Weekly Pivot point!
The EMA 200 Daily stands for our bull market. We're now heading for the $ 30 price.
At this level, there is a round number of 30, which is a psychological boundary, and in addition, there is another Pivot Point R1.
We are preparing for LONG with our students.
Happy trading!

