Priceactionstrategy


Bought of Gold; U.S. Dollar weakens!!!Gold show in H4 a momentum o change of trend with a possible bought in this zone!!!
Notice that Gold it's into this simetric triangle in Daily chart adn we could see a good opportunity or long position in Gold!!!
Details:
1. Position: Long
2. Price Entry: $1,885 USD
3. Stop Loss: $1,878 USD
4. Take Profit: $1,922 USD


Australian Dollar/Yen Japanese: Bearish ABCD pattern!!!In this analysis, we see in live a good opportunity to short AUD/JPY.
We see in the important key zone on the yellow zone, and most probable it's that AUD/JPY make correction
Now, the H4 timeframe is the key, becuase we see a bearish candlestick that show that the price it's need a several correction. So, I see a short position in AUD/JPY with a opportunity to find down 110 pips. Remember, we are in the key manipulation and I know this pattern, so beware putting long position in this par.
Now, in H1 we see a bearish ABCD pattern, as we see in H4 better, that selected that the par need a correction and we se a fail of higher, we see right now higher low in H1 timeframe.
So, technically, we see that AUD/USD it's into this correction too, if we see in the AUD/USD a good position to shorting, maybe it's a good idea. At the moment, as I loss 22 pips, I have 5.28% free to use using my risk management. My own risk management is 7.50%
So guys, this is the details:
a) Open a short position in the market price:
b) Stop Loss: $76.93 JPY (45 pips)
C) Target Profit: $75.37 JPY (110 pips)
Good luck in this short position!!!

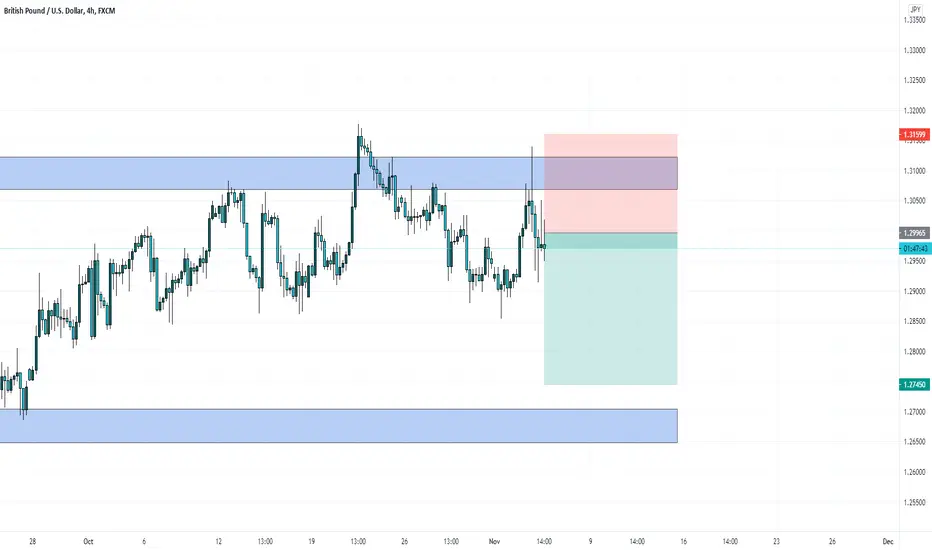
GBP PAIRS BIAS AND PROJECTION FOR THIS WEEKMoving average 50, I look for momentum from the higher time frames daily and 4 hrs because I'm an intra-day trader. The main thing I look out for is:
1. Is price above/below on the 50 MA on the 4 hr TF
2. Is price about to change direction from the current swing on the 4hr chart (I use a trend line for the swing on the 4 hr chart then go to the 1 hr chart for a break of market structure)
3. Did price break structure on the 1hr chart and is it above the 5 moving average
4. Enter on the retest, using the 1 hr or 15 mins TF
5. Take profit the previous swing on the 4hr chart, stop loss below previous structure (previous high or low depending on the trend). When placing stop loss for this strategy, if I'm using the 15mins or 1 hr for entry the previous structure must be below/above the 50 moving average, that's identified as the area as value. Therefore if you lose the trade then you know that your analysis was wrong at that time. CHEERS!


TATAMOTORS - Near Imp levelsTATAMOTORS - Near Imp levels
It has been trading in a narrow range for the past many weeks.
And Previous price action looks quite good, hence holding 124 - 127 levels, which can take stock towards 190- 200 levels.
Trade type: positional support trade
Trade at your own risk.

Updates: Bitcoin Cash show change of trend!!!In H1 we see that Bitcoin Cash turn bullish!!!
In H4 timframe we see that expectative is so bullish!!!
Waoh, we see a good bought opportunity in this par!!!
So, I put a buy order limit at $248 USD with a SL at $242 USD.

AUDCHF New Price ActionPreviously I had made an analysis of this pair looking for shorts near a three touch structure. However that structure has now been broken and has now made a new reversal ascending channel. It is important to not that when you have a structure where the top and bottom trend-lines are not parallel, if there was to be a break to the upside, based off my own backtesting results, we tend to make the top trend-line parallel to the bottom line. This in fact, has happened in this piece of price action. Here we have a break of a three touch structure however it is important to note that is is how we react to this area of value, and in this scenario we could potentially have a fake breakout, with a continuation flag to the downside. Lastly due to Presidential election News, I suggest protecting as much capital as you can and trade with caution.
Follow for more Price Action analysis !

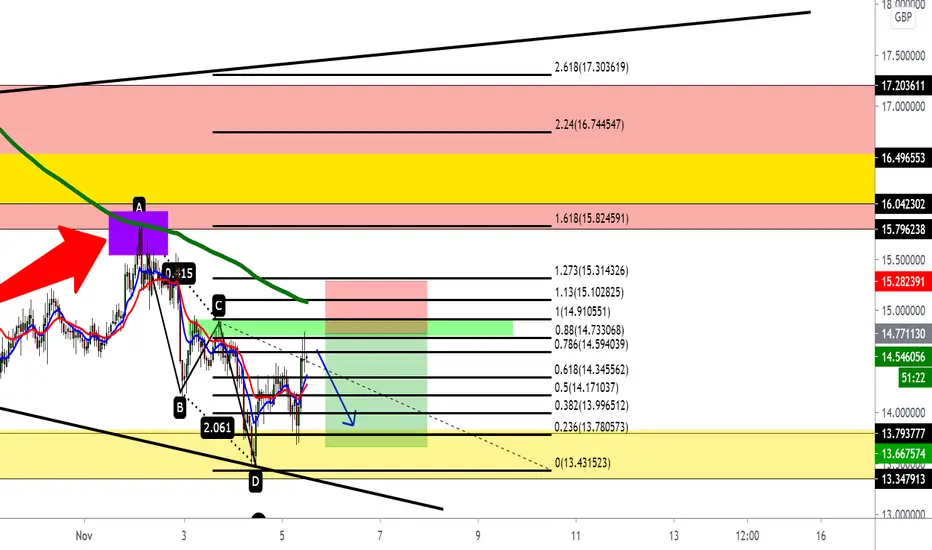
Neo formed ABCD bullish pattern!!!So, in H1 timeframe. NEO forme a bullish pattern, but we can see continue drop in the price!!!
But, we will need to take a perspective that in the purple quarer that I mark, NEO touch the EMA 200 and in any moment NEO could to change the trend and we can to be cautelous when the price touch the EMA 200 and we can see a possible change o momentum of the trend.
It's so interesting.
But right now, we nee to confirm the 0.618% as posible continuation o the bearish trend but limited!!! So, my target proti will be $13,67 USD and my price entry it's around of $14.79 USD with a SL at $!5.28 USD. So, we would need to take this perspective.
So, I do not entry in H1 timeframe until we see any bearish pattern in 30 minutes. That it's my key to trade this par!!!
So, the trade it's very good, but we will need to be cautelous and it's very possible that NEO make a little correction and I hope any change o trend!!!
So, the most is to hope that NEO make a coirmation on this green zone to entry in the little short position of just exactly $1 dollar drop in NEO.
Bitcoin Cash show a bought opportunity!!!Hello traders, As many traders commented the idea on Bitcoin Cash, well, I see that Bitcoin Cash is support in the key support and we see another bought opportunity trade in this strategy called supply and demand. Also, in the previously technical analysis, I mentioend that Bitcoi Cash is formed a double top and it's completely formed and my prediciton was very right in the exact target $240 USD. Remember that I trade Ethereum and I hope a Bitcoin entry in long toward the $17,000 USD. Now, in Bitcoin Cash we see another interesting opportunity in this trade. I hope that Bitcoin Cash in H4 formed a species of double top to validate this yellow zone and this support key with a confirmation o price action in H1 timeframe. We hope that situation or Bitcoin Cash.
And also as in the pass we see a double top, I draw a simetric triangle in Daily becuase in weekly I remember that I make a technical analysis that we can to see bought on the 0.618% o Fibonacci in weekly timeframe for Bitcoin Cash.
We hope that this opportunity get profits and we hope an entry!!!
I add my previously technical analysis on Bitcoin Cash for you!!!


Daily chart show a bought signal on Ethereum!!!Ethereum in Daily show us a good signal to buy Ethereum approximately between $380-$383.
As we see in Daily, Ethereum is into this bearish channel, but the expectative show that Ethereum in Daily using the price action is prepare for the next massive bullish movement!!! We see a bullish hammer, that mean that investor bought Ethereum!!! We could see that Ethereum is prepare it.
Now, in weekly timeframe we see that Ethereum is formed a next bullish movement. In weekly is bullish and we hope that Ethereum go up!!!
So, I following the Daily chart and I have my position at $380 USD as my buyr oder limit with a SL at $367 USD and my target profit will be $418 USD.
So, Ethereum show a good trade between this and the next week.


Euro/Australian Dollar: Possible continuation of the channel!!!My expectative for Euro/Australian Dollar is bullish, because the par formed a bullish channel and that could mean a possible bought on this par. Also, it's interesting what I see in this par. It's so interesting to know it. So, at the moment, I can't to say that we're to up, becuase another possibility is that Euro/Australian Dollar show a bearish pressure.
So, beware to trade, it's not reccomend until we broke down the $1.6485 AUD to short or $1.6538 AUD to entry in long position. So, we have these option if we see any break up or break down.
Now, more interesting is in Daily that the Fibonacci show a bought for long positon in the 0.618% of Fibonacci. But, we would awaiting that Euro/Australian Dollar make this break up or brea down. So, my expectative is bullish, but I need a good confirmation to entry in this par to trade.
We hope this opportunity!!!
So, please put 2 alarm alert in the $1.6450 AUD to short position and $1.6538 AUD to long position. You can to use any lines as I show you!!!
I will going to updated more this par, just be patience and remember, knowing the price action strategy!!!

Bitcoin Cash could formed a double top!!! AlertBitcoin Cash show a strategic os supply and demand and so, we see that the price is turn bearish.
In Daily, we supposted that Bitcoin Cash it´s can be to retest the $240 USD to then, entry in short position in the $257 USD. Also that Bitcoin Cash could want to retest the key support line mark in blue and we would need to hope 2 thing: the closed up of the Daily candlestick today and then, we would need to hope in H4 a validation for the entry in short position toward the $240 USD.
Now, in H4 we see a possible formation of double top, it's so sorry that I can't to make a technical analysis on Bitcoin Cash, but If I did this analysis, I would entry in the $268 USD toward the $256 USD, in that point could be my target. But, right now, we see a good opportunity for short position. So, we would need to hope and be patience, I can't entry right now if Bitcoin Cash going to up a little to then, to have the possibility to form a tripple top, that could be another good point to take in noticed that and be cautelous with our trade quality, just I hope that. So, also that in H4 we see a bearish rising wedge and that could be an alarm that the price is weakness the boughts force.
So, pay attention on this analysis and be patience to give us our short entry!!!


