Simson Cartoon Prediction About BitcoinBINANCE:BTCUSDT
Hi , Trader's .. Most you Aware about simson's Cartoon Prediction About Cryptocoin's
Simson series already predicted About world War's , Pandemic like Covid , World economy
USA presidential election and much more , most of prediction's came true
simson also predict about future of cryptocurrency many year's back
in there prediction they told world about digital currency , blockchain system and much more
they predicted that in 2025 bitcoin will reach 100k$
if we study the bitcoin Trading cycle , bitcoin is on major resistance line of monthly resistance
After breakout from this level bitcoin can again become bullish and it will have big area to play with
After every two year's of downfall bitcoin price surge minimum 4x
So according to this theory Price of btc now at 27000$ , so 4x would be approx 100k$
Conclusion : Prediction's are based on speculation's , nothing is 100% true , For better understandng alway's do technical and fundamental analysis both , Do trade with proper risk management
❤️ Please, support my work with follow ,share and like, thank you! ❤️
Priceactiontrading

CHFJPY: Classic Bearish Setup 🇨🇭🇯🇵
CHFJPY has nicely respected a confluence zone based on a horizontal 4H resistance and a 0.5 retracement of the last bearish impulse.
The price formed a double top pattern on that and broke its neckline.
Probabilities will be high that the pair will drop lower soon.
Goals: 141.172 / 140.363
❤️Please, support my work with like, thank you!❤️

USD/CAD LONG ENTRYHey Guys!
I just took a long entry at 1.3732 with a stop loss at 1.3627 and the main target at 1.3976.
In this video I review the reason for the entry as well as how I plan to manage this trade.
That's it! I'll keep you guys updated!
Have a great day!
Ken

Key Levels and US Market Review for the Asian session open 24/03European markets fought back up off lows after and earlier selloff while the US managed to end with minor gains led by Tech shares. Again, banking concerns weighed on the markets which capped bullishness for the session as the USD continued to move lower leading to a rally in Gold and Copper. For me, major US and European Indexes are looking very heavy and teetering on a selloff. Whether the selloff sees new major lows or a retest of previous lows, is still yet to be seen.
Asian markets will open weaker with the ASX200 expected down 40 points, HSI to open down 180 and the Nikkei down 40/50 points on open.
I remain of the view that sticky inflation is the big issue but it is now a balancing act for the Fed with the concerns for the Regional US Banks leading many to expect an interest rate pause.
A review of the price action from the European session and the US session where I look at some key levels to watch and the price action setups I expect to see play out on the major markets below.
Markets covered :-
DOW
Nasdaq
DAX
FTSE
ASX200
Hang Seng
USD Index
Gold
Oil
Copper

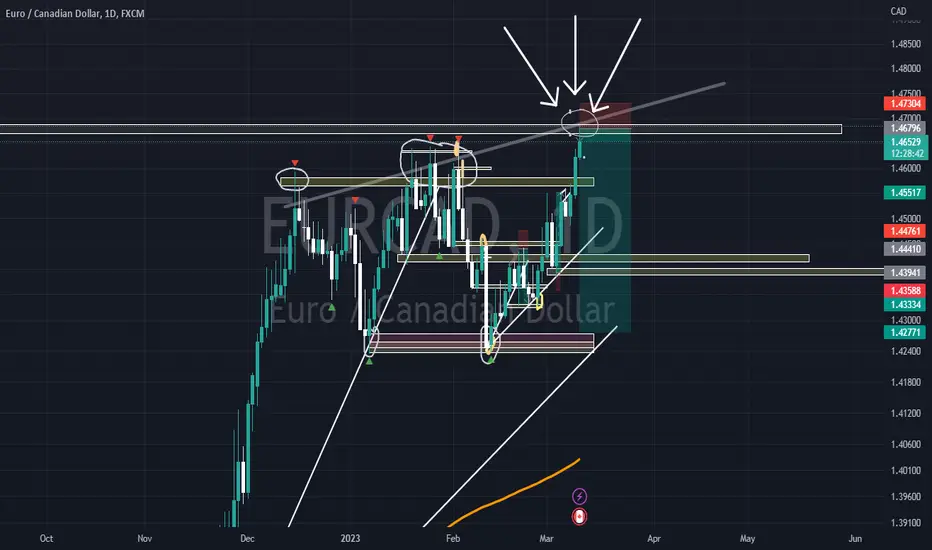
EURCAD: Time to Grow! 🇪🇺🇨🇦
Update for my Friday's post on EURCAD.
The price has perfectly respected a horizontal key level on a daily:
after a formation of a double bottom pattern on 4H, its neckline was successfully broken.
Now, a bullish continuation is expected.
Targets: 1.469 / 1.4735
❤️Please, support my work with like, thank you!❤️

Gold Moving Towards 4H targetGold is moving very sharply towards our 4H target. Smart Money Concept is very Powerful. Always do Multi timeframe analysis to improve Accuracy.

EURCAD: Top-Down Analysis & Trading Plan 🇪🇺🇨🇦
EURCAD is approaching a peculiar horizontal demand zone.
The price formed a doji candle, testing that on a daily.
Analyzing a 4H, I spotted a double bottom with a higher low.
1.458 - 1.462 is its neckline.
If the price breaks and closes above that on 4H, I will expect a bullish movement.
Goals will be 1.469 / 1.473.
If the price sets a new low though, the setup will become invalid.
❤️Please, support my work with like, thank you!❤️

EURCHF: Trend-Following Setup 🇪🇺🇨🇦
EURCHF is approaching a confluence zone based on a horizontal supply area
and 618 retracement of the last bearish impulse.
The price formed a head & shoulders pattern, testing that.
Its neckline was broken then.
I expect a bearish move to 0.9732
❤️Please, support my work with like, thank you!❤️

NZDJPY: Pullback From Key Level 🇳🇿🇯🇵
NZDJPY formed a cute double bottom pattern on a solid support on 1H time frame.
Its neckline has just been broken.
I expect a pullback to 83.24

This is it people !!!. EURCAD +4OO pips sell offAs you all know, this analysis has been done time and time without number right here on this channel and every single time, price keeps delivering massive profits on EURCAD and today is any different !.
Our Head and Shoulders pattern got invalidated but that doesn't mean our sell Bias is invalid.
New Signal Alert 🚨
EC
PAIR: EURCAD (EURO/CANADIAN DOLLAR)
SIDE: SELL (SELL LIMIT)
ENTRY: 1.4685
QP (Quick Profit): 1.46OO (85 pips)
TP 1: 1.4385 (3OO pips)
TP 2: Open
STOP LOSS: 1.4735 (50 pips)/1.4785 (100 pips)
Standard 3:1 RRR
The larger stop is to secure your trade in the case of hunting and liq sweep.
Apply proper risk and money management & do not over leverage your account.
Romans 8:25 📜📜
1O.03.23
EURCHF: Your Trading Plan For Today 🇪🇺🇨🇭
EURCHF is currently consolidating.
The pair is trading within a wide intraday trading range.
Currently, the price is approaching its lower boundary.
To buy the pair with a confirmation, watch a double bottom pattern.
0.994 - 0.9943 is its neckline.
Wait for an hourly candle close above that,
buy aggressively or on a retest then.
Target will be 0.996
If the price sets a new lower low, the setup will be invalid.
❤️Please, support my work with like, thank you!❤️

Micron Technology: Short Under 57$I'm planning a short trade on Micron ( NASDAQ:MU ) for 1 week.
The idea after the first "signal" obtained last monday was to see a retraicemente and then a new trigger. Better to trade beyond 57$.
Then today I have one of my fovourite trigger, thanks @ArduinoSchenato
I'll buy some Turbo24 short certificates by IG.com. Target is 53$.
---
ITA
Ho pianificato il un trade short su Micron già da una settimana.
L'idea dopo un primo segnale avvenuto lo scorso lunedì era proprio quella di vedere un recupero e un nuovo segnale, meglio se con chiusura sotto i 57$.
Oggi quindi il prezzo mostra quanto avevo pianificato con uno dei migliori trigger che uso sull'azionario. Thanks @ArduinoSchenato .
Domani quindi potrei tradare short questo titolo, attraverso l'acquisto di certificati Turbo24 di IG.com. L'oiettivo è la zona 53$.

AUDNZD: Bearish Outlook Explained 🇦🇺🇳🇿
AUDNZD is testing a wide daily horizontal supply area.
The price formed a double top pattern, approaching that on an hourly time frame
and broke its neckline with a high momentum bearish candle.
I expect a retracement to 1.0848 / 1.0828
❤️Please, support my work with like, thank you!❤️

NZDCAD: Bullish Outlook Explained 🇳🇿🇨🇦
NZDCAD is taking off from a key horizontal support.
The price formed a double bottom on that and broke its neckline then.
I expect a bullish continuation to 0.851 / 0.854
❤️Please, support my work with like, thank you!❤️

Learn Best Price Action Pattern For Trend-Following Trading 📚
In this educational articles, I will teach you the best price action patterns for Trend-Following Trading.
📍Ascending & Descending Triangles
The ascending triangle will be considered to be a trend-following pattern if the impulse leg preceding the formation of the pattern is bullish.
The pattern consist of 2 main elements:
a horizontal neckline based on the equal highs,
a rising trend line based on the higher lows.
❗️The trigger is a bullish breakout of a neckline of the pattern and candle close above.
📈The position is opened on a retest.
🔴Stop loss is lying at least below the level of the last higher low.
🎯Take profit is the next historical resistance.
——————
📍The descending triangle will be considered to be a trend-following pattern if the impulse leg preceding the formation of the pattern is bearish.
The pattern consist of 2 main elements:
a horizontal neckline based on the equal lows,
a falling trend line based on the lower highs.
❗️The trigger is a bearish breakout of a neckline of the pattern and candle close below.
📉The position is opened on a retest.
🔴Stop loss is lying at least above the level of the last lower high.
🎯Take profit is the next historical support.
📍Bullish & Bearish Wedges
The bullish wedge pattern will be considered to be a trend-following pattern if the impulse leg preceding the formation of the pattern is bullish and the pattern is directed to the downside.
The pattern consist of 2 contracting falling trend lines based on the lower lows and lower highs.
❗️The trigger is a bullish breakout of a resistance of the pattern and candle close above.
📈The position is opened on a retest.
🔴Stop loss is lying below the low of the pattern.
🎯Take profit is the high of the pattern.
——————
The bearish wedge pattern will be considered to be a trend-following pattern if the impulse leg preceding the formation of the pattern is bearish and the pattern is directed to the upside.
The pattern consist of 2 contracting rising trend lines based on the higher highs and higher lows.
❗️The trigger is a bearish breakout of a support of the pattern and candle close below.
📉The position is opened on a retest.
🔴Stop loss is lying above the high of the pattern.
🎯Take profit is the low of the pattern.
📍Bullish & Bearish Flags
The bullish flag pattern will be considered to be a trend-following pattern if the impulse leg preceding the formation of the pattern is bullish and the pattern is directed to the downside.
The pattern consist of 2 parallel falling trend lines based on the lower lows and lower highs.
❗️The trigger is a bullish breakout of a resistance of the pattern and candle close above.
📈The position is opened on a retest.
🔴Stop loss is lying below the low of the pattern.
🎯Take profit is the high of the pattern.
——————
The bearish flag pattern will be considered to be a trend-following pattern if the impulse leg preceding the formation of the pattern is bearish and the pattern is directed to the upside.
The pattern consist of 2 parallel rising trend lines based on the higher highs and higher lows.
❗️The trigger is a bearish breakout of a support of the pattern and candle close below.
📉The position is opened on a retest.
🔴Stop loss is lying above the high of the pattern.
🎯Take profit is the low of the pattern.
📍Bullish & Bearish Symmetrical Triangles
The bullish symmetrical triangle will be considered to be a trend-following pattern if the impulse leg preceding the formation of the pattern is bullish.
The pattern consist of 2 contracting symmetrical trend lines based on the higher lows and lower highs.
❗️The trigger is a bullish breakout of a resistance of the pattern and candle close above.
📈The position is opened on a retest.
🔴Stop loss is lying at least below the last higher low of the pattern.
🎯Take profit is the high of the pattern.
——————
The bearish symmetrical triangle will be considered to be a trend-following pattern if the impulse leg preceding the formation of the pattern is bearish.
The pattern consist of 2 contracting symmetrical trend lines based on the higher lows and lower highs.
❗️The trigger is a bearish breakout of a support of the pattern and candle close below.
📉The position is opened on a retest.
🔴Stop loss is lying at least above the last lower high of the pattern.
🎯Take profit is the low of the pattern.
The main difficulty related to trading these patterns is their recognition. You should train your eyes to recognize them on a price chart.
Once you learn to do that, I guarantee you that you will make tons of money trading them.
❤️Please, support my work with like, thank you!❤️

GBPJPY are we seeing a new breakout? Hi, traders and TradingView community. The GBPJPY is on our radar today after a solid session from buyers yesterday.
Flash manufacturing and services PMI data came in better than expected and, combined with a mainly weaker yen, gave the GBP a nice boost. Buyers added 1.18% yesterday and broke above resistance, which has started to confirm a breakout of ascending triangle pattern. Breakouts from consolidation patterns can be seen as a good thing, as price has had plenty of time to build momentum.
The next thing we are looking for is further upside that can test or break the downtrend and resistance point (black box). If reached, we would also like to see the old resistance level become support for future seller tests.
164.20 could become resistance; much further above, 168.90 is also seen as possible resistance.
160.50 is seen as short-term support on the current upswing, and we would like to see 162 – 161.80 become support if tested.
If we see price move back into the previous consolidation pattern, this could be a worry. We would like to see new higher lows set up on or above the breakout point to continue to show that buyers hold momentum.
Good trading.

NZDJPY: Pullback From Key Level 🇳🇿🇯🇵
NZDJPY is taking off from a key support.
The price formed a double bottom on that and broke its neckline.
Goals: 84.35 / 84.8
❤️Please, support my work with like, thank you!❤️

EURNZD: Classic Bullish Setup 🇪🇺🇳🇿
EURNZD broke and closed above a neckline of a huge ascending triangle formation on a daily.
Watch carefully the underlined blue zone. It is a contracting buy zone based on a trend line and a broken neck line.
I will expect a bullish wave from that.
Next resistance - 0.728
❤️Please, support my work with like, thank you!❤️

usd trend updateas I was expected, cad go for its uptrend and now because of the ENG. in the last support zone, I'm ready for a FO. and then a new low

chf updateas I was expected, chf go for its demand zone. this week I believe that there is chance to buy the chf for the demand zone and then there is the best place to short.

GBPCAD: Classic Bullish Reversal 🇬🇧🇨🇦
GBPCAD reached a key daily structure support.
The price formed a head & shoulders pattern on that
and broke its neckline then.
I expect a pullback to 1.6165 / 1.62
❤️Please, support my work with like, thank you!❤️

Key Levels and Market overview into the Asian session openA look at the price action from the European and US sessions and what that may mean for the Asian market open after some stronger than expected US retail Sales triggered a choppy session. I feel data is still showing 'sticky inflation' which eventually leads to higher interest rates and lower spending which will cap the indexes...although traders are focused on a resilient economy fending off a recession.. I look at some key levels to watch and the price action setups I expect to play out.
Markets covered :-
DOW
Nasdaq
DAX
FTSE
ASX200
Hang Seng
USD Index
Gold
Oil
Copper

DOLLAR INDEX (DXY) Waiting For Breakout 💵
Dollar Index is consolidating.
The market is currently coiling within a horizontal trading range.
103.73 - 103.97 is its resistance.
I believe that the next bullish move may initiate after its breakout.
Wait for a candle close above that first, then buy aggressively or on a retest.
Next resistance will be 105.1
Remember, that a bearish breakout of the support of the range may push the index lower.
❤️Please, support my work with like, thank you!❤️
