EURNZD: Classic Bearish Reversal 🇪🇺🇳🇿
EURNZD looks very bearish.
The price formed a high momentum bearish candle on hourly time frame
and then broke a support line of a rising parallel channel.
It looks like the pair may go lower.
Goals:
1.6165
1.6095
❤️If you have any questions, please, ask me in the comment section.
Please, support my work with like, thank you!❤️
Priceactiontrading

NAS100 Short Term Bearish, Overall Long Term Bullish!!!April 24, 2022
Weekly- LT: Bullish
ST: High possibility price touches weekly trend line in about 100 points. Price is in weekly market structure (Yellow). This will finish weekly retracement for a continuation of a weekly bullish trend.
Daily- LT: Overall trend Bullish
ST: High possibility of price reaching lower Daily Market structure
4 Hour- Broke previous lower 4 hours structure (Purple).
High possibility of price reaching previous 4-hour structure/liquidity area
Strong support/Psych level at 13,288.5.
ST: Short
After short movement is matured, high possibility of price transitioning into a bullish/long movement.

HAVELLS - LongAll details are given on chart. If you like the analyses please do share it with your friends, like and follow me for more such interesting breakout charts.
Disc - Am not a SEBI registered. Please do your own analyses before taking position. This post is only educational purposes and not a trading recommendation.

AUDCAD: Your Trading Plan For Today 🇦🇺🇨🇦
On a live stream today we discussed a potential short trade on AUDCAD:
the pair is currently approaching a strong daily structure resistance.
On an hourly time frame, the price is coiling.
I spotted a tiny head and shoulders pattern.
0.932 - 0.9327 is its neckline.
Wait for an hourly candle close below that to confirm a breakout.
Then short aggressively or on a retest.
Your intraday goals will be 0.93 / 0.928
If the price sets a new high on hourly,
the setup will be invalid.
❤️Please, support this idea with like and comment!❤️

S&P500 Index (SPY) Important Breakout & Bearish Outlook 📈
After 1 week of consolidation within a horizontal trading range,
this morning S&P500 broke and closed below its support.
Taking into consideration that the market is trading in a minor bearish trend
from the beginning of April, that breakout will most likely trigger a further decline.
Goals:
4340
4300
❤️Please, support this idea with like and comment!❤️

NASDAQ BUY IDEANASDAQ Just broke the trading line on pretty much all time frames and price is looking forward to keep the new uptrend or at least an strong momentum

gbpaud longThe price has reached the weekly zone and is expected to reach the high zone.
In case of possible correction, we can make a purchase transaction on one of the specified areas.

AUDCHF: Bullish Continuation Pattern 🇦🇺🇨🇭
AUDCHF is trading in a bullish trend since November.
Setting a new high the price retraced to key horizontal structure support.
On that, a wide double bottom formation was formed on a 4H time frame.
I believe that the market may go higher now.
Goals: 0.7038 / 0.707
❤️Please, support this idea with like and comment!❤️

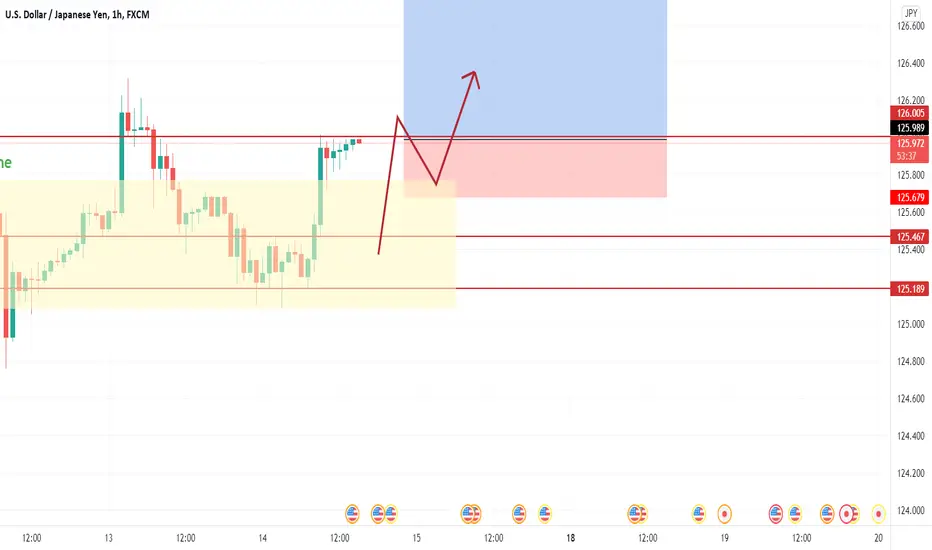
USDJPY [Long][2022-04-14]USDJPY has been ranging for about 7 days, Between 125.989 and 125.170. USDJPY had a false breakout on April 12 but quickly came back to the ranging zone. USDJPY broke out again with a quick retest where I placed a Buy stop right above with a 31 pip Stop loss. I will move my stoploss based on market structure so no profit target in mind.
DOLLAR INDEX (DXY) Can We Go Higher??? 💵
Weekly/daily time frame analysis on Dollar Index.
Price action & key levels to watch.
Potential scenarios.
❤️Please, support this video with like and comment!❤️

GBPNZD: Bearish Move From Key Level 🇬🇧🇳🇿
GBPNZD is trading in a strong bearish trend.
Recently we saw a correctional movement to a strong daily supply zone.
From that, I expect a bearish move to 1.9005 / 1.8955
❤️Please, support this idea with like and comment!❤️

NZDCAD: Pullback Trade 🇳🇿🇨🇦
NZDCAD looks quite oversold:
the price formed and inverted head and shoulders pattern after a strong bearish move.
Its neckline breakout signifies a highly probable pullback.
Goal - 0.864
❤️Please, support this idea with like and comment!❤️

GOLD (XAUUSD): Video Analysis; Your Trading Plan For This Week🥇
Multiple time frame analysis on Gold.
Price action & key levels.
Technical outlook and thoughts.
❤️Please, support this idea with like and comment!❤️

APEUSDT m15 - 09/04/2022 Two possible scenarios for APE. Link to my long-term APE analysis below
Good luck

BTCUSD m15 - 08/04/2022 There is a beautiful flag on the bitcoin chart. I expect there will be another sell-off before we witness the next rally
Good luck.

EURCHF: Update & Bearish Outlook 🇪🇺🇨🇭
This week we spotted a bearish breakout of a key level on EURCHF pair.
I was patiently waiting for a retest of the broken structure to look for shorting opportunities.
Today I finally spotted one.
The price formed a double top formation with a lower high on an hourly time frame.
Its neckline breakout confirms a coming bearish move.
Initial target - 1.01
❤️Please, support this idea with like and comment!❤️

NZDUSD: What to Look At Today 🇳🇿🇺🇸
Top-down analysis on NZDUSD.
Price action and key levels.
Technical outlook and potential scenarios.
❤️Please, support this video with like and comment!❤️

CRUDE OIL (WTI) Time to Grow?!🛢
Hey traders,
As you know, WTI Crude Oil reached a strong trend line on a daily last week.
From that, I was looking for a confirmation to buy.
The trigger that I needed was a bullish breakout of a bullish flag pattern on 4H time frame.
Violation of its resistance signifies a highly probable bullish continuation.
Targets:
108.3
113.0
❤️Please, support this idea with like and comment!❤️

US30 Scalp IdeaUS30 is currently in a huge range on the higher timeframe but there are some quick scalp trading opportunities within this range. Overall price has been bullish but this past week we have had a pullback. If price fails to break and close above resistance, we can see some more bearish continuation. Waiting for the market open to bring in volume to push price either to the upside or downside. I will trade with the momentum for a quick scalp trade opportunity depending on which way price breaks.

PRICE ACTION TRADING | INVERTED HEAD & SHOULDERS PATTERN 🔰
Hey traders,
Inverted head and shoulders pattern is a classic reversal pattern.
It signifies the weakness of buyers in a bearish trend and a bullish accumulation.
⭐️The pattern has a very peculiar price action structure:
Trading in a bearish trend the price sets a lower low and retraces setting a lower high (left shoulder),
then the market goes lower setting a new low but instead of setting a new lower high, the price returns back to the level of a previous lower high setting an equal high (head).
After that bears start pushing again but with an amplifying bullish pressure, the market sets a higher low and returns back to equal highs setting a new one (right shoulder).
🔔Equal highs form a horizontal structure called a neckline.
Once the pattern is formed it is still not a trend reversal predictor though.
The trigger that is applied to confirm a trend reversal is a bullish breakout of a neckline of the pattern.
📈Then a long position can be opened.
For conservative trading, a retest entry is suggested.
Safest stop is lying at least below the right shoulder.
However, in case the heights of the right shoulder and head are almost equal it is highly recommendable to set a stop loss below the head level.
🎯For targets look for the closest strong structure resistances.
What pattern do you want to learn in the next post?
❤️Please, support this idea with like and comment!❤️

🐂EUR/JPYEUR/JPY has been bullish for some time, giving positives on a previous setup we shared.
Price broke out of a resistance and moved higher impulsively, the analysis to this setup is linked below.
On the 1H chart, price has now presented a continuation pattern in the form of a flag.
We should look to long when price touches the supporting trendline for the third time and changes structure
Price has also formed an invers Head & Shoulders, so we should look to buy.
OANDA:EURJPY

Price Action Trading Strategy Resistance level is at price 118.71. Bull candlestick closed above 118.71 price level. Resistance level is now support. Next, wait for a rejection candlestick or pin bar candlestick to retest support level at 118.71.
Enter a market execution order after the candlestick completely forms into a rejection candlestick or pin bar candlestick.

GBPCHF: Pullback From Key Level 🇬🇧🇨🇭
GBPCHF has recently reached a key level.
On that, the price formed a double bottom formation.
Now we see its neckline breakout.
I expect a pullback to 1.215 / 1.2165 levels.
❤️Please, support this idea with like and comment!❤️
