NZDUSD: Classic Range Trading 🇳🇿🇺🇸
NZDUSD is stuck within a horizontal trading range.
Approaching its support the price formed a tiny double bottom formation and broke its neckline.
I expect a bullish move to 0.684
❤️Please, support this idea with like and comment!❤️
Priceactiontrading

Mandatory Price PatternsHey Guys!
When it comes to price patterns, there are many. I mean, look up "price patterns for trading" on google and you'll find countless variations. Just like in the movie "A Beautiful Mind", where Russel Crowe's character locates patterns in Russian Codes; a price action trader, can find endless variations of patterns on their charts.
However, these variations actually deter the trader from their sole purpose of trading. Which is to make money. Period.
With so many patterns multiplied by the different time frames that a trader utilizes in their trading, it is bound that there will always be multiple price patterns on the chart at any given time. What does that do? It confuses the heck out of the trader.
That said, price patterns are a foundational element of price action trading, and is necessary to trade at higher levels. But it is not the amount of patterns that a price action trader must master. If the price action trader can master the Double Top/Bottom, and the Head and Shoulders patterns at the initial level. Out of my experience, these 2 patterns alone are more than enough to extract consistent profits from the markets.
Simply put, it's about quality over quantity.
That's it! Hope this provided some insight into price patterns!
Have a great day!
Ken

GBPJPY ShortThe Pound has been showing some serious weakness for weeks now coupled with the ongoing crisis, investors tend to put their money in safer places like the Yen. So, I will still be expecting bearish prices on GJ but I will wait for a pullback for safer entries. That being said, the market can go wherever it pleases but let's watch and see what happens.

AUDUSD: Potential Pullback Trade Explained 🇦🇺🇺🇸
AUDUSD is approaching a strong structure resistance.
On that the price formed a double top formation.
To catch a pullback you should wait for a bearish breakout of its neckline.
You need an hourly candle close below 0.723 - 0.725 area.
Then shorting on a retest your goals will be 0.7185 / 0.7145
If the price sets a new high, the setup will be invalid.
❤️Please, support this idea with like and comment!❤️

AUDJPY LONG SETUPEntry if the price didnt touch the quasimodo first
wait for pullback to the strong demand
RR 1:2.5
keep your risk management strict
priceaction

Gold May not stop before $1975.Gold is on fire and aiming to test its near-term swing high zone of $1970/1975.
Gold's near-term support 1930/1932. As long as above $1930, it is possible to test the $1970/1975 price zone. Fundamental, technical, and market sentiment still suggests more upside bias.
But we may see some correction at the $1970/1975 price zone.
On the other hand, if xau/usd breaks below the $1930, it may test its another trendline support level of $1900/1910 price zone.
I remain bullish on gold-based of all three types of analysis. But of course, remember profit-taking factors and overbought conditions of gold.

US30 Analysis (Daily Timeframe)Last week US30 tanked with the news regarding the Russia vs Ukraine situation. At the end of the week the market rejected 32250 and had a strong bullish retracement.
Even though this was a strong rejection I am not in favors of the bulls just yet, because price is currently closing below the 200EMA which is a key indicator in identifying the trend.
If price rejects the 200EMA and forms resistance after printing a bearish candle, I will be looking for sell opportunities to possibly retest the low that was created last week.
But, if price pullback to form support and creates a higher low from the rejection wick, then this will confirm more bullish momentum. Waiting to see how price reacts throughout the week with a true trend direction identified by the end of the week. Keep in mind that there are a few important news reports regarding the economy this week which will bring volatility to the markets.
1.Price is in a bullish trend.
2. Market structure was broken here, but price has closed back into this range.
3. Price has closed below the 200 EMA (which is great indicator for identifying the trend) if price rejects, this is a great indicator for a bearish continuation.
4. Price did have a strong wick rejection from 32250, but I think price may retest this low since price is now closing below the 200EMA. If we form resistance and reject the 200EMA, price can definitely continue bearish to retest the lows

Characteristics of Price Action TradingHey Guys!
I know price action trading can be somewhat a mysterious and confusing style of trading. So I just wanted to jot down the basic characteristics of price action trading to help clarify this ambiguous trading style.
#1 Price action trading only uses price action to make trading decisions. No indicators, fundamental analysis, intermarket analysis, etc... Just price alone will do.
#2 The Price action trader "Reads" naked price ( using candles, trendlines, price patterns, distinct ways that price itself fluctuates) to predict how much future long/short strength there is in a asset and makes trading decisions.
#3 To the price action trader, misanalysis is never the fault of price, fundamentals, or any other analysis method. The fault is always on the price action trader's misinterpretation of price.
#4 Price action trading techniques can be directly applied to any time frame, thus can be used for any style of trading. Long term/Swing/Day Trading. Moreover can be applied to any asset class.(though some techniques must be tweaked somewhat.)
#5 The price action trader does not require a logical understanding of "why" price moves in a given direction. They have the mentality that if it works, there is no reason or need to explain it.
#6 To the price action trader, current price is more valuable than past price in terms of analysis. So what happens closer to current price has more weight in the analysis process. Thus must watch current price and cannot just buy /sell and let a higher power take the wheel.
That's it! Hope this clarifies price action trading a little!
Have a great day guys!
Ken

ICT Market Maker Sell ModelFirst you must have a clean consolidation which you are anticipating that it will be taken once market come up.
Secondly you must have an old low Significant OB which market is chasing it(magnetic) and you know that after market taken out that old low then it will reverse quickly to come up to attack your consolidation.
And finally you will investigate if you have any bearish SMT divergence that will give you a confidence that market will chase that old low

GBPJPY ShortStill expecting price to drop considering the impulse we saw pushing price to 154 area. Although I expect some sort of pullback before we see another impulse downwards

EURNZD: Expecting a Pullback! Here is Why: 🇪🇺🇳🇿
EURNZD dropped to a key level.
Then the pair was ranging for some time
and bulls managed to break a resistance line of a falling parallel channel to the upside.
I expect a pullback to 1.6818 / 1.69
❤️Please, support this idea with like and comment!❤️

How to trade Bullish Momentum Here's a tutorial on how to trade bullish channel using price action.
So when we see price ranging in a channel, we suppose to trade as per breakout or wait for retest entry. Here in BITCOIN when price broke down channel support we'll wait for retest and when we don't see retest and simply price reverse here we'll plan for bullish entry and call it as bullish channel. As soon as price breaks out the channel resistance with a strong candle we'll entry in trade by keeping the stop loss as recent swing low and channel high as our take profit.

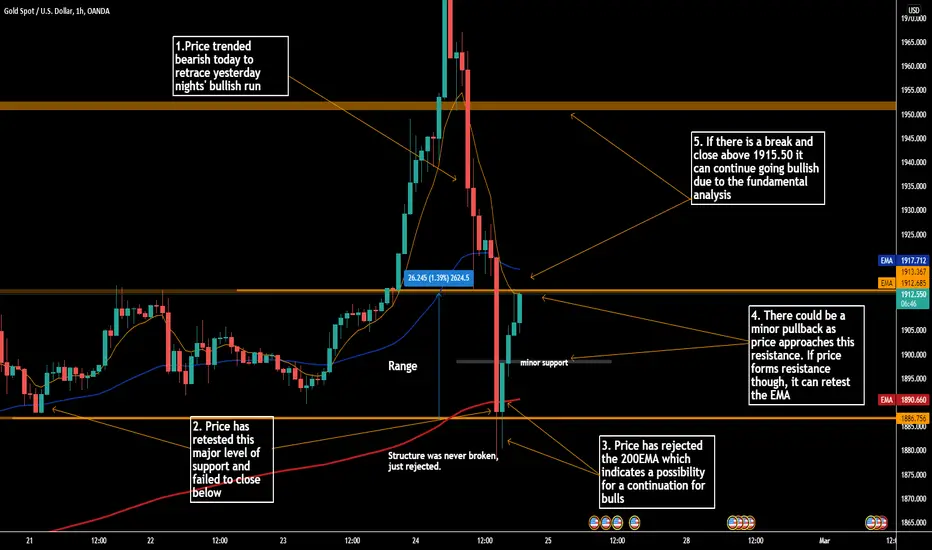
Gold Analysis 1H TFGold has found support in this range where the previous breakout happened. This could be a strong demand zone, but won't be confirmed until we break and close above resistance at 1917
1.Price trended bearish today to retrace yesterday nights' bullish run
2. Price has retested this major level of support and failed to close below
3. Price has rejected the 200EMA which indicates a possibility for a continuation for bulls
4. There could be a minor pullback as price approaches this resistance.
5. If there is a break and close above 1915.50 it can continue going bullish due to the fundamental analysis
USDCAD: Classic Range Trading 🇺🇸🇨🇦
Hey traders,
As we earlier discussed, USDCAD is stuck within a horizontal trading range.
Yesterday the price reached its upper boundary.
A bearish engulfing candle that was formed then is a perfect indicator of the strength of sellers.
For that reason, the pair will most likely drop to 1.269 / 1.2665 levels.
❤️Please, support this idea with like and comment!❤️

EURUSD | SHORT POSITION The bears taking control of the EURUSD markets. The EURUSD is to rallied in interim as prices are expected to plunge further.

Nasdaq LongPossible Swing trade to the upside for the long-term.
I'll monitor pending fundamentals due to Ukraine & Russian tensions which could also influence entry. Poses a good risk-reward ratio. Please let me know in the comments your thoughts on this trade.

SILVER (XAGUSD) Top-Down Analysis & Your Trading Plan🥈
Daily/1h time frame analysis on Silver.
Bearish bias explained.
Trading recommendations given.
❤️Please, support this idea with like and comment!❤️

Price Action Definition #2Price Action Definition #2
Hello My Dear Traders... I Am A New Trader... Not Too Long In The Game... But Just Starting Out On Social Media To Help Grow Myself As A Price Action Trader
I Am New To Trading View And I Am Hoping That I Can Fit Right In And Hopefully Make Some Great Educational & Analytical Content With Accurate And Understandable Information... Thank You
Price Action Trading Is My Way Of Trading... And I Just Wanted To Share Some Information On This Great Trading Style Of Trading The Markets Using Past Historical Price Movement And Data
As A Price Action Trader It Is Crucial That You Learn To Read & Understand What The Candlesticks On The Chart In Front Of You Are Saying.
You Need To Remember That The Market Leaves Clues And These Clues Are Somewhere Hidden In The Chaos / Confusion And Noise Of The Market...
Price Action Is A Form Of Technical Analysis... And It's Main Focus Is On The Relationship Of A Market's Current / Recent And Most Importantly Past Price Action / Price Movements
When It Comes To Price Action... The Candlesticks And Bars That Are Printed On The Charts Help To Play A Very Important Role In The Market And Also In Your Interpretation Of What Is On The Charts.
You Need To Also Remember That Second-Hand Indicators And Price-Derived Indicators Are Especially Not Needed When Trading With Price Action And Your Specific Price Action Trading Strategy.
Think Of Those Printed Candlesticks On The Charts As First-Handed Market Data
Price Action Trading Analysis Gives The Trader The Opportunity To Make Sense Of What The Market's Price Movement Is Trying To Convey Through Patterns Or Price Action Signals And Price Action Setups...
This Is Why When You Are Trading With Price Action... You Must Have A Proper Price Action Trading Strategy That Has Been Previously Tested And Approved...
There Are Many Many Price Action Strategies Out There... You Just Need To Pick One - Learn It - Study It - And Understand Its Function And Process, And Most Of All Master It.
You Must Master Your Strategy... It Is Very Important That You So.
As A Price Action Trader... You Should Generally Be Concerned With The Last 3-6 Months Of The Market's Past Historical Price Action Data.
Last But Not Least... You Need To Remember That All Of The Price Action And Market Data That You See On A Chart Is A Result Of The Minds / Emotions And Attitudes Of Traders / Investors And Anyone Participating In The Everyday Cycle Of The Market And The Economy...
Hope You Enjoyed This Lesson... Please Stay Tuned For The Last And Final Part Of This Trading Lesson

Price Action Definition #1Price Action Definition #1
Hello My Dear Traders... I Am A New Trader... Not Too Long In The Game... But Just Starting Out On Social Media To Help Grow Myself As A Price Action Trader
I Am New To Trading View And I Am Hoping That I Can Fit Right In And Hopefully Make Some Great Educational & Analytical Content With Accurate And Understandable Information... Thank You
Price Action Trading Is My Way Of Trading... And I Just Wanted To Share Some Information On This Great Trading Style Of Trading The Markets Using Past Historical Price Movement And Data
Price Action Trading Is A Style Of Trading That Utilizes Price Movements Across A Specific Time Period
Price Action Traders Base Their Trading Decisions Off Of Price / Market Movements Rather Than On Market Indicators
Price Action Trading Ignores Other Means Of Analysis Such News / Economic Events And Fundamental Analysis That Tend To Influence The Movements Of The Markets
Price Action Traders Use Raw Price / Market Historical Data To Help Them Predict Future Price Movements And Market Direction. This In And Of Itself Is A Form Of Technical Analysis
As A Price Action Trader... your main concern is to know how to Read And Understand the movements of the Market. A Price Action Trader ignores all the fundamental factors that tend to influence the movements of the market.
Price Action Traders solely rely on Price Action Data And Past Historical Market Data to help them predict future Market Movements And Direction.
Price Action is the Movement Of Price And How Price Changes... which is the "Action" of price. Price Action is much easily observed in markets with High Liquidity And Volatility.
But any market where anything is Bought Or Sold will most certainly produce some kind of Price Action
Price Action Is A Great Way Of Trading...
It Has Been Around For Many Many Years And Has Been Used By Many Many Traders All Over The World For Many Decades...
As The Saying Goes... PRICE ACTION Is King

isnt it to beautifull... pure price actionas u can see pure price action levels are marked. but we have to be cautious as Russia is accelerating the issue instead of solving it.
so obviously our bias will remain short but will keep an eye on the ongoing issue to get a real picture at the time of placing a trade.
so will not be interested in taking long positions as of now.

USDJPY: The Pair May Drop! Here is Why 🇺🇸🇯🇵
Even though USDJPY is trading in a bullish trend, the pair did not manage to break a previous high 116.35 and
set an equal high instead.
Then the market broke and closed below a support line of a rising channel.
It looks like the pair may drop at least to 114.25 level with a potential continuation to 113.6.
❤️Please, support this idea with a like! ❤️

Price Action Lesson: The Basics of How to Read Price Part 3Hey Guys!
As you guys know I aborted 2 short entries on the NZD/USD pair yesterday to minimize my losses.
In this lesson, I'll explain how I knew to abort the short entries early by reading 1 minute price action and thus minimize the loss.
Enjoy!
Have a great day!
Ken

Price Action Trading (Support and Resistance Levels)After price closes above a resistance level, then resistance level becomes support. Next, watch for a price action signal in the form of a pin bar, rejection candlestick, or engulfing bar. Enter at the closing price of the candlestick.
H1
H2
H3
