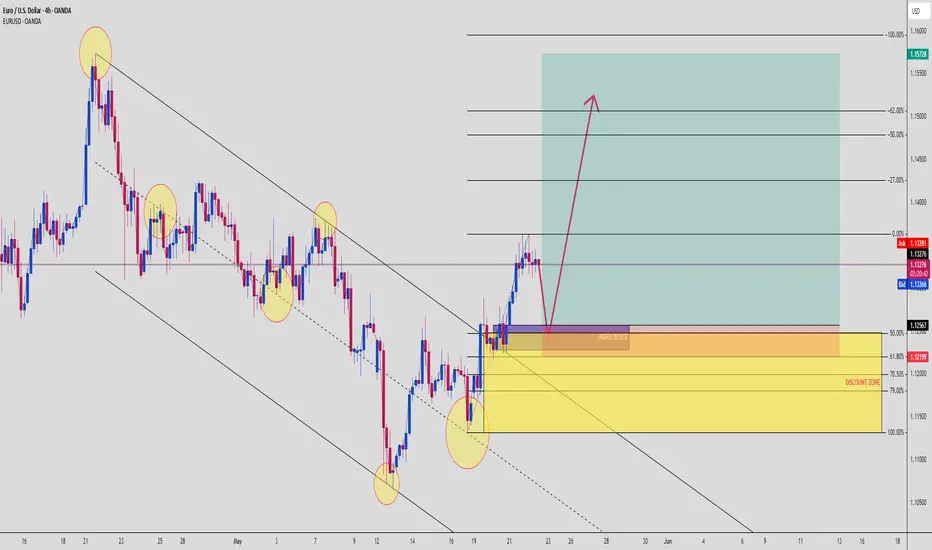
EURUSD Bounce Incoming? Smart Money Reversal BrewingThis EURUSD setup is a case study in smart money accumulation after a liquidity sweep + channel break. Price action is aligning like clockwork for a long setup, and the confluences are hard to ignore.
🧠 Breakdown:
🔻 Bearish Channel Structure: Market has respected this descending channel since early May — multiple taps, respected diagonals
🟡 Reversal Clues: Clean sweep of liquidity at the channel bottom with bullish engulfing candle
💰 Order Block + Discount Zone:
OB marked inside the 50%–79% retracement range
🔹 OB top: ~1.12567
🔹 Key entry: Between 1.12567 – 1.12199
🔹 SL: Below 1.1180 (clean under discount zone)
📈 TP zone: 1.15728 — previous market structure high and fib -100% level
✅ Risk-Reward: 1:5+ if played with precision
🔍 Why this setup is 🔥:
✅ Channel break = structure shift
✅ OB + Fib 61.8%–79% = strong demand confluence
✅ Liquidity below equal lows already taken
✅ Sharp bullish move after sweep = signs of big players entering
✅ Price likely to pull back to mitigate before exploding
🧠 Institutional Logic:
“Liquidity fuels price. Structure guides it. Confluence confirms it.”
The market swept lows, flipped structure, and now is likely returning to fill orders before the next leg up. This is a classic bullish mitigation play.
📊 If price taps into the OB and shows bullish confirmation — this is a sniper zone.
Set alerts. Wait for the wick. Enter on the flip. Let the market work for you, not the other way around.
Priceactiontrading
23.05.25 Morning ForecastPairs on Watch -
FX:CADJPY
FX:AUDCAD
A short overview of the instruments I am looking at for today, multi-timeframe analysis down to what I will be looking at for an entry. Enjoy!

22.05.25 Morning ForecastPairs on Watch -
FX:EURUSD
FX:EURGBP
FX:GBPJPY
A short overview of the instruments I am looking at for today, multi-timeframe analysis down to what I will be looking at for an entry. Enjoy!

EURUSD | Bullish Pennant Breakout – Retest Before the Target📊 EUR/USD (1H Timeframe)
The EUR/USD pair has shown a textbook example of a bullish pennant formation, which typically occurs during strong uptrends and signals a continuation of the bullish momentum. The price had an impulsive rally prior to the formation of the pennant, indicating a strong underlying bullish sentiment.
Following the rally, the market entered a period of consolidation where price action began to coil between two converging trendlines – this is the pennant structure, marked by lower highs and higher lows.
This tightening price action typically suggests that market participants are pausing to digest the previous move, often leading to another breakout in the same direction – in this case, bullish.
📐 Key Technical Elements Highlighted:
Bullish Pennant Formation:
Characterized by a sharp move up (flagpole) followed by a tight consolidation range (the pennant).
Volume generally contracts during consolidation and expands on breakout, confirming momentum.
Breakout and Retest:
Price has broken above the upper resistance line of the pennant.
Now pulling back for a retest, a healthy technical behavior often seen in strong setups.
This pullback offers a second chance for entry for traders who missed the initial breakout.
Support & Resistance Zones:
SR Interchange Zone (previous resistance turned into potential support).
Minor Resistance Zone above, now likely invalidated by breakout.
These zones are critical in evaluating potential price reaction and risk control.
Projected Target:
Based on the measured move from the pole height of the pennant added to the breakout point, the projected target stands near 1.14315, a level of prior structural interest.
🎯 Trade Plan – Technical Strategy
⚠️ This is a hypothetical scenario for educational purposes. Always manage your risk.
Entry Zone: On confirmation of a successful retest (bullish price action at trendline support)
Stop Loss: Below the pennant’s lower trendline or the SR interchange zone (1.1245 – 1.1260 region)
Target: 1.14315 (based on breakout projection)
Risk-Reward Ratio: Approx. 1:2 to 1:3 depending on entry precision
🔍 Psychological & Market Structure Notes:
A bullish pennant is a sign of accumulation after a strong rally – it tells us that buyers are resting, not gone.
The retest shows institutional behavior: smart money often allows price to come back to a breakout level before driving it higher again, to shake out weak hands and trap late sellers.
Momentum traders and breakout traders often wait for confirmation on the retest to pile in with higher confidence.
📚 Educational Takeaway:
This setup serves as a great case study in:
Continuation patterns (Bullish Pennants)
Breakout-retest behavior
Measured move target projections
Trend confirmation techniques
Market psychology and structure
If you're learning technical analysis, this is a high-probability pattern that occurs across many asset classes including forex, crypto, and stocks.

USDJPY Tap and Dump – Perfect Lower Timeframe ReversalSmart Money Scalpers, it’s time to eat 🍽️
USDJPY just played into a beautiful supply zone rejection on the 30-minute chart, with clean confluence from structure, trendlines, and OB reaction. Let’s break it down like a pro:
🧠 Market Structure Narrative:
🔻 Strong bearish momentum
🔹 Price created a clear lower low
🔹 Pullback into a premium zone = sniper short entry setup
You’re looking at textbook bearish order flow, with price rejecting hard from the 143.805 zone, which served as a high-risk institutional POI (Point of Interest).
🟥 Supply Zone / OB Zone:
📌 OB Range:
Top: 143.805
Bottom: 143.639
This red zone triggered the last bearish impulse and was just tapped and rejected with precision.
The reaction candle wick shows clear rejection = institutions likely mitigating and initiating shorts.
📐 Trendline Confluence:
You’ve got a perfect descending channel running down with clean touches on both trendlines.
Price bounced off the upper line → trendline + OB = double whammy setup 💥
🎯 Entry Plan:
Entry: 143.512
SL: 143.805 (above OB)
TP: 142.358 (next liquidity pocket)
This gives a juicy RRR of around 3.9–4x, depending on your exact fill.
🎯 Why This Works:
Price reacted to a clear OB
Inside a descending channel
Weak bullish push = no conviction
Favorable RRR = asymmetrical edge
Perfect combo of SMC + structure + execution = sniper-grade entry 🔫
🧠 Key Lesson:
“Let price come to you. Smart Money doesn’t chase — it traps and snaps.”
This is a trap sprung with surgical precision. Execution was key — and you nailed it.
🗣️ If this setup hit your radar too, drop a “🎯” in the comments
📌 Save this — these are the trades that build your bankroll over time.

21.05.25 Morning ForecastPairs on Watch -
FX:GBPAUD
FX:EURNZD
FX:GBPJPY
A short overview of the instruments I am looking at for today, multi-timeframe analysis down to what I will be looking at for an entry. Enjoy!

USDCHF Premium Tap into Order Block🚨 USDCHF Smart Money Setup Unfolding – One Shot, One Kill Opportunity
Here’s why this setup is packed with confluence and how Smart Money might be laying the perfect trap before a big drop...
🧠 Structure Breakdown:
We’re currently seeing a textbook retracement into premium pricing after a clear bearish move, and Smart Money seems ready to strike again.
✅ Swing High to Low Fib Analysis
We’ve pulled from the most recent swing high to the swing low — and price is now retracing into the 61.8%–79% golden zone. That’s classic territory for Smart Money to reposition short.
📍 Premium Trap Zone:
Between 0.8375 and 0.8395, we’re stacking multiple confluences:
Fib Golden Zone (61.8% – 79%)
Bearish Order Block
Strong High (Liquidity Pool)
Diagonal Trendline Resistance
Break of structure beneath current price
Price action is walking up cleanly, likely to attract late longs — but we know better. This is liquidity engineering at its finest. 📊
🧱 Smart Money Zones:
🔲 Order Block (OB) at ~0.8380–0.8395)
This OB aligns beautifully with 79% fib retracement and sits right below a Strong High — where liquidity is waiting to get grabbed.
🎯 Entry Logic:
Wait for a tap + bearish rejection candle inside the OB.
Set stop loss just above the Strong High.
Ride the momentum back down toward discount zones.
🎯 Target Zones:
TP1: Back to 0% fib level (~0.8325)
TP2: Extension to -27% fib (~0.8295)
TP3 (if momentum flows): Sub 0.8280 levels
This setup offers a clean 1:3+ RRR with sniper-level precision. Low risk, high reward — exactly what we love!
🧘♂️ Psychology of This Move:
Smart Money creates the illusion of bullish strength to:
Lure breakout traders above the high.
Fill institutional sell orders inside the OB.
Sweep weak lows after rebalancing inefficiencies.
This is not a random pullback — it’s a calculated liquidity sweep before expansion. 🚀
⚡ Game Plan:
✅ Wait for price to reach premium zone
✅ Look for rejection (engulfing or SMC candle confirmation)
✅ Enter with SL above high
✅ Take partials at equilibrium and trail to discount
✅ Don’t rush — let price come to you 💎
🧨 Risk Management Tip:
This is a surgical setup — you don’t need to overleverage to win.
Let the chart do the heavy lifting. Stick to 1–2% risk and let the RRR carry the profit.
✍️ In Summary:
USDCHF is retracing into a major premium zone packed with Smart Money confluence — Order Block, Fib, BOS, liquidity, and trendline resistance.
This could be one of the cleanest bearish setups this week if you stay patient and time it right.
🗣️ Drop "USDCHF READY" in the comments if you're planning to catch this setup!
📲 Tag your trading partner and don’t let them miss this sniper entry!

20.05.25 Morning ForecastPairs on Watch -
FOREXCOM:COFFEE
FX:EURUSD
FX:AUDJPY
A short overview of the instruments I am looking at for today, multi-timeframe analysis down to what I will be looking at for an entry. Enjoy!

NZDJPY: Another Bullish Confirmation 🇳🇿🇯🇵
If you remember, I already posted a bullish outlook for NZDJPY on Friday.
This morning, I spotted one more intraday bullish confirmation.
I see a breakout of a resistance line of a bullish flag pattern on an hourly time frame.
I expect a bullish movement at least to 85.9 level soon.
❤️Please, support my work with like, thank you!❤️
I am part of Trade Nation's Influencer program and receive a monthly fee for using their TradingView charts in my analysis.

19.05.25 Morning ForecastPairs on Watch -
FX:GBPJPY
FX:CADJPY
FOREXCOM:COFFEE
A short overview of the instruments I am looking at for today, multi-timeframe analysis down to what I will be looking at for an entry. Enjoy!

4 Profitable Bullish Patterns EVERY TRADER Must Know Forex, GOLD
In the today's post, we will discuss accurate bullish price action patterns that you can apply for trading any financial instrument.
1️⃣Bullish Flag Pattern
Such a pattern appears in a bullish trend after a completion of the bullish impulse. The flag represents a falling parallel channel. The market corrects itself within.
Bullish breakout of the resistance line of the channel is a strong bullish signal that can be applied for buying the market.
Best entries should be placed immediately after a breakout or on a retest.
Safest stop loss is below the lows of the flag.
Target - the next key resistance.
Here is the example of a bullish flag pattern that was formed on Gold on a 1H time frame. As you can see, after the breakout of the resistance of the flag, a strong bullish rally initiated.
2️⃣Ascending Triangle
Such a pattern forms in a bullish trend on the top of the bullish impulse. The market starts consolidation, respecting the same highs and setting higher lows simultaneously.
The equal highs compose a horizontal resistance that is called the neckline.
Its breakout is an important sign of strength of the buyers.
Buy the market aggressively after a violation, or set a buy limit order on a retest.
Stop loss should lie at least below the last higher low within a triangle.
Target - the next strong resistance.
Take a look at that ascending triangle formation on EURUSD.
Bullish breakout of its neckline was a perfect bullish signal.
3️⃣Falling Wedge
That formation is very similar to a bullish flag pattern.
The only difference is that the price action within the wedge is contracting so that the trend line of the wedge are getting closer to each other with time.
Your signal to buy is a bullish breakout of the resistance of the wedge.
Stop loss is strictly below its lows.
Target - the next key resistance.
GBPUSD formed a falling wedge on a 4H time frame, trading in a strong bullish trend.
You can behold how nicely the price bounced after a breakout of its upper boundary.
4️⃣Horizontal Range
Similarly to the ascending triangle, the horizontal range forms at the top of a bullish impulse in a bullish trend.
The price starts consolidation , then, setting equal highs and equal lows that compose a horizontal channel.
Breakout of the resistance of the range is a strong trend-following signal.
Buy the market aggressively after a breakout or conservatively on a retest.
Stop loss will lie below the lows of the range.
Target - the next strong resistance.
Dollar Index formed a horizontal range, trading in a strong bullish trend.
Breakout of the resistance of the range triggered a bullish rally.
The best part about these patterns is that they can be applied on any time frame. Whether you are a scalper, day trader or swing trader, you can rely on these formations and make consistent profits.
❤️Please, support my work with like, thank you!❤️
I am part of Trade Nation's Influencer program and receive a monthly fee for using their TradingView charts in my analysis.

XAUUSD Bearish Setup: Retracement Trap Before the Next Sell-Off?🚨 Gold (XAUUSD) is showing signs of a classic Smart Money retracement trap!
If you're trading gold this week, this is the kind of setup that separates the retail guessers from the Smart Money followers.
📉 The Setup Breakdown (30m Chart):
After a violent sell-off, XAUUSD found temporary support near $3,168, marking a key liquidity zone.
Current price is rebounding, but not randomly — it's heading straight toward the 50% - 61.8% Fibonacci retracement zone, which aligns perfectly with previous imbalance.
📍 Supply Zone (Red Box):
The red area marks a likely Smart Money sell zone — between $3,207 and $3,219.
This zone aligns with the 50% - 61.8% retracement and broken structure area — a classic point for redistribution.
🧠 What Smart Money Might Be Doing:
They're not buying this bounce — they’re setting the trap.
Price is retracing into a premium zone, tempting late buyers, while institutions prepare to re-enter shorts.
📉 Bearish Confluence:
The down-sloping channel supports the current bearish momentum.
Any rejection from the red zone could be the start of another impulsive leg down toward $3,170, then $3,168 and possibly lower.
🎯 Key Target Zones:
TP1: $3,170 — minor liquidity shelf
TP2: $3,168 — Fibonacci 0% level and key support
TP3 (extension): Below $3,160 if structure breaks aggressively
⚠️ Risk Management Strategy:
Entry near $3,207–$3,219
SL just above $3,219 for safety
RR on this play is highly favorable, but only if price respects the supply zone
⚡ Execution Plan:
Wait for bearish signs inside the red zone (engulfing candles, momentum shift)
Avoid early entries — Smart Money often pushes a few pips beyond equilibrium before reversing
Manage trade in segments, partial out at TP1 and trail stop into deeper targets
🧠 Pro Trader Tip:
This is not a breakout play — it’s a liquidity engineering setup.
Smart Money thrives on fake reversals, and this current bounce could be one of them. Watch the supply zone reaction closely.
✅ Comment "GOLD SETUP" if you’re watching this play unfold
✅ Save this analysis to sharpen your Smart Money trading edge

Gravita , 1DPattern is looking very good , Enter if Nifty is in Up Trend , Avoid if Nifty Trend is Reversing ,
Take Risk according to your Capital .
Dont panic in Retracement and pullbacks after entering into trade .
Follow for More Swing Ideas Like this .

NZDJPY price action trading n a weekly timeframe, the market revisited a previously tested zone. On the 1-hour chart, it broke out of this zone, and on the 15-minute chart, a backtest of the breakout level is currently occurring. Based on this setup, I’m planning to enter a trade.
Trade Plan:
Take Profit (TP): Targeting the last swing high.
Stop Loss (SL): Placing it below the last resistance level.
Risk-Reward Ratio (RR): Aiming for a minimum of 1:3.
This setup offers a high-probability trade with a favorable risk-reward ratio, capitalizing on the breakout and backtest confirmation.

09.05.25 Morning ForecastPairs on Watch -
FX:EURCAD
FX:USDCHF
FX:EURUSD
FOREXCOM:COFFEE
Heads up guys!! I will be heading to Greece today so next week my morning forecast videos may not be as consistent, due to internet and just not having my full equipment, so I will do my very best to get some forecasting posted for you all!
A short overview of the instruments I am looking at for today, multi-timeframe analysis down to what I will be looking at for an entry. Enjoy!

08.05.25 Morning ForecastPairs on Watch -
FX:AUDCAD
FX:EURCAD
FX:USDCHF
FOREXCOM:COFFEE
A short overview of the instruments I am looking at for today, multi-timeframe analysis down to what I will be looking at for an entry. Enjoy!

07.05.25 Morning ForecastPairs on Watch -
FOREXCOM:COFFEE
FX:EURCAD
FX:USDCHF
A short overview of the instruments I am looking at for today, multi-timeframe analysis down to what I will be looking at for an entry. Enjoy!

-1% GBPAUD & +2.5% GBPCHF Trade RecapsTwo positions I took over the last 10 trading days, both 4H entries, one long and one short.
FX:GBPAUD Short -1%
FX:GBPCHF Long +2.5%
Top down analysis explained in the video and also my thought processes behind playing both entries as limit orders to maximise R:R and protect stops much better.

06.05.25 Morning ForecastPairs on Watch -
FOREXCOM:COFFEE
FX:AUDJPY
FX:GBPUSD
FX:USDCHF
A short overview of the instruments I am looking at for today, multi-timeframe analysis down to what I will be looking at for an entry. Enjoy!

05.05.25 Morning ForecastPairs on Watch -
FX:USDCHF
FX:AUDUSD
FX:AUDCAD
FOREXCOM:COFFEE
A short overview of the instruments I am looking at for today, multi-timeframe analysis down to what I will be looking at for an entry. Enjoy!

"BTCUSD | FVG + Order Block Alignment | High Probability Play"⚡ BTCUSD Analysis - 1H Timeframe | April 28, 2025
📊 Price Action Breakdown:
BTC printed a textbook liquidity sweep earlier today, tapping into the Discount Zone perfectly.
Now, the market is pushing up into a high-probability reaction zone where Fair Value Gap overlaps with an Order Block.
🔥 Confluences:
Fair Value Gap (FVG) = Imbalance zone needing filling.
Order Block = Institutional demand/supply where Smart Money left a footprint.
Fibonacci 79% retracement = Sweet retracement level for low-risk entries.
🧠 Why It's Exciting:
The more confluences, the more Smart Money interest.
Price is currently kissing the edge of the FVG, teasing a deeper tap into the OB. This overlap stacks probability heavily for a reaction — either a quick scalp rejection or a full-on move downward.
🎯 Potential Play:
Entry: Inside the FVG or deep into the Order Block for premium entries.
Stop Loss: Just above the Strong High (~94,629) to avoid wicks.
Targets:
Partial at 50% retracement for safer players 🛡️
Full send toward Weak Low zone (~92,839) for maximum RRR hunters 🏹
💬 Pro Tip:
"Always let price show its hand first. Don’t assume, confirm."
🚀 Summary:
✅ Liquidity swept
✅ FVG + OB stacked
✅ 79% Fib lining up
✅ Smart Money trap possibly setting
🧘♂️ Play it with patience. The sniper eats last... but he eats the most.
✍️ Save this chart, tag your trading buddy, and prepare to strike when the premium entry triggers!
➡️ Comment "SETUP LOADING" if you’re stalking this with me!
➡️ Share this with someone who’s tired of guessing entries.

"Gold Just Respected The OB Like a Pro! 1:7 RR Setup LIVE!"📈 GOLD (XAUUSD) – 1H SMC Setup | April 30, 2025
This is a textbook Smart Money bullish entry — we’ve got the clean sequence of Order Block ➝ CHoCH ➝ Mitigation ➝ Pump.
🔍 Structure Analysis:
After a strong selloff, price created a valid Bullish Order Block around 3,253 – 3,285 (highlighted in purple).
Price swept previous lows (liquidity grab) before returning to mitigate the OB.
The Change of Character (CHoCH) marked the shift from bearish to bullish intent.
Price wicked into the OB zone → buyers stepped in → sniper entry executed ✅
🎯 Trade Setup:
Entry: 3,285
SL: 3,253 (below OB wick)
TP1: 3,310
TP2: 3,345
TP3: 3,370+ (Potential Imbalance Fill)
RR: ~ 1:7 (massive!)
🧠 Why This Works (SMC Logic):
Liquidity sweep before entry = market manipulation phase
OB = institutional footprint
CHoCH confirms momentum flip
Entry right at mitigation level = minimized drawdown, max RR
📌 Execution Notes:
Patience was key: entry triggered only after full mitigation of OB
No candle close below OB = confidence to hold
Now in expansion phase → trailing stop for runners 🏃♂️
💡 Pro Tip:
Price doesn’t reverse randomly. It reacts to zones where Smart Money operates — just like this OB. Learn the game, don’t chase the candles.
🔥 Final Thought:
This is the kind of setup you print out and pin on your trading desk.
Risk was tight. Reward? HUGE. This is why we follow structure, not emotions.
🗣️ Drop a 🔥 if you caught this Gold move!
💾 Save this post for your SMC playbook.
📤 Share it with your trading squad — don’t gatekeep winning setups.

02.05.25 Morning ForecastPairs on Watch -
OANDA:XAGUSD
FX:AUDJPY
FX:EURUSD
A short overview of the instruments I am looking at for today, multi-timeframe analysis down to what I will be looking at for an entry. Enjoy!
