S&P 500 Daily Chart Analysis For Week of February 24, 2023Technical Analysis and Outlook
The index Mean Res 4145 was the culprit target with the recent Intermediary Up Trend as shown on S&P 500 Daily Chart Analysis For the Week of Feb 17; all three targets were hit - Mean Sup 4060, Mean Sup 4015, and the Inner Index Dip 3980. The newly created Mean Res 4028 is our intermediate upside target - Dead-cat bounce. Keep in mind that the current bearish market sentiment is intact. There is a significant possibility that the Mean Sup 3890 and retest could be undertaken of Key Sup 3785 and completed of the Inner Index Dip 3785 as well.
Priceanalysis

EUR/USD Daily Chart Analysis For Week of February 24, 2023Technical Analysis and Outlook:
The Eurodollar continued a downward spiral this week, as shown on EUR/USD Daily Chart Analysis For the Week of Feb 17. The price action hit our Mean Sup 1.066 for several days, indicating its bearish mode. The leading downside target designation is Mean Sup 1.052 and the Inner Currency Dip of 1.046. Once this puppy hits our targets, we will see a revival to the upside aiming for the main target of the Mean Res 1.060.

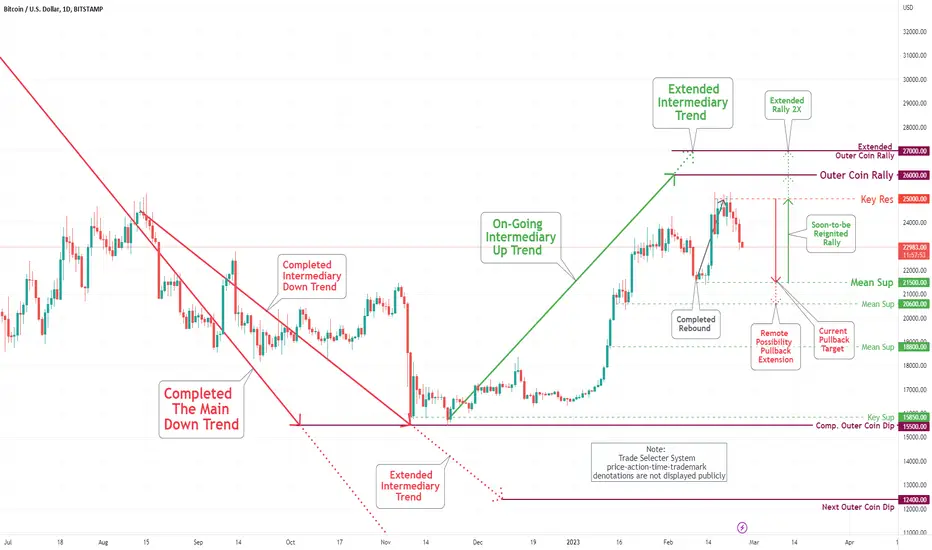
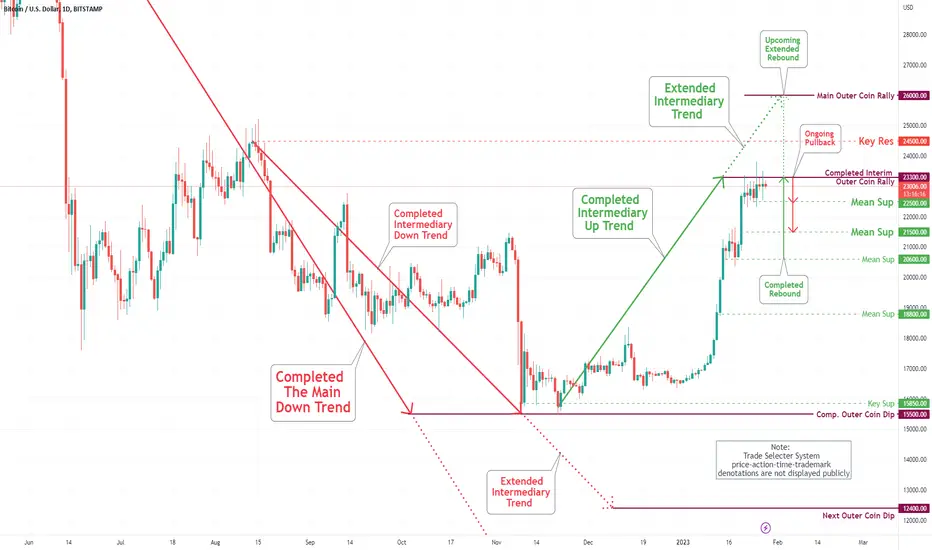
Bitcoin (BTC/USD) Daily Chart Analysis For Week of Feb 24, 2023Technical Analysis and Outlook:
After hitting our Key Res $24,500, as shown on the Bitcoin Daily Chart Analysis Update For the Week of Feb 17, the coin is retreating aggressively, striking our target of the Mean Sup $23,500 as marked and showing an earmark move to Mean Sup $21,500. Once this puppy settles down, we will see a resurgence to the upside - the initial target of Key Res $25,000 with a rally all the way to the Outer Coin Rally of $26,000 and the Extended Outer Coin Rally of $27,000 targets.
S&P 500 Daily Chart Analysis For Week of February 17, 2023Technical Analysis and Outlook
The index continues to respect our Mean Sup 4060 target as shown on S&P 500 Daily Chart Analysis For the Week of Feb 10. The newly created Mean Res 4145 is our intermediate upside target - However, keep in mind that the temporary bearish market sentiment is intact, and a significant possibility that the Mean Sup 4060 retest could be undertaken with an eye on the inner stepping stone of Mean Sup 4015 and completion of the Inner Index Dip 3980.

EUR/USD Daily Chart Analysis For Week of February 17, 2023Technical Analysis and Outlook:
The Eurodollar this week continued a downward retreat. The price action created new Mean Sup 1.066 as the intermediary beak point from the knockout punch. The leading upside target designation is Mean Res 1.075 - dead cat rebound. Once this puppy settles down, we will see a revival to the downside aiming for the main target of the Inner Currency Dip of 1.046.

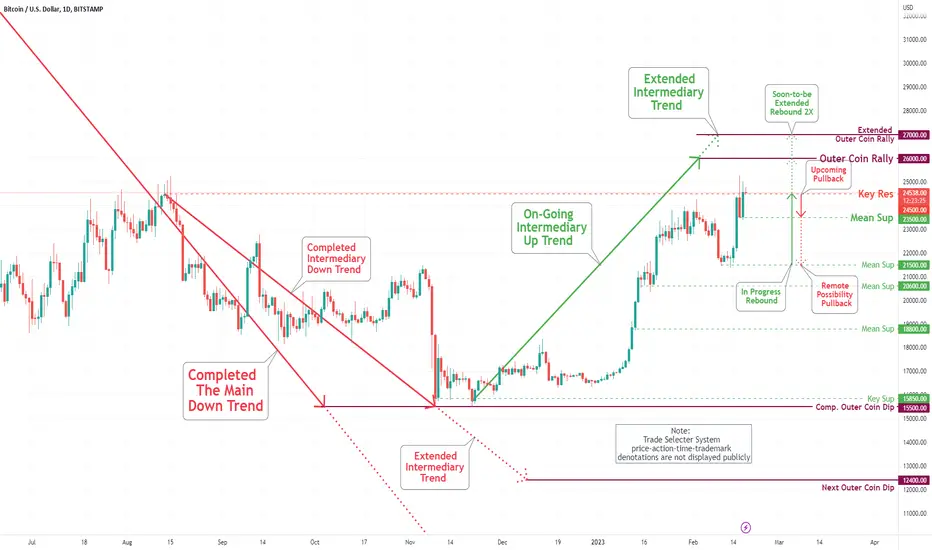
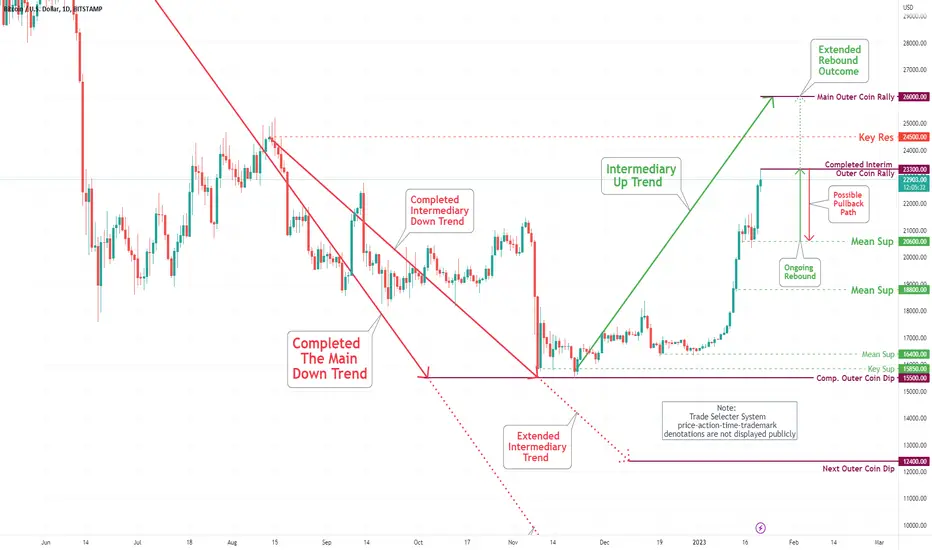
Bitcoin (BTC/USD) Daily Chart Analysis For Week of Feb 17, 2023Technical Analysis and Outlook:
The coin is resting comfortably at our Key Res $24,500, as shown on the Bitcoin Daily Chart Analysis Update For the Week of Feb 16. We expect a pullback to our Mean Sup $23,500 for this week's price action. Once this puppy settles down, we will see a resurgence to the upside - the initial target of Key Res $24,500 (Retest) with a rally all the way to the Outer Coin Rally of $26,000 and Soon-To-Be the Outer Coin Rally of $27,000 outcome.
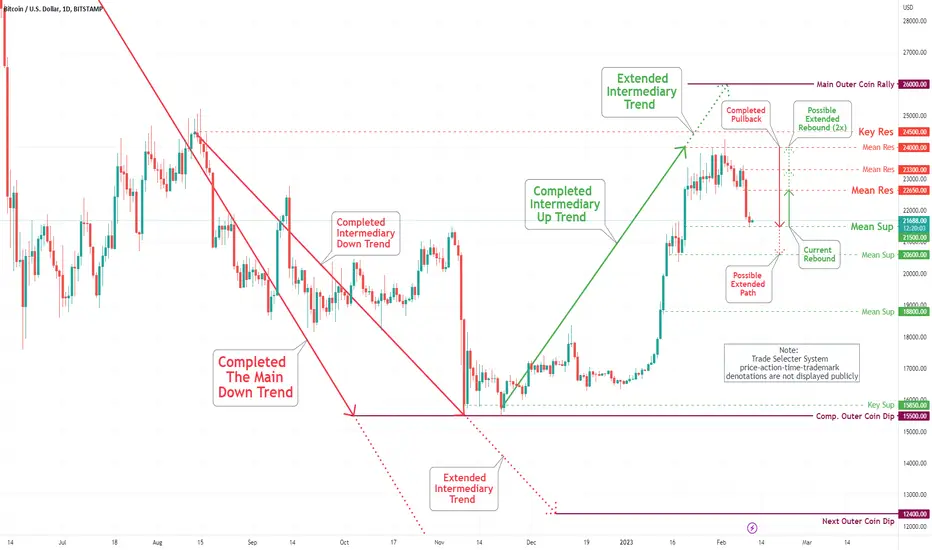
Bitcoin (BTC/USD) Daily Chart Analysis For Week of Feb 10, 2023Technical Analysis and Outlook:
Bitcoin hit our initial progressive pullback Mean Sup $22,500 and extended a retreat to Mean Sup $21,500 on Friday as shown on Bitcoin Daily Chart Analysis For the Week of Feb 3. Once this puppy flushed out weak-longs, resumption to the upside shows the initial target of Mean Res $22,650 with a possible rally all the way to the Mean Res $23,300 and $24,000 - this week.
S&P 500 Daily Chart Analysis For Week of February 10, 2023Technical Analysis and Outlook
Spooz hit our Mean Sup 4060 target as shown on S&P 500 Daily Chart Analysis For the Week of Feb 3. With the confirmation of the Key Res $4180 in place, the current dead cat rebound is expected to take us to Mean Res 4120 - However, keep in mind that the bullish market sentiment is intact, and a significant possibility that the Key Res $4180 retest could be launched with an eye on completion of the Outer Index Rally 4230. But if all fails, the index will take us down to two Mean Support targets: 4015 and 3970, for this week's trading scenario.

EUR/USD Daily Chart Analysis For Week of February 10, 2023Technical Analysis and Outlook:
The Eurodollar this week continued a downward spiral retreat to the crime scene of Mean Sup 1.078 and Mean Sup 1.070 from our newly created Mean Res 1.099 as shown on EUR/USD Daily Chart Analysis For the Week of Feb 3. The leading target designations are Mean Sup 1.052 and Inner Currency Dip 1.046 - dead cat rebound is expected.

S&P 500 Daily Chart Analysis For Week of February 3, 2023Technical Analysis and Outlook
Spooz hit our target Outer Index Rally 4140 and beyond. The development of the Key Res $4180 is in progress. The bullish market sentiment is intact. The pullbacks with this ongoing rally are expected to target the newly created Mean Sup 4060, and possibly an extension to the crime scene Mean Sup 4015.

EUR/USD Daily Chart Analysis For Week of February 3, 2023Technical Analysis and Outlook:
The Eurodollar pivoted from completing our newly created Mean Res 1.099 and is returning to the crime scene of Mean Sup 1.078 with possible additional downward movement to Mean Sup 1.070 - dead cat rebound is expected.

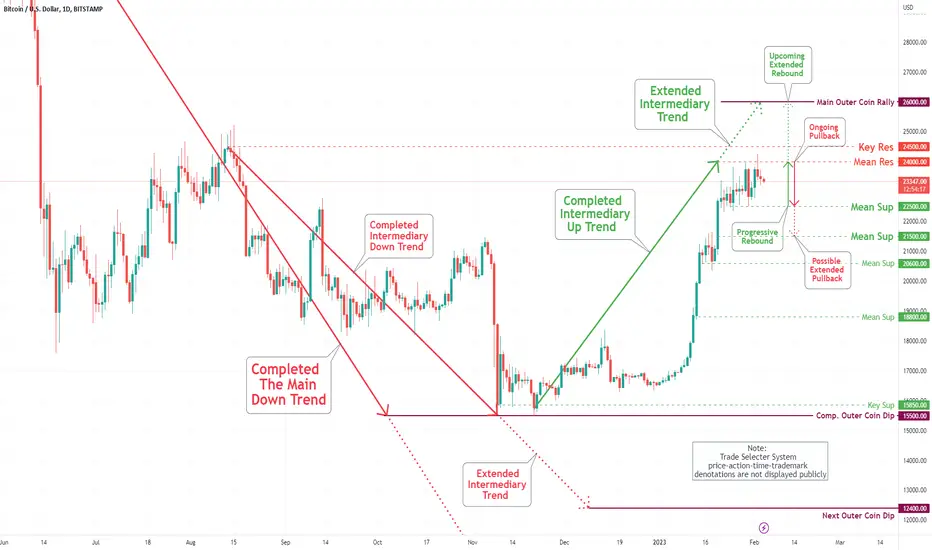
Bitcoin (BTC/USD) Daily Chart Analysis For Week of Feb 3, 2023Technical Analysis and Outlook:
Bitcoin extended a progressive rebound to a new Mean Res $24,000 - with the expectation of a pullback to the Mean Sup $22,500 and, possibly, an extension to Mean Sup $21,500. Once this puppy flushes out weak-longs, resumption to retest the Mean Res $24,000 and the Key Res $24,500 is imminent with a rally all the way to the Outer Coin Rally of $26,000.
S&P 500 Daily Chart Analysis For Week of January 27, 2023Technical Analysis and Outlook
Spooz continuously displays a bullish influence on the current market sentiment, with the upside trend hitting our targets Mean Res 4085 and continuous driving momentum to Outer Index Rally 4140. The pullbacks with this ongoing rally are expected to target Mean Sup 4015 and possibly extension to Mean Sup 3970.

EUR/USD Daily Chart Analysis For Week of January 27, 2023Technical Analysis and Outlook:
The currency pivoted about our newly created Key Res 1.091 and is heading down to Mean Sup 1.078 with possible additional buster energy to Mean Sup 1.070 before reigniting upward action to the Outer Currency Rally $1.110 in the near future.

Bitcoin (BTC/USD) Daily Chart Analysis For Week of Jan 27, 2023Technical Analysis and Outlook:
The coin hoovered under our completed with conformation Outer Coin Rally of $23,300 throughout the week - expect a pullback to the newly created Mean Sup $22,500 and, as a bonus, Mean Sup $21,500. Once this puppy flushes out weak-longs, resumption to retest the Outer Coin Rally of $23,300 and $26,000 is inevitable.
S&P 500 Daily Chart Analysis For Week of January 20, 2023Technical Analysis and Outlook
The upside target to the Mean Res 4820 was targeted within a mid-week, with the hasty pullback to our designated Men Sup 3950 and 3890. The index continuously displays a bullish influence on the current market sentiment with upside replication of targets to Mean Res 4020. Key Res 4085 and Outer Index Rally 4140. The pullbacks with this upcoming major rally are to be expected.

EUR/USD Daily Chart Analysis For Week of January 20, 2023The euro-dollar continuously stayed close to our newly created Key Res $1.086 this week and displaying a solid movement towards Outer Currency Rally $1.110 as specified in EUR/USD Daily Chart Analysis for December 30. However, be aware that this puppy is prone to breaking downwards to Mean Sup $1.078 and possibly $1.070 to reignite upward action Outer Currency Rally $1.110.

Bitcoin (BTC/USD) Daily Chart Analysis For Week of Jan 20, 2023Technical Analysis and Outlook:
Bitcoin completed the Outer Coin Rally of $21,200 and Key Res $ 21,300 on January 14 and stayed very near the outcome throughout the week - busting through on Friday with follow-through on Saturday to complete the interim Outer Coin Rally of $23,000 (Not shown 60 min chart). The pending confirmation is in the process - Once confirmed, the pullback to Mean Sup $20,600 is inevitable. Once this puppy settles down, we will see a resurgence on the upside to finalize the Outer Coin Rally of $26,000.
S&P 500 Daily Chart Analysis For Week of January 13, 2023Technical Analysis and Outlook
The completion of Inner Index Dip 3785 was a significant upsurge platform. The upside target to the Mean Res 4820 is in the process of being finalized, and the index continuously displays a bullish influence on the current market sentiment. The additional upside moves to Mean Res 4085, with Outer Index Rally 4140 currently being at the crosshair. The sudden pullback from hitting the Mean Res 4020 is expected to Men Sup 3950.

EUR/USD Daily Chart Analysis For Week of January 13, 2023Technical Analysis and Outlook:
The euro-dollar has bounced strongly from Mean Sup 1.052 as specified EUR/USD Daily Chart Analysis for January 6. The prevailing up path to the newly created Mean Res $1.070 and Key Res $1.078 is completed with the eye towards Outer Currency Rally 1.1100. However, be aware that this puppy is in the process of breaking downwards to newly formed Mean Sup $1.070 to reignite upward action as specified above.

S&P 500 Daily Chart Analysis For Week of January 6, 2023Technical Analysis and Outlook
The downtrend to Inner Index Dip 3785 was completed two weeks ago and retested. The upside target to the Mean Res 3880 has been finalized, and the index continuously displays a bullish influence with the current market sentiment. The additional upside moves to Mean Res 4020, 4085, with Outer Index Rally 4140 currently being at the crosshair. The pullbacks with this upcoming major rally are to be expected.

EUR/USD Daily Chart Analysis For Week of January 6, 2023Technical Analysis and Outlook:
The euro-dollar has bounced strongly from Mean Sup 1.058 as specified EUR/USD Daily Chart Analysis For the Week of December 30. The prevailing up path to the newly created Mean Res $1.070 and Key Res $1.078 is ongoing with the current market sentiment. However, be aware there is the possibility that this puppy may break downwards from Mean Res $1.070 to reignite upward action as specified above.

Bitcoin (BTC/USD) Daily Chart Analysis For Week of Jan 6, 2023Technical Analysis and Outlook:
Bitcoin bounced closer to our Mean Res $17,000 throughout the week. The retest of the Key Sup $15,850 is a toss-up. This puppy may break from the current position to create upward action to Mean Res $17,800, Mean Res $18,500, and Outer Coin Rally $19,100.
