[INTRADAY] #BANKNIFTY PE & CE Levels(18/03/2025)Today will be gap up opening expected in index. After opening if banknifty sustain above 48550 level then possible strong upside rally upto 48950+ level and this rally can be extend for further 400-500+ points in case banknifty starts trading above 49050 level. 48950 level will act as a resistance level for upside rally. Expected reversal from this level. Any major downside only expected below 48450 level.
Pricemovement

#NIFTY Intraday Support and Resistance Levels - 17/03/2025Expected gap up opening in nifty near 22500 level. After opening this is an important level for nifty. If nifty starts trading and sustain above 22550 level then expected upside rally upto 22700+ level. Downside reversal expected if nifty not sustain above level and starts trading below 22500. Downside 22350 level will act as a strong support for today's session.

#NIFTY Intraday Support and Resistance Levels - 13/03/2025Flat opening expected in index. After opening if nifty starts trading above 22500 level then expected upside rally upto 22650+ in today's session. 22650 level will act as an immediate upside resistance. Expected reversal from this level. Major downside expected if nifty not sustain above 22500 and starts trading below 22450 level.

[INTRADAY] #BANKNIFTY PE & CE Levels(13/03/2025)Today will be flat opening expected in index. Currently market consolidating in small range. Expected breakout of this consolidation zone in today's session. If banknifty sustain above 48050 level then possible upside move upto 48450. Also, In case banknifty starts trading below 47950 level can gives sharp downside rally of 400-500+ points. Downside 47550 level will act as a support for today's session.

[INTRADAY] #BANKNIFTY PE & CE Levels(12/03/2025)Today will be flat or slightly gap up opening expected in banknifty. 48050-47950 zone will act as a resistance for banknifty. Any bullish side rally only expected above this zone. Currently market consolidating in small range any downside rally possible below 47950 level this downside movement can goes upto the 47550 in today's session. If banknifty gives breakdown of consolidation zone.

Gold Price Analysis March 7Fundamental analysis
Gold prices saw buying pressure as they dipped below $2,900 before rebounding to a daily high in European trading on Friday morning. Investors were cautious and waiting for the key US jobs report. The upcoming Non-Farm Payrolls (NFP) report will have a significant impact on the USD's performance in the short term and could provide fresh impetus to gold prices.
Amid the market’s anticipation of key economic data, expectations that the Federal Reserve could cut interest rates multiple times in 2025 – amid signs of slowing US economic growth – sent the USD tumbling to a multi-month low, further supporting gold prices. In addition, concerns surrounding former US President Donald Trump’s trade policies and their potential impact on the global economy weighed on investor sentiment.
Technical analysis
Gold price is increasing in the early European trading session. 2928 will be the resistance level in this trading session. If the European session fails to break this zone, consider SELL signals to 95. Conversely, when breaking 2928, wait for retest and BUY signals towards 294x to SELL. NF trading range today is 2876 and 2945.

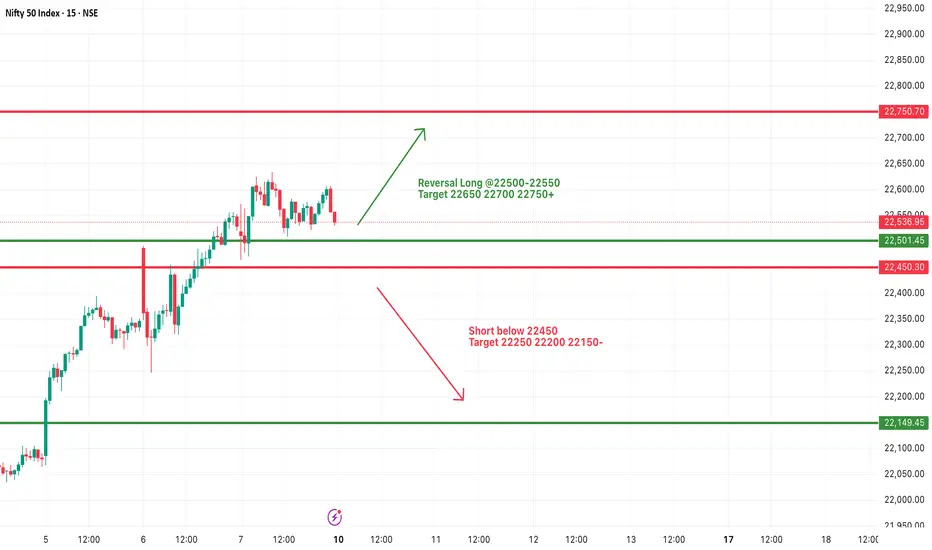
#NIFTY Intraday Support and Resistance Levels - 10/03/2025Flat opening expected in nifty near 22550 level. Any bullish side rally only expected if nifty sustain above 22500 level. If nifty gives upside movement then there will be nearest resistance at 22750 and expected reversal from this level. Strong downside expected if nifty starts trading below 22450 level.
#NIFTY Intraday Support and Resistance Levels - 06/03/2025Gap up opening expected in nifty above the 22400 level. After opening if it's sustain above this level and gives breakout of 22500 then expected further upside rally upto 22750 level in today's session. In case nifty starts trading below 22400 level then possible downside in index upto 22150 level in opening session.

04.03.25 Morning ForecastPairs on Watch -
FX:EURUSD
FX:GBPUSD
A short overview of the instruments I am looking at for today, multi-timeframe analysis down to what I will be looking at for an entry. Enjoy!

#NIFTY Intraday Support and Resistance Levels - 04/03/2025Gap down opening expected in nifty near the 22050 level. After opening if nifty sustain above 22050 level then only expected upside movement in index. Upside 22300 level will act as a strong resistance for today's session. Major downside fall expected in nifty in case it's starts trading below 22000 level. This downside can goes upto 21700 level.

28.02.25 Morning ForecastPairs on Watch -
FX:AUDNZD
FX:GBPUSD
FX:EURUSD
A short overview of the instruments I am looking at for today, multi-timeframe analysis down to what I will be looking at for an entry. Enjoy!

[INTRADAY] #BANKNIFTY PE & CE Levels(27/02/2025)Today will be flat opening in index near 48550 level. After opening this is the important support for banknifty. Any major downside only expected below this support level. If banknifty starts trading below 48450 then possible sharp downside upto 48050 level. Upside 48950 level will act as a resistance. Any upside rally can reversal from this level.

25.02.25 Morning ForecastPairs on Watch -
FX:EURCAD
FX:EURNZD
A short overview of the instruments I am looking at for today, multi-timeframe analysis down to what I will be looking at for an entry. Enjoy!

#NIFTY Intraday Support and Resistance Levels - 25/02/2025Slightly gap down opening expected in nifty. After opening if nifty starts trading below 22500 level then possible sharp downside of 150-200 points occurs in nifty. This downside rally can goes upto the 22300 level. Upside 22750 will act as a major resistance for today's session. Any upside rally can be reversal from this level.

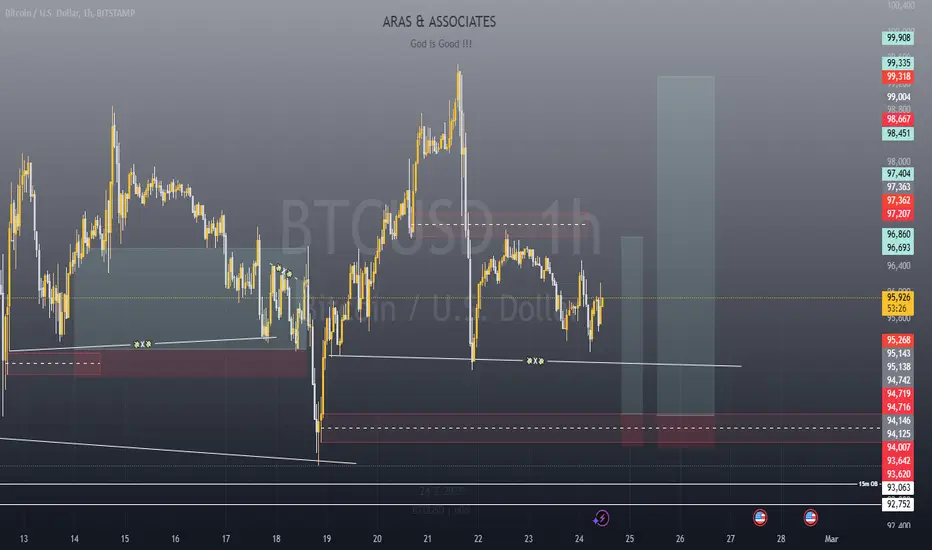
Rinse & Repeat !!!Hello everyone, a happy new trading week to you all !.
This setup is particularly a short-term buy for those looking to take advantage of BTC's range that has been refusing to take a side.
A good RRR trade that's sure to make you a bit of money. Use proper risk and money management (risk what you're willing to not get bothered by) and most especially, do your own analysis for extra confluence !.
#NIFTY Intraday Support and Resistance Levels - 24/02/2025Flat or slightly gap down opening expected in nifty. After opening important level is 22750. In case nifty starts trading below this support level then possible strong downside rally in index upto 22550 in today's session. Any upside rally only expected if nifty sustain above 22800 support level. Upside 23000 level will act as a strong resistance for any bullish side rally.

[INTRADAY] #BANKNIFTY PE & CE Levels(24/02/2025)Today will be flat opening expected in banknifty. After opening if banknifty starts trading below 48950 level then expected sharp downside rally in index upto 48550 level. This downside rally can be extend for further 400-500+ points downside in case banknifty gives breakdown of 48450 level. Any bullish side rally only expected if it is starts trading and sustain above the 49050 level. Upside 49450 level will act as a strong resistance for today's session.

Gold price analysis February 20⭐️Fundamental Analysis
The rally came after US President Donald Trump said a trade deal with China was possible. Geopolitical concerns increased after US President Trump said Ukraine had started a war with Russia and hinted that it was time to pay back all the aid it had provided to the US.
Meanwhile, the Federal Reserve (Fed) meeting minutes from Wednesday night had little impact. Only a few members of the Federal Open Market Committee (FOMC) favored stable interest rates and were in no rush to cut. Considering this, the possibility of a rate cut in June remains.
⭐️Technical Analysis
Gold prices are currently difficult to trade as they are at an all-time high. any recovery to the breakout points is considered the best opportunity to buy gold towards the 3000 peak. Watch for recovery points around 2940-2920 for BUY signals and watch the 2970 area as today's major resistance.

usdcny longit seems USD getting stronger specially after trump reelection. if you want to go long on it, it is better to wait for a breakout above 7.3400

20.02.25 Morning ForecastPairs on Watch -
FX:AUDUSD
FX:GBPNZD
FX:GBPJPY
A short overview of the instruments I am looking at for today, multi-timeframe analysis down to what I will be looking at for an entry. Enjoy!

#NIFTY Intraday Support and Resistance Levels - 20/02/2025Today will be flat opening expected in nifty. After opening possible nifty can consolidated in between 22950-23050 level. Any major movement only expected either breakout of 23050 level or downside of 22950 level. Downside 22800 will act as a important support for today's session. Below this support level sharp downside rally expected.

[INTRADAY] #BANKNIFTY PE & CE Levels(20/02/2025)Flat or slightly gap down opening expected in banknifty. After opening if banknifty starts trading and sustain above 49550 level then possible upside rally upto 49950+ level in today's session. Major downside expected if banknifty not sustain above level and starts trading below 49450. This downside can possible of 400-500+ points. Downside 49050 level will act as a strong support for today's session.

#NIFTY Intraday Support and Resistance Levels - 19/02/2025A flat opening today in nifty, with the index currently positioned near 23000-22950. If Nifty moves above 23050, a long position can be considered, targeting 23150, 23200, and 23250+.
However, a reversal short trade can be initiated around 23000-22950, with downside targets of 22900, 22850, and 22800. On the bearish side, a breakdown below 22750 will likely lead to further declines, with short targets set at 22650, 22550, and 22500.
Since the price is currently moving within the 22950-23000 range, the market is likely to open flat and may remain range-bound initially. The decisive move will come if it either breaks above 23050 for an uptrend or falls below 22750 for a bearish move. Should wait for a breakout confirmation before entering positions.
