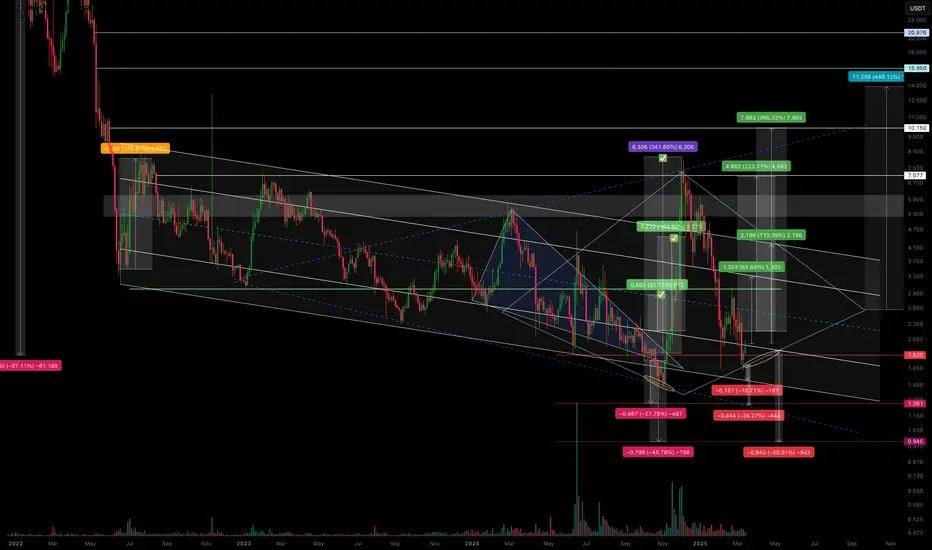
CVX/USDT – Is the scenario repeating? Continuing to work.The previous trading idea has played out with 3 out of 4 marked zones reached.
We saw a false breakout from the descending channel, followed by a pullback in line with the overall market—returning to the channel’s support zone.
I’ve noticed a potential formation of either a diamond pattern or an expanding triangle, but we’ll see how it plays out further.
Regarding declines and support zones:
-10.71% drop to the support of the descending channel.
-26.27% drop to the anticipated support of the expanding triangle.
-50% drop, likely as a squeeze under extremely negative news.
Regarding growth and resistance zones:
+65% rise to the resistance of the internal channel.
+110% rise to the resistance of the external channel (and if a diamond pattern forms, then its boundary).
+246% rise as a second attempt to break out of the descending channel.
+440% rise as a potential realization of diamond pattern pricing (if it forms).
All of this should be factored into your trading strategy, even the less likely scenarios.
I'll share the execution of the previous trading idea in my TG. I've also marked it on the chart.
Pricetrend
SCRT/USDT – Testing support. Will the scenario repeat?Secret - is a privacy-focused blockchain built on Cosmos. Its smart contracts, called Secret Contracts, enable DApps to utilize private data on Secret, similar to how smart contracts function on other blockchains. However, Secret Contracts transmit encrypted data through encrypted channels without exposing it. This is made possible by encrypting the contract state during execution.
All the charts are cropped, so I found a more complete historical chart of the coin and overlaid it to the left.
This coin has dropped by approximately -98% since its distribution. To put it in perspective, if you had invested $1,000 , you would now have only $20 …
We observe a formation resembling an internal channel (120%) and an external channel (280%) . The price is once again being squeezed near support at the lowest price zones available on Binance (where the main liquidity is).
My previous trading idea played out successfully in three zones .
Profit from the time of publication to the squeeze: +270%.
The price is moving within a descending channel , but at the same time, the sideways range I previously anticipated is also forming. Here, it’s crucial to adapt to the situation.
Right now, the entire market is experiencing a pullback toward support levels .
I've marked potential final liquidity grab zones on the chart—consider these in your trading strategy.
Also, I want to highlight how negative the news sentiment is at the moment. No one believes in a rally. But that's exactly how it always looks in similar price reversal zones !)))

AUDUSD Solid Short Position.💥 Entry for a nice swing trade Hi !
I've closed all positions, I only have AUDUSD @0.7520 Short position.
The price action shows a slow down in the new high highs and new lower highs.
I'm entering before confirmation ( disclaimer : this is not a trading advice )
I have same SL and TP as my chart.
If you like or share any opinion on AUDUSD.
Comment and like !
Thanks for reading
Carlos

On-Balance Volume | How to Anticipate Trend Reverse?Hello, dear subscribers!
Today we have a very useful information about the potential trend reverse anticipation and trend's strength measurement. On-balance volume (OBV) is one of the most powerful indicator for these purposes. The rising OBV means that the bulls control the market, falling OBV means the bearish pressure, OBV on the sideways means the equal strength of the bulls and bears.
Here are 9 combinations of the price action and the OBV which can help you to forecast the future trend.
1.Price Uptrend + OBV Uptrend
It means that the uptrend is strong and confirmed by the volume. There is a high probability of the uptrend continuation.
2.Price Uptrend + OBV Sideways
The uptrend is not so strong as in the previous point, but bears are not so strong to reverse it.
3.Price Uptrend + OBV Downtrend
There is a sign of the potential reverse to the downtrend, be careful.
4.Price Downtrend + OBV Uptrend
There is a sign of the potential price trend reverse from downtrend to uptrend.
5.Price Downtrend + OBV Sideways
Here is the sign of weakness of the uptrend, but the bulls still have not enough power to reverse the trend.
6.Price Downtrend + OBV Downtrend
It means that the downtrend is strong and there is no potential reverse anticipated.
7.Price Sideways + OBV Uptrend
Bulls accumulates the power to reverse the sideways to the uptrend. This is the bullish sign.
8.Price Sideways + OBV Sideways
This is indefinite situation. Trade execution is not recommended.
9.Price Sideways + OBV Downtrend
Here is the sign of the potential downtrend beginning.
DISCLAMER: Information is provided only for educational purposes. Do your own study before taking any actions or decisions.

BTC_second scenario_which is very logicThe second scenario is very logical
In fact, the 19,850 resistance was broken without a price correction, and of course, in a short period of time, it seems that the price above 20,000 is not reasonable in this situation, and in fact it is trapped in this range, if this is the case, this high price range 20,000 will be maintained until the end of January, after which the real price correction will take place .
It is expected that based on the support and resistance ranges that are fully aligned with the Fibonacci main lines, this price correction will start first.
Up to the support level of 16,000 and then a small uptrend to the resistance range of 19,850, then again a downward correction to the support range of 14,000. If the support range of 14,000 is broken, it is likely to fall to the support range. 12,000 will continue, and finally, after completing the head and shoulder pattern, we will expect a strong climb to 30,000.

SPDW: Another SPDR ETF to add to your long-term portfolioSPDW: Another SPDR ETF to add to your long-term portfolios.
Just a reminder: the IRS is allowing contributions until July 15th to your retirement accounts! So, if you have a couple thousand, I strongly recommend taking advantage of opening a Roth IRA.
Remember it is never too late to start saving!
Another addition I have made to my portfolio is $SPDW. The SPDR Portfolio Developed World ex-US ETF is an excellent way to diversify your holdings to the global market without adding additional exposure to the US Markets. Additionally, $SPDW offers a 3.64% Distribution Yield (TTM) (30 Day SEC yield of 2.84%) without the risks that are commonly attributed to emerging market funds.
The fund consists of well-known global corporations; $NESN (Nestle) 1.69%, $ROG (Roche) 1.40%, SMSN (Samsung) 1.26%, $NOVN (Novartis) 1.23%, $SAP (SAP) 0.81%, and $AZN (AstraZeneca) 0.80%.
FactSet analysts give the ETF a “A” rating and XTF a 9.4 out of 10.0. The expense ratio of the ETF is miniscule at 0.04%.
$SPDW appears to have stabilized from March lows but is still trading below its February highs. It would appear that this fund hasn’t fully recovered but is still an excellent choice for a long-term buy.
Long 150 Shares SPDW.

NSE:NIFTY 50 No More BullsNSE:NIFTY
As per NIFTY50 Weekly chart its seems bullish trend is at end and we may see bears will be taking over from here.
CMP 12214.55

Rising Wedge Reversal (1M plot) /GME stock expected to tank HARDGiven everything we know about this business and the news of horrible quarterly results over the past year and a half, Gamestop is one bad quarter away from total bankruptcy.
Let's take a look at we have going forward on the 1 month chart data:
Falling volume, momentary rise in price these past couple weeks, converging trend lines all signaling a bearish breakout in the short term in classic rising wedge formation. Add to that the MACD approaching zero line crossover, falling RSI, and market indecision on Ichimoku cloud with a bearish lean according to Base Line (Kijun) crossing above Conversion line (Tenkan) & Lagging Span (Chikou) used as filtering despite price hovering within Kumo cloud. Fib-EMAs also showing strong likelihood of a breakout & maintenance of this trend in the short term.
Stay tuned from now until early January 2020 for breakout.
