GOLD // primary expansionThe market is in the primary long expansion phase in a H4/H1 countertrend.
There was an H1 break above the last breakdown (lower green level), so another wave up triggers a long trade for me. The target zone is the H1 161.8 in line with the daily 123.6 very close to the daily ATR high.
A trigger candle I'm looking for is a Marubozu-like candle at the trigger level, that is a M15 breakdown, in line with the break of the countertrend line.
———
Orange lines represent impulse bases on major timeframes, signaling the direction and validity of the prevailing trend by acting as key levels where significant momentum originated.
Level colors:
Daily - blue
Weekly - purple
Monthly - magenta
H4 - aqua
Long trigger - green
Short trigger - red
Clean (not yet tested) breakdown - dashed green
Clean (not yet tested) breakout - dashed red
———
Stay grounded, stay present. 🏄🏼♂️
<<please boost 🚀 if you enjoy💚
Primarytrend

EURUSD // still some time to prepare for the short expansionThe weekly trend is bearish, and the daily has broken the long structure.
The market is in a minor short trend, that may speed up with a significant break below the lowest clean (not yet tested) daily and H4 breakout zone (red dashed).
From there, the H4 and the daily target fibo levels are valid that align well with a daily / H4 breakout zone.
Key Fundamentals
Summary
The EUR/USD currency pair has come under pressure due to escalating U.S. tariff threats and diverging monetary policies between the Federal Reserve and the European Central Bank (ECB). The U.S. dollar has strengthened amid these developments, while the euro struggles with a dovish ECB stance and economic uncertainties in the Eurozone.
Key Factors
U.S. Tariff Threats:
President Donald Trump has announced a 25% tariff on imports from Mexico and Canada, aiming to address issues such as illegal immigration and fentanyl trafficking, which has bolstered the U.S. dollar’s safe-haven appeal (Reuters).
Divergent Monetary Policies:
The Federal Reserve has maintained its interest rates, citing a strong U.S. economy, while the ECB has cut its benchmark rate by 25 basis points to counteract the Eurozone’s economic slowdown. This divergence has strengthened the U.S. dollar relative to the euro (Reuters).
Eurozone Economic Challenges:
The Eurozone is facing high energy costs, political instability, and external threats from global powers, which have weakened investor confidence in the euro (Wall Street Journal).
Market Sentiment:
The U.S. dollar has risen against major currencies as markets brace for potential tariff hikes. Meanwhile, stock indexes have posted gains, with Apple performing notably well (Reuters).
Actionable Insights
Bullish Case for EUR/USD:
If trade tensions de-escalate, the euro could recover against the U.S. dollar as market risk appetite improves.
Positive economic data from the Eurozone, such as stronger GDP growth or inflation data, could bolster the euro’s value.
Bearish Case for EUR/USD:
If the U.S. implements its 25% tariffs, the dollar could strengthen further, leading to a decline in EUR/USD.
Continued monetary policy divergence between the Fed and ECB could push the euro lower, especially if the ECB remains dovish while the Fed keeps rates steady or moves higher.
———
Orange lines represent impulse bases on major timeframes, signaling the direction and validity of the prevailing trend by acting as key levels where significant momentum originated.
Level colors:
Daily - blue
Weekly - purple
Monthly - magenta
H4 - aqua
Long trigger - green
Short trigger - red
Clean (not yet tested) breakdown - dashed green
Clean (not yet tested) breakout - dashed red
———
Stay grounded, stay present. 🏄🏼♂️
<<please boost 🚀 if you enjoy💚

COFFEE // on the way upThe market is long on every timeframe, and broke the last clean H1 breakdown, so the weekly target fibo 138.2 level is valid again.
KEEP IT SIMPLE!🏄🏼♂️
———
Orange lines represent impulse bases on major timeframes, signaling the direction and validity of the prevailing trend by acting as key levels where significant momentum originated.
Level colors:
Daily - blue
Weekly - purple
Monthly - magenta
H4 - aqua
Long trigger - green
Short trigger - red
———
Stay grounded, stay present. 🏄🏼♂️
<<please boost 🚀 if you enjoy💚

BITCOIN // primary expansionKey Chart (H4)
The weekly is mixed, but the daily is bullish, and there was only one H4 breakdown that kept the market off from the primary long trend’s expansion phase.
Targets are the H4, daily and weekly fibo levels on the chart.
Short only below the red level.
Key Fundamentals
Summary
Bitcoin has recently experienced a notable price increase, trading at approximately $105,376, reflecting a 2.7% gain. This surge is influenced by the Federal Reserve’s decision to maintain interest rates and growing optimism within the cryptocurrency market. Additionally, significant corporate investments and evolving regulatory perspectives are shaping Bitcoin’s market dynamics.
Key Factors
Federal Reserve’s Interest Rate Decision:
The Federal Reserve’s choice to keep interest rates steady at 4.25% to 4.5% has contributed to Bitcoin’s recent price appreciation. Investors appear optimistic despite the central bank’s acknowledgment of persistent inflation. 
Corporate Adoption and Investment:
Companies like MicroStrategy have significantly increased their Bitcoin holdings, viewing it as a strategic asset. Analysts have noted that MicroStrategy’s valuation is now closely tied to its Bitcoin investments, reflecting broader corporate adoption trends. 
Regulatory Developments:
Discussions are underway regarding governmental involvement in cryptocurrency holdings. For instance, the UK’s Crown Prosecution Service is seeking legal ownership of seized Bitcoin, which could influence future regulatory frameworks. 
Market Sentiment and Speculation:
Speculation surrounding political developments, such as potential policy changes under different administrations, has also impacted Bitcoin’s price movements. The market is responding to anticipated shifts in regulatory approaches and their potential effects on cryptocurrency adoption. 
Actionable Insights
Bullish Case:
Institutional Adoption: Continued corporate investments and endorsements could drive further price appreciation.
Regulatory Clarity: Clear and supportive regulatory frameworks may enhance investor confidence and market stability.
Bearish Case:
Regulatory Crackdowns: Potential restrictive regulations could hinder market growth and reduce investor participation.
Market Volatility: High volatility and speculative trading may lead to sharp corrections, posing risks to investors.
———
Orange lines represent impulse bases on major timeframes, signaling the direction and validity of the prevailing trend by acting as key levels where significant momentum originated.
Level colors:
Daily - blue
Weekly - purple
Monthly - magenta
H4 - aqua
Long trigger - green
Short trigger - red
Clean (not yet tested) breakdown - dashed green
Clean (not yet tested) breakout - dashed red
———
Stay grounded, stay present. 🏄🏼♂️
<<please boost 🚀 if you enjoy💚

BITCOIN // primary long expansionThe market is bullish on every timeframe, and there is a countertrend break at the daily target fibo 100 (daily peak).
The next targets are the daily target fibo 138.2-161.8 and the weekly target fibo 200.
The trigger for this idea is a significant break above the highest CLEAN M15 breakdown.
The idea is valid until the Daily impulse base breaks.
———
Orange lines represent impulse bases on major timeframes, signaling the direction and validity of the prevailing trend by acting as key levels where significant momentum originated.
Level colors:
Daily - blue
Weekly - purple
Monthly - magenta
H4 - aqua
Long trigger - green
Short trigger - red
———
Stay grounded, stay present. 🏄🏼♂️
<<please boost 🚀 if you enjoy💚

NASDAQ // countertrend breakThe market is at the countertrend break.
There is a clean (not tested) H4 breakdown close to the highest daily peak that needs attention and position management, but above that, the target fibo levels are valid targets.
———
Orange lines represent impulse bases on major timeframes, signaling the direction and validity of the prevailing trend by acting as key levels where significant momentum originated.
Level colors:
Daily - blue
Weekly - purple
Monthly - magenta
H4 - aqua
Long trigger - green
Short trigger - red
———
Stay grounded, stay present. 🏄🏼♂️
<<please boost 🚀 if you enjoy💚

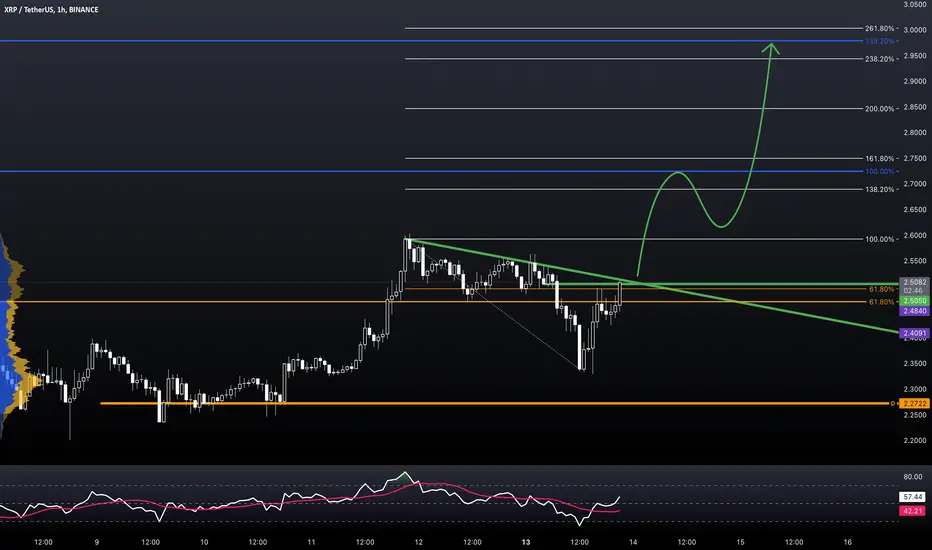
RIPPLE // Will it break the countertrend?The countertrend is still valid, and the price is at the countertrend line zone (daily and H4).
If the long trigger, that is a H4 breakdown, is crossed up significantly on H4, the target zone is the target fibo levels.
———
Orange lines represent impulse bases on major timeframes, signaling the direction and validity of the prevailing trend by acting as key levels where significant momentum originated.
Level colors:
Daily - blue
Weekly - purple
Monthly - magenta
H4 - aqua
Long trigger - green
Short trigger - red
———
Stay grounded, stay present. 🏄🏼♂️
<<please boost 🚀 if you enjoy💚

RIPPLE // countertrend breakThe market is at the countertrend break, daily fibo levels are the targets.
KEEP IT SIMPLE!
———
Orange lines represent impulse bases on major timeframes, signaling the direction and validity of the prevailing trend by acting as key levels where significant momentum originated.
Level colors:
Daily - blue
Weekly - purple
Monthly - magenta
H4 - aqua
Long trigger - green
Short trigger - red
———
Stay grounded, stay present. 🏄🏼♂️
<<please boost 🚀 if you enjoy💚
EURUSD // long term outlookThis week's close is below a significant level.
First, it crossed below a weekly breakout, second, below the weekly target fibo 61.8.
Any up move until the weekly impulse base is just a correction of the last weekly wave down.
The next weekly levels are all targets, but 0.91100 is, in my opinion, keeps getting more chance to be reached.
WHAT DO YOU THINK?
———
Orange lines represent impulse bases on major timeframes, signaling the direction and validity of the prevailing trend by acting as key levels where significant momentum originated.
Level colors:
Daily - blue
Weekly - purple
Monthly - magenta
H4 - aqua
Long trigger - green
Short trigger - red
———
Stay grounded, stay present. 🏄🏼♂️
<<please boost 🚀 if you enjoy💚

CARDANO // long expansionThe bullish trend is valid on all the major timeframes, and the market is at the daily target fibo 61.8, already above the last clean breakdown - the border of the expansion phase.
Daily chart:
If this small countertrend is broken (at the trigger zone), the first target is the daily peak (target fibo 100).
———
Orange lines represent impulse bases on major timeframes, signaling the direction and validity of the prevailing trend by acting as key levels where significant momentum originated.
Level colors:
Daily - blue
Weekly - purple
Monthly - magenta
H4 - aqua
Long trigger - green
Short trigger - red
———
Stay grounded, stay present. 🏄🏼♂️
<<please boost 🚀 if you enjoy💚

THE US DOLLAR (DXY) // primary long expansionThe last impulse, that is visible even on the weekly chart, broke the weekly structure.
The emerging countertrend only came back to 23.6, but tested the weekly (and H4) breakout, and turned up in the direction of the primary trend.
This is the expansion phase with a target of 109.00, and it is valid until the structure breaks on H4.
———
We may not know what will happen, but we can prepare ourselves to respond effectively to whatever unfolds.
Stay grounded, stay present. 🏄🏼♂️
Your comments and support are appreciated! 👊🏼

SOLANA // primary long trendThe daily countertrend has reached the weekly breakout, and turned long, breaking the last clean daily breakdown.
As long as the daily impulse base holds, the primary long trend is valid.
———
Orange lines represent impulse bases on major timeframes, signaling the direction and validity of the prevailing trend by acting as key levels where significant momentum originated.
———
Stay grounded, stay present. 🏄🏼♂️
<<boost🚀 if you enjoy💚

GBPUSD // primary short trendThe valid trend is short on the W/D/H4 timeframes, and we are below the monthly impulse base.
A break below the last H4 breakout, in line with the daily counter-impulse base, results in targeting the next daily support very close to the daily target fibo 138.2.
———
Orange lines represent impulse bases on major timeframes, signaling the direction and validity of the prevailing trend by acting as key levels where significant momentum originated.
———
We may not know what will happen, but we can prepare ourselves to respond effectively to whatever unfolds.
Stay grounded, stay present. 🏄🏼♂️
Your comments and support are appreciated! 👊🏼

EURUSD // plan for the countertrend breakThe countertrend of the primary short trend is valid, and it turns into a primary long trend only above the daily impulse base.
Until it's traded below that level, the primary short trend may resume any time.
💰 The condition: significant break below the trigger zone.
Since H4 is already down, the next wave south has the chance to go to the first target, that is the daily target fibo 161.8.
———
Orange lines represent impulse bases on major timeframes, signaling the direction and validity of the prevailing trend by acting as key levels where significant momentum originated.
———
Stay grounded, stay present. 🏄🏼♂️
<<boost🚀 if you enjoy💚

GBPJPY // countertrend breakThere is a valid bull trend on the monthly and below.
The trigger level is the daily breakdown, which is in line with the break of the countertrend line.
If it's taken back by the buyers, the market enters in the daily long expansion phase, and the daily target fibo 138.2 in line with the next daily breakdown is my target zone.
———
We may not know what will happen, but we can prepare ourselves to respond effectively to whatever unfolds.
Stay grounded, stay present. 🏄🏼♂️
Your comments and support are appreciated! 👊🏼

The Best Phase of the Trend: The Expansion PhaseBeing a successful trader requires the ability to identify the phase of the trend with the highest probability of success.
The best opportunities arise during the expansion phase, where the prevailing trend resumes, pushing the market to new highs or lows.
This phase is characterized by swift, decisive market moves with minimal pullbacks, aligning strongly with the overall trend.
My Trading Steps:
1. Define the Primary Trend on the Daily
Identify the dominant trend (uptrend or downtrend) to establish the broader market context.
2. Look for a Countertrend on H4/H1
Spot corrections or pullbacks against the primary trend, signaling potential setups.
3. Find a Trigger Candle
Watch for a Marubozu-like candle at the zone of the countertrend line break or the last clean, untested breakdown.
4. Exit Rules
Exit the position if the price closes below the trigger line.
5. Take Profits
Target key Fibonacci levels and significant support/resistance zones. a countertrend on H4/H1
This is an 80% Setup: Targeting Fibo 138.2
The strategy has an 80% success rate when the target is set to the Fibonacci 138.2 level, calculated from the closing prices of the correction.
This precise targeting aligns with the expansion phase of the trend, ensuring high-probability entries and exits while maximizing potential profits.
———
We may not know what will happen, but we can prepare ourselves to respond effectively to whatever unfolds.
Stay grounded, stay present. 🏄🏼♂️
Your comments and support are appreciated! 👊🏼

ETHEREUM (ETH) // The daily structure broke with one impulse, and the correction of this impulse couldn't change to a primary trend expansion.
Yet...
This is the daily chart with the structure break:
If is stays like this (so, the new daily impulse base will stand), and the waves start to build south, the short countertrend's expansion phase will be a nice opportunity to ride the corrective impulse down to the correction fibo 38.2.
If this daily impulse base is taken back by the buyers (on the daily), the primary long trend resumes.
———
We may not know what will happen, but we can prepare ourselves to respond effectively to whatever unfolds.
Stay grounded, stay present. 🏄🏼♂️
Your comments and support are appreciated! 👊🏼

EURUSD // Back in the primary short trendWith the close on Thursday, the market entered into the primary expansion phase.
A countertrend break on the lower timeframes may push the price to the weekly zone again.
———
Stay grounded, stay present. 🏄🏼♂️
Your comments and support are appreciated! 👊🏼

SOLANA // idea for both directionsThe daily short countertrend is valid, and the market has reached the correction fibo 50 level.
The question is: will it reach 61.8?
If the market can significantly break the last clear H4 breakout significantly, it may have a chance.
If it turns up, and there is a significant (trigger) candle in the long trigger zone, my target is the weekly target fibo 200.
———
We may not know what will happen, but we can prepare ourselves to respond effectively to whatever unfolds.
Stay grounded, stay present. 🏄🏼♂️
Your comments and support are appreciated! 👊🏼

BITCOIN // primary expansionTrends are bullish on every major timeframe, and the countertrend may break, triggered above the H4 breakdown.
If triggered, my target is 106k.
———
Stay grounded, stay present. 🏄🏼♂️
Your comments and support are appreciated! 👊🏼

BITCOIN ($BTC) // Countertrend BreakEvery timeframe is bullish.
There is a countertrend on H4/H1, and my trigger zones at the highest clear breakdowns are marked by green.
My targets (purple) are target fibo levels at all-time highs.
———
Stay grounded, stay present. 🏄🏼♂️
PS: Please support with a like or comment if you find this analysis useful for your trading day! 👊🏼

NASDAQ // Primary Expansion?The trend is. long on all the major timeframes, and this H4/H1 breakdown (green) is my trigger zone.
If it's triggeren on M15, and the waves keep going up, my target is the daily target fibo 200 and the H1 target fibo 138.2-161.8 zone.
Exit the position if the structure breaks on the entry timeframe.
———
Stay grounded, stay present. 🏄🏼♂️
Your comments, questions, and support are greatly appreciated! 👊🏼

EURUSD primary downtrendEURUSD primary downtrend since 2008.
Zone around 1.128 is POC for period since October 2014 - in order to reverse downtrend EURUSD has to find acceptance above that level. Even an attempt to do that will take a year at least on that timeframe.
Week timeframe for close look
