Procter&Gamble: Short-Term Strength Still Fits the PlanPG has extended its rally, pushing turquoise wave C higher. While some selling pressure is starting to show, we’re sticking with our primary view: the stock should still break above $180.43 to complete beige wave b before turning lower. However, in our 37% likely alternative scenario, beige wave alt.b would have already topped, and the stock would next drop below $148.87.
📈 Over 190 precise analyses, clear entry points, and defined Target Zones - that's what we do.
Proctergamble

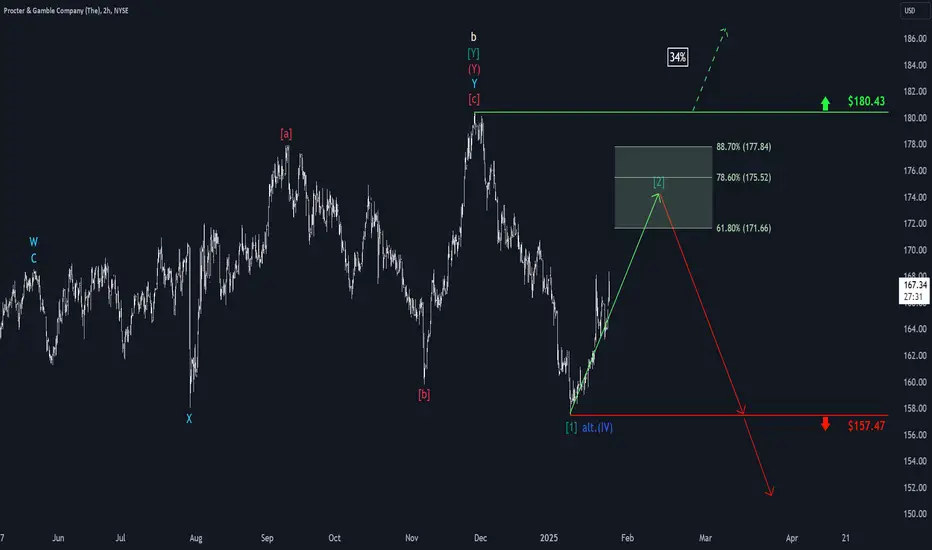
Procter & Gamble: Target Zone Ahead!Wave in dark green has been successfully completed, creating a new support level at $157.47 with its low. PG is currently working on the countermovement of wave , and we have outlined a Target Zone for the expected top (between $171.66 and $177.84). This price range could be an opportunity to take profits from long trades or establish new short positions. However, our alternative scenario, which allows for a breakout to the upside, holds a 34% probability. If the stock manages to climb above the resistance at $180.43, this will suggest that the broader uptrend continues. In this case, the low observed would not correspond to wave in dark green, but rather to wave alt.(IV) in blue. So, potential short positions could be secured with a stop-loss set 1% above the upper boundary of our Target Zone.
Procter & Gamble (P&G) Overview and AnalysisProcter & Gamble (P&G) is a global leader in consumer goods, offering a wide range of household, personal care, and health products. Their iconic brands, including Tide, Gillette, Pampers, and Olay, have made them a household name worldwide.
1️⃣ Past Performance: In their last two earnings reports, the stock jumped by ~12% after strong results.
2️⃣ Current Price: The stock has dropped to a key support level ($159), attracting buyers at a discount.
3️⃣ Upcoming Earnings: Set for January 22, 2025—a potential catalyst for movement.
4️⃣ Outlook: Analysts predict a price target of $209 by year-end, highlighting strong growth potential.

PGHL searching for a breakout.Procter & Gamble Health Limited is one of India’s largest VMS Companies manufacturing and marketing over-the-counter products, vitamins, minerals, and supplements products for a healthy lifestyle and improved quality of life.
Procter & Gamble Health Ltd. CMP is 5258.5. The Positive aspects of the company are Company with No Debt, Company with Zero Promoter Pledge and Growth in Net Profit with increasing Profit Margin. The Negative aspects of the company are high Valuation (P.E. = 40.1).
Entry can be taken after closing above 5264. Targets in the stock will be 5333 and 5477. The long-term target in the stock will be 5565 and 5600+. Stop loss in the stock should be maintained at Closing below 5156 or 4956 depending on your risk taking ability.
Disclaimer: The above information is provided for educational purpose, analysis and paper trading only. Please don't treat this as a buy or sell recommendation for the stock or index. We do not guarantee any success in highly volatile market or otherwise. Stock market investment is subject to market risks which include global and regional risks. I or my clients might have positions in the stocks that we mention in our posts. We will not be responsible for any Profit or loss that may occur due to any financial decision taken based on any data provided in this message. Do consult your investment advisor before taking any financial decisions. Stop losses should be an important part of any investment in equity.

PG The Procter & Gamble Company Options Ahead of EarningsIf you haven`t bought PG before the previous earnings:
Now analyzing the options chain and the chart patterns of PG The Procter & Gamble Company prior to the earnings report this week,
I would consider purchasing the 165usd strike price Puts with
an expiration date of 2024-9-20,
for a premium of approximately $2.05.
If these options prove to be profitable prior to the earnings release, I would sell at least half of them.

PG The Procter & Gamble Company Options Ahead of EarningsIf you haven`t bought PG before the previous earnings:
Then analyzing the options chain and the chart patterns of PG The Procter & Gamble prior to the earnings report this week,
I would consider purchasing the 155usd strike price Calls with
an expiration date of 2024-9-20,
for a premium of approximately $8.85.
If these options prove to be profitable prior to the earnings release, I would sell at least half of them.

PG CALLThe daily candle closed in green and appears to confirm the double bottom formation right on the convergence of two support lines - support trend line and psychological demand area at $155. Expecting with high probability to continue to follow the trend line and retest $162 zone.

PG The Procter & Gamble Company Options Ahead of EarningsIf you haven`t bought PG here:
Then analyzing the options chain and the chart patterns of PG The Procter & Gamble Company prior to the earnings report this week,
I would consider purchasing the 150usd strike price Calls with
an expiration date of 2023-12-15,
for a premium of approximately $2.84.
If these options prove to be profitable prior to the earnings release, I would sell at least half of them.
Looking forward to read your opinion about it.

PROCTER & GAMBLE This Bearish Cross is essentially a buy signalPG formed today a 1day MA50-100 Bearish Cross.
Primarily a sell signal, the last 3 occurences of this pattern have delivered higher prices.
All those patterns hit at least their prior Resistance level.
Additionally, the 1day MACD is 4 days into a Bullish Cross.
Buy and target 158.00 (Resistance).
Follow us, like the idea and leave a comment below!!

P&G - Bearish pattern on Procter&Gamble chart? Hello ,
Although I consider Procter & Gamble stock to be a very good long-term investment. (Safe background and very good dividend system. ) It seems to be working on a bearish pattern now, which is projecting a decline all the way to the $140 zone.
For me, it's the only stock I've held long since the $90 level, and I've been buying regularly ever since. It's like Coca-Cola to Warren Buffett to me. (Only I have a little less of it.)
For me, this seems like a good point for my long haul bags. If this pattern works, the price will reach the target zone by winter. If you have to choose between Procter & Gamble or Johnson & Johnson, P&G is clearly better in the long run.
Do not forget. These are my thoughts and observations about the market. And they do not constitute investment advice. Also, do your own research before entering a position.
Tell me what you think, and if you like my idea, share it with others.
Regards
In extreme cases, even $125 is possible, but I see very little chance of that at the moment.

PGHL aims to become PowerfulP&G has built a rich heritage since 1837. Procter & Gamble Health Limited is a company manufacturing and marketing over-the-counter products, vitamins, minerals, and supplements products for a healthy lifestyle and improved quality of life.
P&G CMP is 4959.80. The Negative aspects of the company are High Valuation (P.E. = 35.90) and Declining cash from operations annual. The positive aspects of the company are No debt, zero promoter pledge, FIIs are increasing stake, Mutual Funds are increasing stake and improving annual net profit.
Entry after closing above 4978 Targets in the stock will be 5072. Long term targets in the stock will be 5179 and 5300+. Stop loss in the stock should be maintained at closing below 4742.
The above information is provided for educational purpose, analysis and paper trading only. Please don't treat this as a buy or sell recommendation for the stock. We will not be responsible for any Profit or loss that may occur due to any financial decision taken based on any data provided in this message.

PG The Procter & Gamble Company Options Ahead of EarningsAnalyzing the options chain and the chart patterns of PG The Procter & Gamble prior to the earnings report this week,
I would consider purchasing the $152.5 strike price Calls with
an expiration date of 2023-8-4,
for a premium of approximately $2.97.
If these options prove to be profitable prior to the earnings release, I would sell at least half of them.
Looking forward to read your opinion about it.

P&G Target $135Procter & Gamble is in a weekly uptrend but was hitting its „head“ on the 158.00 resistance. After consolidating there it fell through the local higher low, building a new lower low and is currently retracing to that former local low which acts now as a resistance. The stock showed large sell volume on that resistance last friday which suggests we might se another break down to the current support at 135.00.
We have two problems to consider in this trade:
1. The XLP (Index for Consumer Staples, with P&G as its biggest position) is currently more on a support than resistance and might suggest an upward move. That could mean P&G breaks through the 150.00 and is heading higher.
2. The yellow trend line was not broken yet. As a price action trader this is more of a minor problem to me because trend lines are artificial and only an indication for specific price action but should not be mistaken as price action itself.
I therefore suggest to wait what happens today. If we see further downward movement, the trade could be taken. If we remain at the 150.00 resistance without larger sell volumes we should skip this one. Also, do not forget that consumer staples show steady performance during recessions and inflation periods because of the nature of their products. Not a primary concern for technical traders but it should be kept in mind.
—
🐻 Trade Idea: Short - PG
🔥 Account Risk: 1.00%
📈 Recommended Product: Knockout / Option
🔍 Entry: +/- 147.00
🐿 DCA: No
😫 Stop-Loss: 155.00
🎯 Take-Profit #1: 135.00 (75%)
🎯 Trail Rest: Yes
🚨🚨🚨 Important: Don’t forget to always wait for strong confirmation once possible entry zone is reached. Trade ideas don’t work all the time no matter how good they look. Do not get a victim of FOMO, there is always another trade idea waiting. 🚨🚨🚨
If you like what you see don’t forget to leave a comment 💬 or smash that like ❤️ button!
—
Disclaimer & Disclosures pursuant to §34b WpHG
The trades shown here related to stocks, cryptos, commodities, ETFs and funds are always subject to risks. All texts as well as the notes and information do not constitute investment advice or recommendations. They have been taken from publicly available sources to the best of our knowledge and belief. All information provided (all thoughts, forecasts, comments, hints, advice, stop loss, take profit, etc.) are for educational and private entertainment purposes only.
Nevertheless, no liability can be assumed for the correctness in each individual case. Should visitors to this site adopt the content provided as their own or follow any advice given, they act on their own responsibility.

Procter & Gamble is soon to see good times Ahead
TECHNICALS -
Procter & Gamble has formed a nice Positive Divergence or Hidden Bullish Divergence pattern on the Monthly chart indicating upside momentum on the chart
It has also Reversed Twice from a Strong Support level which had earlier acted as Resistance level indicating further upside potential for the stock
It has also tested 50 Day Moving Average and has reversed from it nicely
FUNDAMENTALS -
It is in the sector of Consumer Non-Durable Goods (healthcare & hygiene) which is an all-weather sector making the stock immune even to the upcoming recession (if it comes at all)
Its EBITDA & Net Profit Margin growth stands at 24% & 17% which beats almost 90% of its peers and ROE is at 31% which is the industry standard
If that's not enough then the stock also gives a dividend with yield at 2.72% and it has paid dividend for 133 years and raised dividend for 67 consecutive years, what could be a better alternative than such a stable dividend paying stock during the upcoming downturn in the market (if it comes)

Procter & Gamble to close its gap?Procter and Gamble Co - 30d expiry - We look to Buy at 149.61 (stop at 146.11)
The primary trend remains bullish.
This stock has seen good sales growth.
This is currently an actively traded stock.
We have a Gap open on 21/4/2023 from 150.85 to 154.94.
A higher correction is expected.
Previous support is located at 149.50.
We look to buy dips.
50 4-hour EMA is at 147.98.
Our profit targets will be 158.61 and 159.61
Resistance: 156.50 / 158.11 / 160.00
Support: 154.50 / 152.00 / 149.50
Please be advised that the information presented on TradingView is provided to Vantage (‘Vantage Global Limited’, ‘we’) by a third-party provider (‘Signal Centre’). Please be reminded that you are solely responsible for the trading decisions on your account. There is a very high degree of risk involved in trading. Any information and/or content is intended entirely for research, educational and informational purposes only and does not constitute investment or consultation advice or investment strategy. The information is not tailored to the investment needs of any specific person and therefore does not involve a consideration of any of the investment objectives, financial situation or needs of any viewer that may receive it. Kindly also note that past performance is not a reliable indicator of future results. Actual results may differ materially from those anticipated in forward-looking or past performance statements. We assume no liability as to the accuracy or completeness of any of the information and/or content provided herein and the Company cannot be held responsible for any omission, mistake nor for any loss or damage including without limitation to any loss of profit which may arise from reliance on any information supplied by Signal Centre.

Longing Procter and Gamble. YOLO. PGReversed dircetion, strong momentum on the previous hump with enough time and space to gain more ground. It sounds like a deal to me.

PG Proctor & Gamble Swing Long or InvestPG ( think soap, cleanser, laundry detergent toilet paper) is a stock that pays no
attention to market noise, In analysis terms, it is a low or no beta stock.
On a busy chart, the price is curently at the confluence of the SMA 50 21 and 9 averages
also sitting at the long-term VWAP anchored a couple of earnings ago.
It is also in the center of the high volume area on the longterm profile.
Earnings are steady and consistent typical of a reliable but slow-mover.
The rising MACD lines and the RSI piercing through its Ichimoto cloud
serve to further confirm that PG is in a confluence sweet spot.
I see this as a good spot to dollar cost average into a holding of 100 shares
to be used to sell monthly options for income or alternatively purchase
a call option contract at a strike of about $10 below current price with
DTE of 150-200 to make for a stable contract avoiding the market fluctuations.

Procter and Gamble to extend losses from corrective channel?Procter and Gamble Co - 30d expiry - We look to Sell a break of 135.66 (stop at 139.66)
Trading within a Corrective Channel formation.
There is no clear indication that the downward move is coming to an end.
Daily signals are bearish.
135.83 has been pivotal.
A break of the recent low at 135.83 should result in a further move lower.
Our outlook is bearish.
The bias is to break to the downside.
Our profit targets will be 125.66 and 123.66
Resistance: 139.50 / 141.60 / 144.10
Support: 137.00 / 135.83 / 133.00
Please be advised that the information presented on TradingView is provided to Vantage (‘Vantage Global Limited’, ‘we’) by a third-party provider (‘Signal Centre’). Please be reminded that you are solely responsible for the trading decisions on your account. There is a very high degree of risk involved in trading. Any information and/or content is intended entirely for research, educational and informational purposes only and does not constitute investment or consultation advice or investment strategy. The information is not tailored to the investment needs of any specific person and therefore does not involve a consideration of any of the investment objectives, financial situation or needs of any viewer that may receive it. Kindly also note that past performance is not a reliable indicator of future results. Actual results may differ materially from those anticipated in forward-looking or past performance statements. We assume no liability as to the accuracy or completeness of any of the information and/or content provided herein and the Company cannot be held responsible for any omission, mistake nor for any loss or damage including without limitation to any loss of profit which may arise from reliance on any information supplied by Signal Centre.

Procter & Gamble to break higher?Procter and Gamble Co - 30d expiry - We look to Buy a break of 154.72 (stop at 151.45)
Prices have reacted from 122.18.
Daily signals are bullish.
There is no clear indication that the upward move is coming to an end.
This stock has seen good sales growth.
154.65 has been pivotal.
A break of the recent high at 154.65 should result in a further move higher.
Our profit targets will be 162.88 and 164.88
Resistance: 154.65 / 157.00 / 160.00
Support: 149.00 / 145.00 / 142.00
Please be advised that the information presented on TradingView is provided to Vantage (‘Vantage Global Limited’, ‘we’) by a third-party provider (‘Signal Centre’). Please be reminded that you are solely responsible for the trading decisions on your account. There is a very high degree of risk involved in trading. Any information and/or content is intended entirely for research, educational and informational purposes only and does not constitute investment or consultation advice or investment strategy. The information is not tailored to the investment needs of any specific person and therefore does not involve a consideration of any of the investment objectives, financial situation or needs of any viewer that may receive it. Kindly also note that past performance is not a reliable indicator of future results. Actual results may differ materially from those anticipated in forward-looking or past performance statements. We assume no liability as to the accuracy or completeness of any of the information and/or content provided herein and the Company cannot be held responsible for any omission, mistake nor for any loss or damage including without limitation to any loss of profit which may arise from reliance on any information supplied by Signal Centre.

PG : Booked profitsThere are chances for the move to continue to a price of about 176$. But if the FED decides to raise the interest rate to 0.75 basis points in the upcoming meeting, then I expect further crashes, so I decided to take some chips off the table.

PG: Can we breakout?Procter and Gamble Co -
Short Term - We look to Buy a break of 148.20 (stop at 142.08)
The trend of higher lows is located at 138.75. This is positive for sentiment and the uptrend has potential to return. We are trading within a Bullish Ascending Triangle formation. A clear break of 148.00 and we would look for further gains to 163.00.
Our profit targets will be 162.98 and 172.00
Resistance: 163.00 / 172.00 / 180.00
Support: 140.00 / 130.00 / 120.00
Please be advised that the information presented on TradingView is provided to Vantage (‘Vantage Global Limited’, ‘we’) by a third-party provider (‘Signal Centre’). Please be reminded that you are solely responsible for the trading decisions on your account. There is a very high degree of risk involved in trading. Any information and/or content is intended entirely for research, educational and informational purposes only and does not constitute investment or consultation advice or investment strategy. The information is not tailored to the investment needs of any specific person and therefore does not involve a consideration of any of the investment objectives, financial situation or needs of any viewer that may receive it. Kindly also note that past performance is not a reliable indicator of future results. Actual results may differ materially from those anticipated in forward-looking or past performance statements. We assume no liability as to the accuracy or completeness of any of the information and/or content provided herein and the Company cannot be held responsible for any omission, mistake nor for any loss or damage including without limitation to any loss of profit which may arise from reliance on any information supplied by Signal Centre.

PG's Important ZoneGood morning / afternoon / evening.
Decided to do a short term view on one of my favorite stocks out there.
After a miss Earnings and reached Revenue PG fell Below weekly support indicating that the price can be seeing lower levels in August.
129.4 - 135.06 zone is gonna be playing a essential technical levels for PG's share.
A very brief breakout can happen if price confirms 129.4 below, My opinion on this would be; waiting for a confirming levels to start DCA-ing PG.
I will update this post again, If you are interested you can follow me on it.
Cheers.
Disclaimer .
Do NOT trade or invest based upon the analysis presented on this channel. Always do your own research and due diligence before investing or trading. I’ll never tell you what to do with your capital, trades or investments. I’ll also never recommend for you to buy, sell, long or short any asset, commodity, security, derivative or cryptocurrency related instrument as it's extremely HIGH RISK! You should always consult with a professional/licensed financial adviser before trading or investing in any type of assets.

Waiting for a double minimumHey thanks for this drop, I needed cheap prices to increase my fund. It perfectly recognizes the Fibonacci levels from the low of the covid to the recent highs. It would be interesting to enter a double bottom near the base of the uptrend channel. An update will be released in the coming weeks. Let's wait.
