NotcoinLook at that powerful trend line.
MACD also shows a good situation.
.
.
.
But if we look at the news, It may take a week for the price to increase.
Not too far Not too late.
Profitabletrading

#EURUSD - 13 MayEURUSD formed another green weekly candle last week. Could see further upside for this week. Friday was bearish though so near term is weak.
Price opened at the PZ and is rejected by it. Thus looking for possible longs, but only at 1.0761 and possibly 1.0745.
Price target for today, 1.0799 double resistance and if hold, 1.0829 next.

#EURUSD - 10 MayEURUSD made a slow grind down lower over the past few days but yesterday it moved down to make a new low off a level and rallied all the way up, forming a bullish daily candle. However it is still below last Friday's high thus question remains if market will form a lower high or we are looking for a move higher.
However, yesterday's price action does point to a move higher. I would prefer to have a down move, to 1.0753 (bottom of PZ) or 1.0743 for a long to target above levels, with 1.0833 as near term target.
If however, EURUSD moved up from here, I will look to try a short off 1.0825/35 for a move down to 1.0803 and possibly 1.0775.

Unboxing Profits: A Modern Twist on Darvas's Strategy with VWMAIn the mid-20th century, Nicolas Darvas turned a modest investment into millions, all while traveling the world as a professional dancer. His secret? The Darvas Box Theory—a trading method that identifies stocks exhibiting strong upward momentum confirmed by increasing volume. Fast forward to today's digital trading world, and we find that Darvas's principles are still relevant, but they're now supercharged with advanced indicators like the Volume Weighted Moving Average (VWMA).
Reviving a Classic with Modern Tools
Our "Darvas Box Strategy with Visual Signals" leverages the simplicity of Darvas's boxes and pairs it with the insights of a VWMA. This strategy script for TradingView is designed to illuminate clear buy and sell signals on your chart, providing you with a compelling visual cue that marries price action with volume.
The Anatomy of the Strategy
At its core, the strategy is built on two primary components:
Darvas Boxes:
These are virtual 'boxes' that capture the 'high' and 'low' of a stock within a specified period. As per Darvas's original concept, a new box is formed when the stock hits a new high. The top and bottom of these boxes serve as the resistance and support levels.
VWMA:
The VWMA provides more than just an average price level—it integrates volume into the mix, offering a weighted average price based on the amount of activity. This gives traders a sense of whether the price movement is supported by the market's conviction.
Bringing the Strategy to Life
Using the script, traders can set their preferred 'Length' for the Darvas Boxes and 'VWMA Length' to tune the strategy to their trading style. The strategy plots:
VWMA Line: A smooth purple line that trails the price, adjusting with the volume flow.
Darvas Boxes: Visualized by green circles for the tops (resistance) and red circles for the bottoms (support).
Signal Flares for Entry and Exit
What sets this script apart is its ability to provide distinct 'Buy' and 'Sell' signals:
Buy: When the price ascends past the bottom of a Darvas Box and stands above the VWMA, it's an indication of potential upward momentum.
Sell: Conversely, a dip below the top or bottom of the box suggests a possible change in tide, prompting an exit signal.
Custom Alerts for Timely Execution
Recognizing the right moment to enter or exit a trade is crucial. Therefore, our strategy includes built-in alert conditions, ready to notify you of emerging opportunities as they happen.
In Summary
This Darvas Box Strategy with Visual Signals is more than just a nod to a bygone era of trading—it's a dynamic tool that integrates historical wisdom with contemporary analysis, aimed at helping modern traders navigate the markets with greater clarity and confidence.
Remember, while this strategy offers a strong foundation, it's vital to engage it within a broader trading system that accounts for your risk tolerance and market conditions. May your trades be as graceful and deliberate as a dancer's steps, much like Nicolas Darvas himself.

Crypto MOBUSDT Caution Advised Manipulation Lead to Downward
Greetings, Traders!
🌟 Hello everyone,
It's important to exercise caution with MOBUSDT as recent price movements suggest potential manipulation, leading to a sharp 100% increase. However, this may not be sustainable, and a downward movement could deplete capital.
BINANCE:MOBUSDT
Key Observations:
- MOBUSDT has experienced a rapid and unprecedented 100% increase, indicating potential manipulation in the market.
- Traders should be wary of entering long positions at this time, as the price surge may not be based on genuine market demand or fundamentals.
- It's crucial to closely monitor MOBUSDT for signs of a reversal or correction, as entering long positions under current conditions could result in significant losses.
Technical Analysis:
Technical indicators may provide insights into the extent of manipulation and the likelihood of a downward movement in MOBUSDT. Traders should pay attention to key support levels and reversal patterns.
Fundamental Factors:
While fundamentals may have contributed to MOBUSDT's initial price increase, the rapid and unsustainable nature of the surge suggests underlying manipulation rather than genuine market demand.
Trading Strategies:
Given the potential for a downward movement in MOBUSDT, traders may consider adopting a cautious approach and avoiding long positions until there is more clarity in the market. Short-term trading strategies or staying on the sidelines may be prudent.
In Conclusion:
With MOBUSDT exhibiting signs of manipulation and a potential downward movement looming, traders should exercise caution and avoid entering long positions blindly. It's essential to prioritize capital preservation and wait for more favorable trading conditions.
Engage with Us:
🟢 If you find this analysis insightful, please give it a LIKE.
🟡 Don't forget to FOLLOW for more updates.
🔵 SHARE with fellow traders who might benefit from this information.
🔴 Feel free to COMMENT with your thoughts and insights!
Your active participation enriches our trading community, fostering knowledge exchange and collective growth. Share your feedback and ideas in the comments below or by boosting this post.
Looking forward to connecting with you in the next post.
Happy trading!

#GBPUSD - 28 MarchGBPUSD moved as per the plan given; I was bearish GBPUSD and it moved down nicely yesterday. Similar to EURUSD, GBPUSD opened just below the PZ and came down on open, to the support below and bounced strongly, to make new highs but it hit the strong level within the PZ and came down the second time.
But again the same 1.2617 level held with 2 bullish pin bars and GBPUSD moved back up again to close near the highs at the strong level 1.2639.
However this morning again, it opened and came down to the support level below and bounced off it with a bullish candle. With the current bullish candle, GBPUSD should move higher possibly back to 1.2639. A break above 1.2639 should signal a possible low and 1.2659 is next. If however, 1.2639 is able to hold the sell and GBPUSD is again rejected off it, should see further break, with 1.2681 as the probable target.

#EURUSD - 27 MarchEURUSD plan worked rather well yesterday. Sell level at 1.0855 given and it reacted well and sold down 25 pips to new lows. I did consider a break above 1.0855 to possibly see further upside but my bias is to the downside possibility and it worked out well.
Bearish Tuesday indicating further downside but bullish Monday indicating support. I am of the opinion of the move lower. Overall, IMO as long as 1.0851 holds (but IMO max pullback is to 1.0845) look for further downside to 1.07995 double support.
Could bounce from there while whole structure is kept intact. A close below this level is bearish for further downside.

#EURUSD - 26 MarchEURUSD sold off on last Thursday post FOMC, and further on Friday hitting the 61.8 Fib and also my strong level. I said EURUSD could come down from the PZ but I was of the opinion of a further pullback before downside. My sell level was at 1.0851.
Yesterday was a slow moving day IMO as EURUSD just based and slowly moved above the PZ and did not hit the 1.0851 level but price has gone up further today on open and is approaching that level.
Price action yesterday is bullish thus question is if we will see further upside. I would say to watch the 1.0851 level. A rejection off the level would be a possible next leg down to target previous low at 1.0799 strong level before further downside to 1.0759. Will not discount the possibility of a break above, in which 1.0899 will be the upside target. I am leaning towards the downside for today.

#EURUSD - 25 MarchOn Thursday, EURUSD reversed the FOMC rally, which I said is very bearish and we could expect further downside on Friday. Indeed, EURUSD sold off further on Friday for a good 60 pips, closing near the lows.
Weekly price action is bearish thus expect further downside for this week. However, EURUSD is bouncing off the strong 1.0799 monthly level.
Price has pulled back to the PZ and is reacting off it. Overall, looking for a move lower, though it could come from here, 1.0851 IMO. Price target would be 1.0761 is likely magnet. but if break, 1.0711 is next.

#SPX - 22 MarchSPX was much sideways yesterday after the rally on FOMC the day earlier. SPX opened and moved up to first resistance before pulling back, but did not touch the bottom level. Some weakness towards the end of day as it is unable to go higher. Still SPX closed green.
I said I will scalp for the pullback. It was not easy as there were "strange" rotations between strength of DJIA and NDX, though eventually there was a pullback. What's for today?
I would say, not easy to say, so trade using the levels. Highs is definitely not in yet; just whether we will get a pullback before further up. And even if one gets a pullback do you trade this pullback.
Price is at the PZ now; sure it can go up from here; and if it breaks, 5243 double level support is there which is another bounceable level.
I would go for a move down to 5225 before the bounce though. This would be based on SPX breaking 5253 and NDX breaking 371 for the move lower.

#EURUSD - 21 MarchEURUSD's plan worked out perfectly yesterday as per the path given. I gave a long from 1.0837 level and it hit the level perfectly before rallying 100 points beyond my target.
What is it for today? Price action is bullish, bias is to the upside, but in what manner will it move? IMO, I see a pullback before further upside, thus I would wait for one (and possibly missing the trade).
I see a pullback to PZ before further up. How deep into the PZ I have no idea but IMO, 1.0881 will be ideal, while even 1.0865 dip is still bullish to me for the move higher.

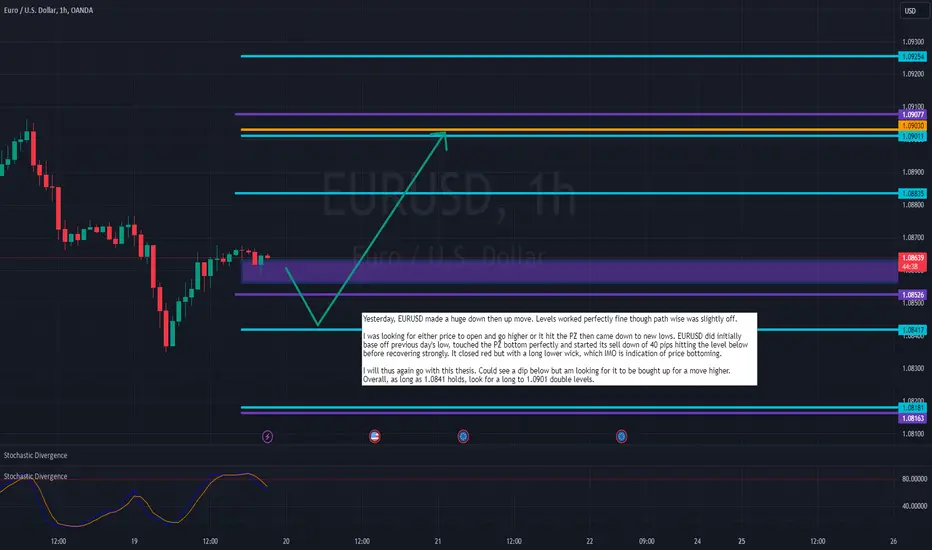
#EURUSD - 20 MarchYesterday, EURUSD made a huge down then up move. Levels worked perfectly fine though path wise was slightly off.
I was looking for either price to open and go higher or it hit the PZ then came down to new lows. EURUSD did initially base off previous day's low, touched the PZ bottom perfectly and started its sell down of 40 pips hitting the level below before recovering strongly. It closed red but with a long lower wick, which IMO is indication of price bottoming.
I will thus again go with this thesis. Could see a dip below but am looking for it to be bought up for a move higher. Overall, as long as 1.0841 holds, look for a long to 1.0901 double levels.
#EURUSD - 19 MarchEURUSD made a good up move then sell down. I was looking for the up, and it did go to the level given, though my target was the one above. Still there is money to be made.
And we got a good perfect rejection off the double resistance level and it flushed lower. Price action looks bearish and point to further downside. I shall not fade that, though personally I am not that bearish, thus I would likely step aside.
Ideally, if I were a seller I would like a pullback to go short into, and that pullback would be at the PZ. If I am a buyer, I will look for a failed test of yesterday's low (yellow line) and a bullish reversal candle for a long, to target the PZ then yesterday's high.
If somehow EURUSD does tank for a trend day, 1.0817 will be the level to watch to take profits off shorts and look for long for a bounce.
Do note I changed the color of the lines - cyan is intraday levels, purple is weekly levels and orange monthly levels to indicate strength of the levels.

#EURUSD - 18 MarchI was looking for a possible bearish continuation on Friday, but it was much a ranging move on Friday. Market did move higher to re-test the PZ (though the bottom) and market found a rejection at the bottom and closed near the mid point of the range.
We have a green daily candle for Friday. Is market consolidating before further down or is the near term low made and market is going to move higher?
IMO, EURUSD is looking to bottom and thus IMO EURUSD will move higher from here, find resistance above before possibly coming down.
Price is at the PZ. A break above PZ would see further move to 1.0901 and 1.0907, both of which are higher timeframe resistance.
IMO could see a test of 1.0909 and pullback, and if price can be accepted above 1.0901, EURUSD will move higher

Trading Tips - 5 Simple tricks1) Look for trend - Trend is Friend
2) Enter small size position - Start small
3) Ride the trend - Up or Down
4) Set your exit plan - Take profits or Cut loss
5) Higher highs & Lower lows - Can be your exit strategy

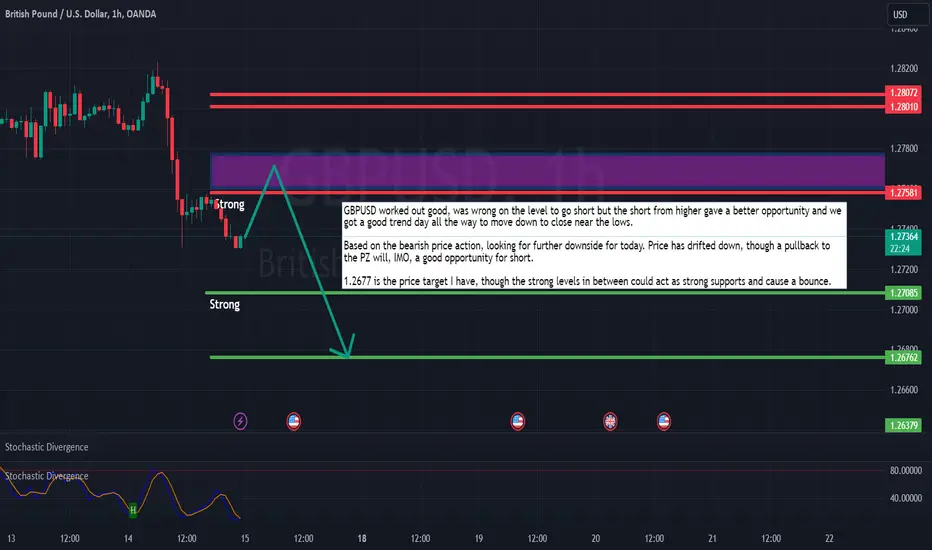
#GBPUSD - 15 MarchGBPUSD worked out good, was wrong on the level to go short but the short from higher gave a better opportunity and we got a good trend day all the way to move down to close near the lows.
Based on the bearish price action, looking for further downside for today. Price has drifted down, though a pullback to the PZ will, IMO, a good opportunity for short.
1.2677 is the price target I have, though the strong levels in between could act as strong supports and cause a bounce.
#GBPUSD - 14 MarchI am looking for a move lower for GBPUSD yesterday on rejection off the 1.28 strong level. GBPUSD did close slightly higher but overall GBPUSD is much in a tight range yesterday and GBP is weak. Overall, it is anyone's guess what would be the next direction but regardless, trading based on the levels would work. But I would say that, I am looking for 1.28 to hold as resistance and have a move lower especially on the break of the PZ to possibly re-test Tuesday's low.

AUDNZD,🔴Sell Opportunity🔴
As you can see, the price took the liquidity that formed as a high in Daily FVG, had a bearish reaction, and shifted the market structure.
Now the price trades inside the bearish order block that we expect to push the price lower.
We need the LTF confirmation for entry.
💡Wait for the update!
🗓️13/03/2024
🔎 DYOR
💌It is my honor to share your comments with me💌

#EURUSD - 13 MarAlgo levels worked perfectly yesterday as both the lows and highs for the day for EURUSD were perfectly given by the levels. Lots of opportunities on both longs and shorts. EURUSD closed with a doji candle which is some sort of indecision.
TBH yesterday's CPI data is hotter than expected but not a lot; thus market did not really care. But IMO, price action for EURUSD looks toppish now, thus we could get another move down. A break of PZ would be to target the 1.0905 double support level.
If sellers can bring EURUSD below 1.0905, could see further selling to below supports.

#DAX - 6 MarI was looking for a move lower for DAX yesterday and we got the move (). Levels worked perfect despite the somewhat choppy movement (DAX was strong despite weakness in the US indices). The strong level below held perfectly while the level above also provide a good short during the US session and mentioned in the group chat.
If I look at the daily candle, price action still looks bearish and toppish to me. I am still in the opinion of weakness in DAX for today.
Currently DAX is rather strong; so I am not surprised if DAX test the 17743, form a double top but come down lower, with 17657 as first target and further down to 17565. If I am right on the down move today, I would think the magnitude of down move will not be as significant as that of yesterday.
But do note that Powell will be speaking today. Not sure what he will say, but IMO market is bulled up for rate cuts. If Powell say something about not cutting rates, that will be bad news IMO.
Looking for a bounce off the 17565 level, but if break, strong levels below would be 17479 and 17417.

#EURUSD - 5 MarYesterday I was looking for EURUSD to test first resistance at 1.0857 which is the level to watch for a possible rejection for a lower high, or a move higher. Indeed, 1.0857 worked good for a 15 pips sell off the level. However, after a double re-test, EURUSD moved higher. Still it would be a breakeven or a small profitable trade.
EURUSD closed green which looked to be more bullish than bearish. But from current looks, EURUSD is still much in range and it hit the highs yesterday, formed what could be a double top given the rejection.
I would look for price to keep below OP 1.0855 for a possible down move to 1.0833 before further upside. 1.0833 is key level to watch; a break below 1.0833, and a daily close below this key level could bring further downside.

#DAX - 4 MarOn Friday we saw a change in the strength of DAX as it hit new ATH but came down after while US indices was stronger and rallied to ATH after. Some rotation that is, given how DAX was rallying the days prior, while US indices, especially on Thursday, dipped and recovered, setting up for the continuation on Friday.
DAX I gave a long from bottom of PZ but DAX hit the mid of PZ and recovered 70points. Price is opening at the PZ now.
Overall we can see weekly price action is bullish so could see further upside this week, but I am not discounting a possible pullback first. A pullback to 17459 will still not change the trend.
Daily wise, bearish divergence so could be sign for a pullback. Could do a short below 17753 PZ, or wait for the longs after a pullback.
Target for short would beg to 17629/47 which is a strong level, and would give an opportunity to look for longs for a move higher. If market continue to go up from here, I would like to take a counter trend short at 17845 back to PZ.

VALUE in SBI CardsSince the past three years, business profits have been on a rise, whereas the stock has delivered negative returns. The stock is considerably cooled off and a new rally is awaited.
I encourage you to study these developments and keep in mind that any decision involving financial consideration will be completely at your own risk. This post, like all others on my channel are for educational purposes only.
