Profits

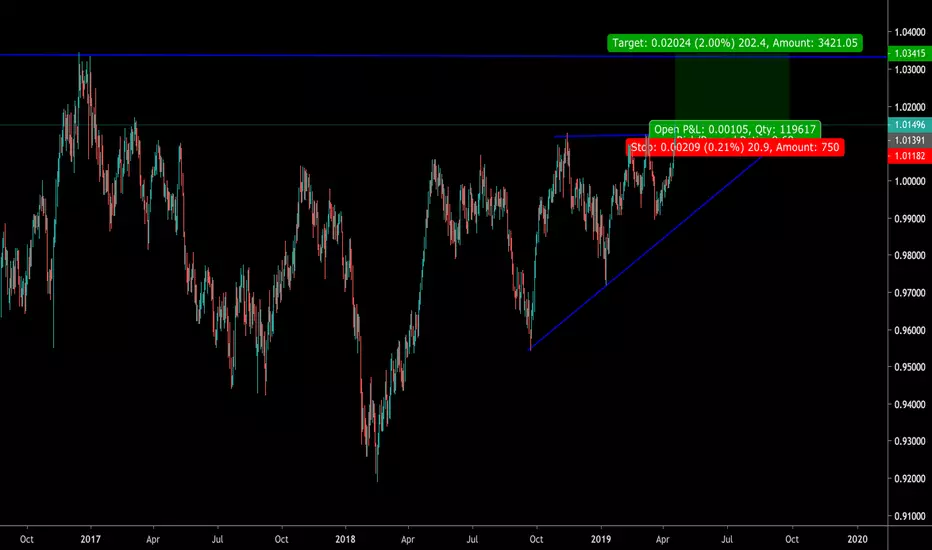
AUDJPY showing signs of MACD convergence, AUD ready to shoot up?AUDJPY H4, showing signs of very strong convergence, market clearly going the opposite way to our indicator.
A counter trendline has been put in place for more clear break and retest and entry scenarios.
Targets are also drawn.
On the right we have AUD weighted index H8, where we can see it has tapped off a clear demand zone, I believe we can see some reaction, and AUD can start to gin some strength, pushing AUDJPY to the upside.
@PipsOfPersia
t.me/pipsofpersia

ECPG Has Rare HFT PatternHFTs rarely trade a stock more than one day. ECPG has 2 days of HFT action moving the stock with strong momentum with high volume. Often VWAP orders from smaller funds will trigger after an HFT run day. The stock breached resistance but is at risk for professional traders taking profits. ECPG is an S&P 500 index component.

MANA/BTC 300% to 600% P.P.Hello Friends,
Here is another tricky chart that shows nothing but a continuous channel. All it does is stay within the confines of this channel rarely breaking above the upper channel or below the lower channel. There has been 4 incidences when we saw a spike pass through the upper channel, 3 of which did so in a dramatic fashion and quickly reversed back into the channel. Now we have seen something new on two occasions. The lower channel has been breached and for the first time MANA is oversold.
What does all this mean? If we look underneath the lower channel, we can see several arched green arrows that spans a distance from one high to the next high. Notice how there is a pattern within the arches? The first high touched the upper channel, the next 2 highs were extreme spikes. That is 1,2,3 then the pattern repeats. 1 touches the upper channel, then the following 2 will breach the upper channel. If the pattern holds, then we are due for a spike "if it happens", we are at a 3 count within this crazy pattern idea.
Now let's look at this chart in a realistic way. MANA has never been oversold just as it hasn't breached the lower channel, this tells me we can expect a powerful move upward because we are oversold and had a breach of the lower channel. The indicators for TDS is at a 9 (signal) and there has been a continuous buy signal coming from Bill Williams Fractal ever since MANA became oversold. Fractal says only to buy and not sell. TDS is past the 9 count and in limbo. We are at rock bottom and what goes down must come up at some point. I think we are at that point now.
The other point is that this is a price channel and is on the bullish side of the tracks. The channel itself has not been able to maintain the predictable move up even though on 3 occasions, MANA has surpassed channel expectations. There is a possible chance this time around that when MANA moves to the measured expected move up "seen on this chart as channel target" that it will maintain this position as support in the near future. The biggest advocate is BTCs bull market of late, which has a great influence upon most ALT coins.
Details on the Chart.
This is my viewpoint and my opinion. I am not giving advice but only sharing what I see. Do not enter a trade on my TA but do your own homework.
Cryptocurrency is volatile and very risky. Never invest what you can't afford to lose and always educate yourself and continue to do so when making any kind of investment.
If you find this information helpful, then please hit the like button. Your support is appreciated. Thank you!
CYA on the next one...until then, the trend is your friend. Buying on the dip and selling on the hype.
Cheers!

GBPUSDGBPUSD, this is pure price action. I'm not sure what's taking place from a fundamental analysis, I'm seeing that price is likely to move in favor w/ Bull-ish momentum after printed an inverted head and shoulders formation.

USDJPYUJ's been consolidating for some time now. however we've got some dynamic support hovering below price. The moving averages are a powerful indicator for where price is predicated to go next.

NASDAQMy bias with the NASDAQ is similar to the S&P, with all time highs played as resistance; the market may sell off. This could be the turning point for a Bear's market, or a minor pull back for new ATH's.

ARW: Selling Short Profits with HFTsARW is one of many stocks that declined recently. HFTs gapped and ran the stock down. In order to capture these high profit runs down, entries must be made prior to the gap.

Repeat The History!!!!! Simple & Clear! Repeat The History!!!!! Simple & Clear!
In Trading often old supports and resistances are used for trading.. And so is the case with my this setup.... Prices fallen exactly from old highs and going exactly to same lows it made last time.. (plz. check left of chart and red horizontal lines)
Buy limit: 57.5
Stop Out: 53
Take Profit: As per your appetite :)

EUR/USD - Weekly Time Frame and 364 Day AnalysisEUR/USD will be my go to pair for the year. Price is close to Minor Support Level. We currently have two bullish candles at the minor support level but there is a bearish engulfing before it. I envision a little pull back to the upside and final breakthrough to the downside or breakthrough to the downside for the longterm. The Bears have momentum on their side. I'm rooting for the Bears in this run because this could mean some solid trade opportunities along the way. I also call the minor support level "minor" because it has a number of break throughs = +5. Could this be breakthrough #6 or am I just completely wrong? We'll find out folks.
Let the Trading Commence.
Trading Journal Entry 2
05/06/19

BTC : 90% Mid Term Profits Achieved.Dear TWA subscribers its been a while since our team posted technical analysis forecasts here in trading view. we are glad you are still here with us while we were not doing our telegram trading channel on an active basis. This is mainly because of the market behaviour we have seen in thw last few months in addition to the works we have been doing specially related to our newly blockchain project which will make our service the best of all times. As we tried to explain it to you in earlier posts we are also doing fully studied and well organized trading tutorial materials which are going to available in few weeks. Our trading tips and signal posts will start to be posted in the very near future with our analysis team (in which brings additional well know traders across the globe.) We are still confident that our services were one of the best trading analysis teams and we will continue to give you guys the tips to gain high profits in short days. We would like to apologies for our passive activities regarding our services and we are looking forward in a postive angle that,you, our loyal subscribers will grant us a positive note on our apologetic approach. Let you give us your opinions on our services anytime as usual and we will be there to give you replys regarding any of your demands. We will post our weekly post schedules this week and services will start to be given again in an active manner.
With Regards.
#Team_TWA .
Regarding our last call on Bitcoin we achieved almost 75% profits on our midterm prediction in around 90 days. Our Mid term target on from mid December is already achieved. A total of 75% profits and for those who waited patiently a total of 90.6% profits in just 3 months.

EURUSD- Long position
This pair has reached its lowest price since June 2017. The price has risen this week creating a uptrend. This uptrend has reached a key level where it developed a resistance that created a retracement of 61.8% (4:H). This retracement also happens to be in a major support level which makes me believe its the perfect time to go long.

RVN/BTC Moon? Elliot Wave #3 Begins.Hello Friends,
Just like the title says, we have possibly begun wave #3 within this weekly elliot wave cycle.
There are some interesting points to make here about the indicator and oscillator on the weekly chart. I haven't included the RSI but have noted that the RSI is in the neutral zone. As seen on this chart we have a strong bullish divergence between the CMF and OBV. Wave #2 has retraced to exactly to the 0.0168 fibonacci level and began to make progress upward. The other interesting point is that the fib bounce is in concert with the 20 EMA. So the 20 EMA is acting as support for right now. Take note that the current Japanese Candle is showing a bullish hammer candle within the buy zone of the recent retracement on this chart. Elliot wave #2 has also created a descending price channel which is also bullish.
I have supplied the support along with the stop loss if anybody is interested in this trade. In addition to that I have giving a forecast of where RVN might go within the acceptable fib levels. Wave 3 may only make it to fib 1.618 which will affect wave 4 and 5; keep that in mind, and watch carefully as we approach this level.
Details on the Chart.
This is my viewpoint and my opinion. I am not giving advice but only sharing what I see. Do not enter a trade on my TA but do your own homework.
Cryptocurrency is volatile and very risky. Never invest what you can't afford to lose and always educate yourself and continue to do so when making any kind of investment.
If you find this information helpful, then please hit the like button . Your support is appreciated. Thank you!
CYA on the next one...until then, the trend is your friend. Buying on the dip and selling on the hype.
Cheers!


RVN/BTC Re & Re Wave #3Hello Friends,
Slight adjustments were made to this chart that I had previously published. However the point remains the same and thus nothing changes but a few minor adjustments were made as explained below.
I noticed after the fact that I was missing the first wave correction fib. Also noticed that my fibs moved slightly, must of bumped clicked and they moved slightly (not much to make a difference) but however here is the correction to that.
Take note the red 843 sats mark on the scale to the right was the 20 MA at the time of my last publication. The 834 sats is the green support stop loss where RVN bounced along "within" the bounce zone of the 0.618 fib retrace. This is just to be clear for those who like to be critical and can't see the forest for the trees.
Cheers!

USDCAD GETTING READY FOR TAKEOFF??USDCAD is showing signs of bullish continuation & we'll start looking for signs of a reversal around 1.3380 - 1.3350 region.
Overall we see this pair pulling back up towards 1.35000 region and possibly 1.36000 region.

GBPUSD D1GBPUSD D1
GU is in a similar situation to NU where we’ll be waiting for a correction to the upside where price could potentially find resistance & show some type of bearish reversal around 1.3030 - 1.3100 resistance before taking shorts back down towards 1.2900 - 1.2800 support region.

Stone co stock price analysisCompany: Stone co
Quote: $STNE
BT: $22-$24 (if we get it ) Pending how the shorts play this could bounce back quickly or slow bleed to cover, no need to catch a falling knife so hawk it if interested, tapes will tell a lot better story
ST: $32
Next Earnings Date:
Description: StoneCo Ltd. provides financial technology solutions that empower merchants and integrated partners to conduct electronic commerce across in-store, online, and mobile channels in Brazil. It distributes its solutions, principally through proprietary Stone Hubs, which offer hyper-local sales and services; and technology and solutions to digital merchants through sales and technical personnel and software vendors. As of June 30, 2018, the company served approximately 200,000 clients, which included digital, and brick-and-mortar merchants, primarily small-and-medium-sized businesses; and 95 integrated partners, such as global payment service providers, digital marketplaces, and integrated software vendors. The company was founded in 2012 and is headquartered in São Paulo, Brazil.
Short Interest:
Short Percent of Float 20.46 %
Short % Increase / Decrease 3 %
Analyst Ratings: Stock Price Target STNE
High $47.00
Median $40.00
Low $20.00
April - 05 - 19 Downgrade Citigroup Buy - Neutral
March - 21 -19 Re iterated Morgan Stanley overweight $35 - $47
Jan 15 - 19 Initiated BofA/Merrill Buy $26
Nov 19 - 18 Initiated JP Morgan Neutral $25
Tapes last week: 3/5 buying started picking up near the end of the week but rather bearish.
Please subscribe to our facebook and twitter. To get the analysis directly to your mail subscribe to our newsletter.
Facebook - @SFYBUofficial
Twitter - @SFYBUofficial

USDJPY LOOKING GOOD FOR BULLS!USDJPY is showing some great bullish potential and is currently consolidating ( trading sideways) and creating bullish divergence.
I will be looking for a bearish retracement of 50% of the bullish impulse move ( point 1 to point 2). Should price moved towards this zone, I will be going long with 1% capital risked.
Considering price is consolidating as such, there is a possibility that price may re- test the trend line and go long from there. I will update my analysis accordingly.
SL (Red line) - Should price move to this zone my edge will be invalidated.
TP (Green line) - Take profit is set at twice the length of the retracement thus creating an opportunity with a 1:2 Risk to reward.

BUY OPPORTUNITY ON CADCHF!Here we go again...
Another buy opportunity and this time on CADCHF.
Daily time frame analysis shows this pair having strong bullish momentum. Price has reached a strong resistance zone where we may potentially see price retrace before moving bullish again.
I will be looking for price to retrace bearish to the 50% Fibonacci level whilst creating bullish divergence. This would be a good opportunity to buy.
Both stoploss and take profit have been marked.
RR = 1:2
Capital risked - 1%

70%-120% LONG POTENTIAL!Hello guys here is why I think we are going to mini-moon in the next month or so
1. Have been bleeding for a LOOOOOONG TIME
2. Trading and holding above 200 EMA for the first time in a loooong time
3. Bullishly broke a pennant pattern yesterday
4. 55 EMA Bullish crossed with 100 EMA (Pink EMA line) (Daily TF)
5. Broke and held 2900 resistance which is now support.
6. Target 1: 5000 sats
Target 2: 7000 sats
Trade at your own risk. I am not a financial adviser.

USDCHF, new highs and pullbacksprice has broken long term resistance, stf analysis needed for execution, 200 pips in play...
EVENTBRITE INC Stock analysisCompany: Eventbrite INC
Quote:$EB
BT: $20.90
ST:$28 (selling before earnings on may 1st would be ideal)
Description: Eventbrite, Inc. operates a ticketing and event technology platform in the United States and internationally. Its platform integrates components needed to plan, promote, and produce live events that allow creators to reduce friction and costs, increase reach, and drive ticket sales. The company was formerly known as Mollyguard Corporation and changed its name to Eventbrite, Inc. in 2009. Eventbrite, Inc. was incorporated in 2008 and is headquartered in San Francisco, California.
Short Interest:
Short Percent of Float 26.11 %
Short % Increase / Decrease -32 %
Tapes last week: 4/5 very bullish (shorts are covering if you notice above compared to last week)
Please follow our facebook and twitter.To get analysis directly to your mail please subscribe to our newsletter
Facebook - @SFYBUofficial
Twitter - @SFYBUofficial
