EUR/GBP: Free Sell Signal Is Ready For You Don't Miss It This Is An Educational + Analytic Content That Will Teach Why And How To Enter A Trade
Make Sure You Watch The Price Action Closely In Each Analysis As This Is A Very Important Part Of Our Method
Disclaimer : This Analysis Can Change At Anytime Without Notice And It Is Only For The Purpose Of Assisting Traders To Make Independent Investments Decisions.
Profits

Gold: New Setup With A Detailed Analysis You Can Enter NowThis Is An Educational + Analytic Content That Will Teach Why And How To Enter A Trade
Make Sure You Watch The Price Action Closely In Each Analysis As This Is A Very Important Part Of Our Method
Disclaimer : This Analysis Can Change At Anytime Without Notice And It Is Only For The Purpose Of Assisting Traders To Make Independent Investments Decisions.

AUDCADIn AUDCAD after market test its strong resistance trendline at 0.91059 price drop to 0.90930 after the market open if price break market structure 0.90830 than you go for short position and exit on the coming support which i draw in the charts. if price come back and push to upside than wait for the trendline resistance again test if you see again some strong bearish candles than you go short with very good R:R.
ENTRY SHORT 0.90808 AND 2ND 0.91049
TAKE PROFIT 0.90561
TAKE PROFIT 0.9030
STOP LOSS 0.91171

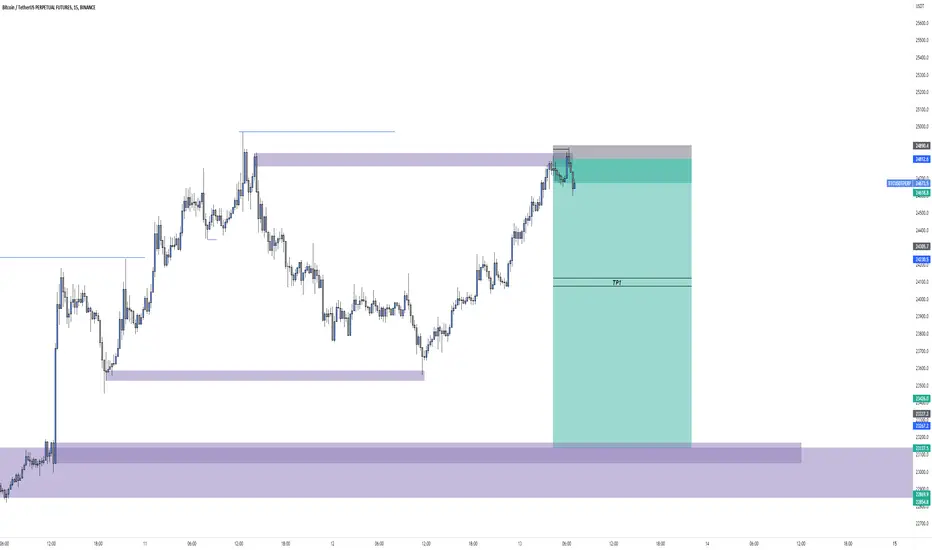
BTC Short setupShorting BTC till the first TP :) good luck.
BTC seems kinda bearish to me.. I`ll take the risk and short it from here.
SRM/USDT long positionSRM/USDT long high risk position , this coin gives profits a lot!!!
open: 1.027
Target 1: 1.060
Target 2: 1.085
Target 3: 1.110
Stop: 1.015
hope you enjoy it

Jubilant FoodworkWhenever break 0.5 Fib retracement with the good volume then long position is start

One final drop for natural gas and then a massive bull runWe're looking for one final drop in natural gas prices to complete a wave C for wave 2 before we will start accumulating positions to go long for the next bull run in natural gas. There's an energy crisis that isn't going to disappear anytime soon, there's plenty of fundamental reasons for this huge move we're expecting in wave 3. But in the mean time we're short on natural gas until this wave C is complete.

Shorting AUD/USD on the basis of S&R !! #ShortShorting AUD/USD on the basis of S&R !!
This trade is for Educational Purpose only.
The Goal is to highlight the importance of Support & Resistance zones (S&R) and how can Weak and Strong zones be identified.
Support & Resistance (S&R) can play vital roles when it comes to trading. Most traders use S&R in order to look for precise entries and exits.
The Pair has been Bouncing off from zone Marked in Red which acted as Support earlier. The Support was tested four times.. Soon it was broken with strong Bearish Candle. The more touches/bounces the Support zone had, the weaker it got and as a result it got broken. Often time Support acts as Resistance zones and Vice versa . It is important to note that S&R can act as a strong Confluence but trading just on the basis of it alone can be dangerous. Using other Confluences such as Market Structure, Divergences and Chart Patterns such as Double Top/Bottom are equally important. Since Trading is the game of Probability, it is Essential to have more than One Confluence.
The Trade Plan:
The trade plan is to Short AUD/USD, once it re-tests the broken support zone which is now likely to Act as Resistance.
Note: Take this trade after doing on your own analysis.
Target:
Target is set on the basis of Fibonacci Re-tracement which comes in between 0.618 & 0.5.
Stop Loss:
Stop Loss is simply set on the basis of 1:3 Risk to Reward Ratio.
Time Frame used:
1H
Analysis based on:
- Market Structure
- Support & Resistance.
- Fibonacci Retracement tool .. used for setting Target

Head & Shoulders Pattern Formed on GBP/USD !! #ShortHead & Shoulders Pattern on GBP/USD !!
The Head & Shoulder Pattern seemed to have formed on 4 Hour, I will wait for
Retest of Neck-Line before Shorting GBP/USD .The Risk to Return ratio is 1:3. It can be a really good trade if executed correctly.
Target is chosen by Measuring the Distance between Neck-line and the Head , further the same distance is then used after Break of Neck-line to establish correct Target area.
Stop loss is set where the Price is least likely to get hit hence the 1:3 RR.
note: Do your own analysis before taking the trade.
Analysis based on;
1, Price Action
2, Chart Pattern
3, RSI - Overbought/oversold zone
4, Candle-stick Pattern
Time frames used:
1 Hour
4 Hour

ENJOY YOUR WEEKEND FAMILY!!!! EURUSD has LEFT THE BUILDING!!!! "They that wait upon the Lord shall renew their strength.
They shall mount on wings of eagles and soar!' Excerpt from Isaiah 40:27-31
Patience and Discipline.
Patience to wait on your trade set up.
Discipline to stay with the BIAS determined for your set up aka Trading With the TREND.
If you followed my previous post you're gonna have a GREAT WEEKEND$:)! Treat yourself to something nice. Take your family out for ice cream.
Then re invest back into your account to compound again next week! This is a 7 TRILLION DOLLAR SPACE we are BLESSED to be apart of daily.
My Mandate is to show you where the $ is flowing and point you in the right direction. Mission complete.
Never over leverage.
Trust your trade set up.
Have fun!
I AM Pro Trading Made Simple.
We are #SniperGang

US30 : Hitting the target Few hours ago I’ve analysis for the US30 and I expect it will go down touching demand

PRICE ACTION WILL LEAD YOUActually didn't plan to open up a lot on this video, but here goes my complete breakdown of Ethereum market structure, levels i'm looking at and my positive relationship with price action. Sincerely wish one young trader like me finds this helpful. luv

PUBM - retest of the diagonal trendlineThis stock gas been such a trainwreck. Company that actually has a nice product and makes money. Earnings coming soon. P/E ratio 15.78. It tried to make it out of the trendline but failed. Now retesting. Let's see.

UPDATE: MATIC UP 82% after bullish daily signal MATIC pumped 82% after the bullish Supertrend Ninja - Clean signal (green vertical line on the background).
MATIC broke out of the bullish Zone of the Ichimoku Cloud , which is bullish. The RSI is in the bullish zone at 68. If we take a look at the Average Directional Index ( ADX DI) its bullish. The +DI (Green Line) is above the -DI (Red Line). While the Trend Strength is becoming stronger. Since the ADX (Orange Line) is above its 9 Period EMA (Black Line). Currently MATIC is also above its Bollinger Bands Middle, Band Basis 20 Period SMA and the Least Squares Moving Average (LSMA). Which are a bullish signs as well.
Waiting patiently on a bullish Supertrend Ninja signal, before entering a long paid off.
Thank you for reading.
Namasté 🙏
Disclaimer: Ideas are for entertainment purposes only. Not financial advice. Your own due diligence is highly advised before entering trades. Past performance is no guarantee of future returns.
What Indicators Do I Use:
In the chart I am using the "Supertrend Ninja - Clean", which is a trend-following indicator (Green and red vertical lines on the background). When the background of the candlestick closes green (vertical line). It indicates a possible bullish (up)trend. And red for downtrends.

TP REACHED!!! CORN FUTURES SELL CALL OUT BY JOHN THE FOREX GUY!Guys we have finally reached our take profit level I linked the first video whereby I explained how and why i took the trade I'm finally closing the trade with massive profit as you can see for yourself

TSLA short term sell signalTSLA Financial Analysis
Income Statement
- Income, Earnings and profit margin for Tesla all increased over past 5 years
- Tesla reported higher than forecast earnings for company for the past 4 quarters
Balance Sheet
- Increasing Assets and liabilities with a shrinking Debt-Asset Ratio
Cash Flow ( Value of the Company is ALWAYS a reflection of FREE CASH FLOW )
- 2018-2019 Tesla free cash flow growth risen by 538.85%.
- 2019-2021 Telsa free cash flow growth is still increasing but by smaller percentages. Since 2019
Tesla free cash flow growth decreased -455.04%
..................................................................................................................................
TSLA Price Chart Analysis
Tesla stock has been decreasing in value since November 4, 2021 losing more than 50% of yearly gains.
Largest decrease in value is near Earning announcements. ( Though Tesla reported higher than forecast earnings—Tesla earnings growth has been declining )
*Tesla forecast to report lower earnings and revenue compared to previous quarter results for the first time in 5 most
recent earning announcements.*
..................................................................................................................................
Sentiment: Short Term Sell - Long Term Buy/Hold

NZD/CAD: Update +85 Pips And The Signal Shared Few Hours Ago +40This Is An Educational + Analytic Content That Will Teach Why And How To Enter A Trade
Make Sure You Watch The Price Action Closely In Each Analysis As This Is A Very Important Part Of Our Method
Disclaimer : This Analysis Can Change At Anytime Without Notice And It Is Only For The Purpose Of Assisting Traders To Make Independent Investments Decisions.

AUD/USD finally heading south as expected...Prior chart:
AUD/USD since our last post has fallen 150 pips with still some more downside to go. The landing spot is firmly set at 0.6700. Dollar strength looks to have full control over the AUD and we could look to see another 70 pip decline heading into early next week.
There is a small amount of high impact news over the remaining hours of this week as be sure to manage your trades according heading into the weekend!

Long GBPUSD +76pipsTrend reversal pattern, we are looking for a reversal at the end of this week, nice and smooth PA to be here

How to generate more profitsTrading requires entries similar to how a computer would enter positions, what I mean by this is entries should be so disciplined it hurts, when you are sitting there bored in the early hours of the morning and you take sloppy trades this has an effect on your results! you should create enough discipline to be able to trade a specific time frame when your entry and exit system provides better returns. Adding rules for confirmation will also lead to better entries, things such as a Baseline, what this will do is create a layer of the bike lock, now you never take buys below the baselines, meaning you no longer take reversals, your winrate will improve and your profits improve. For GBPUSD it is wise to trade over the London session and you can see just how much the pair moved over this session, your trades have a better chance at delivering profits in this zone. You may find your strategy works well in other timezones, and I suggest following the path, dont be restricted if it works elsewhere, but get some good backtest results.

Gold on Rise!! Easy 200 Pips Move #LongGold on Rise!! Easy 200 Pips Move.
My Trade Plan is to Long Gold.
My Buying: 1838.0
SL: 1833.30
Target: 1858-1860.0
Note: Do your own research before taking the trade.
Trade based on Pure Price Action.

nas100 analysis (22 june-24 june)so...
1. on the daily we closed respecting the major level of support which is now our resistance
2. the third touch of the downward trendline was a bearish engulfing on the H1
3. market is making a series of lower lows ad lower highs
4. entry was at the breakout of the counter trendline and sitting at a 1:4 risk reward
5. market could close above the counter trendline on the h4 but trade will be managed accordingly

Another 180 pips to go on AUD/USD...0.6700 is the target we've suggested before on AUD/USD and after the recent volatile markets, we are moving lower at a rapid pace. Tomorrow holds more high impact news so make sure to trade safe.
More USD strength is expected over the next couple of weeks, which should keep the momentum bearish on this pair.
