Prosignal

Cess / Usdt GATEIO:CESSUSDT
🚨 CESS Coin Alert!
This chart is heating up — pump incoming, explosion vibes soon! 🔥🚀
Stay ready, eyes on the move — momentum is building.
⚠️ Disclaimer: Not financial advice, just observation. Always DYOR..

Launchcoin / UsdtBITGET:LAUNCHCOINUSDT
📊 **Technical Analysis – LAUNCHCOIN/USDT (1H, Bitget):**
* 💰 **Current Price:** \$0.10578
* 🟥 **Major Support Zone:** \$0.09000 – \$0.09800 (gray box)
* 🟩 **Resistance Levels:**
* \$0.11037 → short-term resistance
* \$0.14429 → major breakout target
* \$0.19350 → extended resistance zone
---
### 🔍 **Chart Insights:**
1. **Falling Wedge Formation**
A visible falling wedge (marked by dashed trendlines) typically signals a **potential bullish reversal**. Price is currently near the lower end of the pattern.
2. **Projected Scenarios (Red Arrows):**
* 🔁 **Scenario A:** Retest of the **support zone (\$0.090–\$0.098)** before a possible bounce.
* 🚀 **Scenario B:** Immediate breakout from \$0.110 → rally toward \$0.144 if bulls step in strongly.
3. **Key Confirmation Levels:**
* Holding above \$0.098 = Bullish interest.
* Break and close above \$0.110 = Momentum shift.
* Below \$0.090 = Breakdown risk increases.
---
📌 **Conclusion:**
Market is in a **make-or-break zone**. Structure favors a rebound if buyers protect the demand area, but confirmation via volume or a bullish candle close is crucial.
---
⚠️ **Disclaimer:**
*This analysis is for educational and informational purposes only. It is **not financial advice**. Always conduct your own research and use proper risk management before making any trading decisions.*

Furry / UsdtGATEIO:FURYUSDT
Something is cooked be careful Low cap Coin
Disclaimer : Not Financial Advice

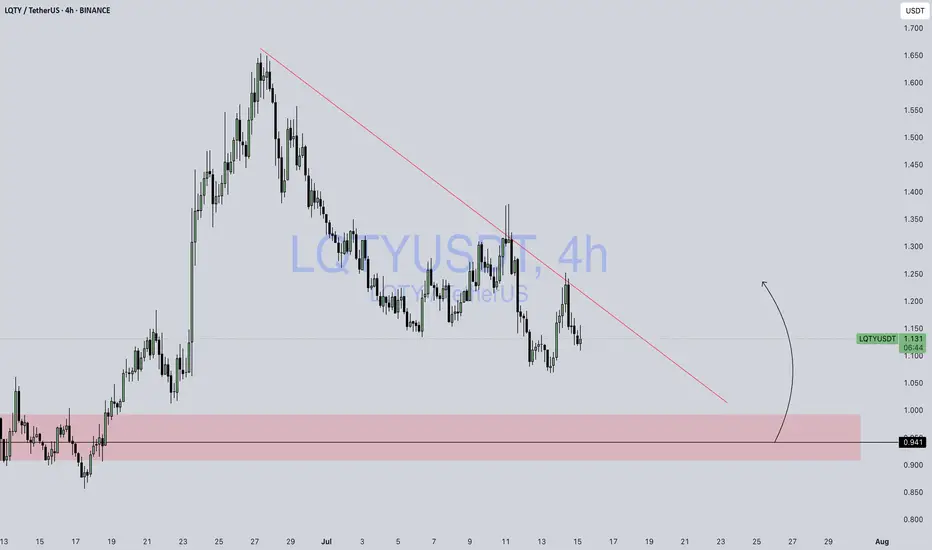
LQTY / USDTBINANCE:LQTYUSDT
📊 **Chart Overview – LQTY/USDT (4H, Binance):**
* 📍 **Current Price:** \$1.134
* 🔻 **Downtrend Line:** Strong descending trendline still acting as resistance.
* 🟥 **Demand Zone (Support):** \$0.91 – \$0.96
* 🟢 **Scenario Projection:** Price might **retest the demand zone** before attempting a bullish reversal (marked by the black curved arrow).
---
### 🔍 Key Observations:
1. **Trend Structure:**
* Price has been respecting a **descending trendline** since the \$1.65+ top.
* Recent rejection from the trendline suggests **sellers are still active**.
2. **Price Reaction Zone:**
* The highlighted **support zone (\$0.91 – \$0.96)** has a history of strong buying and breakout behavior.
* If price drops into this region again, it may trigger a **bullish reversal or bounce**.
3. **Bullish Opportunity:**
* If price **taps into the demand zone with a long wick / strong candle close**, it could be a **high-probability entry** for long setups.
* Potential upside: **\$1.20 – \$1.30** range.
4. **Invalidation:**
* A **clean break below \$0.91** would invalidate the bullish scenario and signal further downside.
---
📈 **Trade Idea (Hypothetical):**
* **Entry Zone:** \$0.94 – \$0.96
* **Stop Loss:** Below \$0.89
* **Target 1:** \$1.15
* **Target 2:** \$1.25
---
⚠️ **Reminder:** This is **not financial advice** – always use your own risk tolerance and confirmation tools (volume, candle close, etc.)
Boom / Usdt KUCOIN:BOOMUSDT
📊 **Technical Outlook – BOOM/USDT (1H):**
* 🟢 **Current Price:** \$0.01760
* 🟩 **Support Zone:** Around \$0.01700 (highlighted in the lower red box) – price recently bounced from this zone.
* 🟥 **Resistance Zone:** Around \$0.01900 – \$0.01950 (upper red box) – price has previously rejected here.
* 📈 **Short-Term Bias:** Bullish attempt – the chart suggests a **potential move upward** toward the resistance area, as shown by the red arrow.
---
🔍 **Key Observations:**
* Recent **higher low formation** suggests bullish interest.
* If momentum holds and volume confirms, price may **retest the \$0.019+ level**.
* However, if the price fails to hold above \$0.01720, the upward setup could be invalidated.
---
⚠️ **Note:** This is **not financial advice** – always manage risk with proper stop-loss levels.

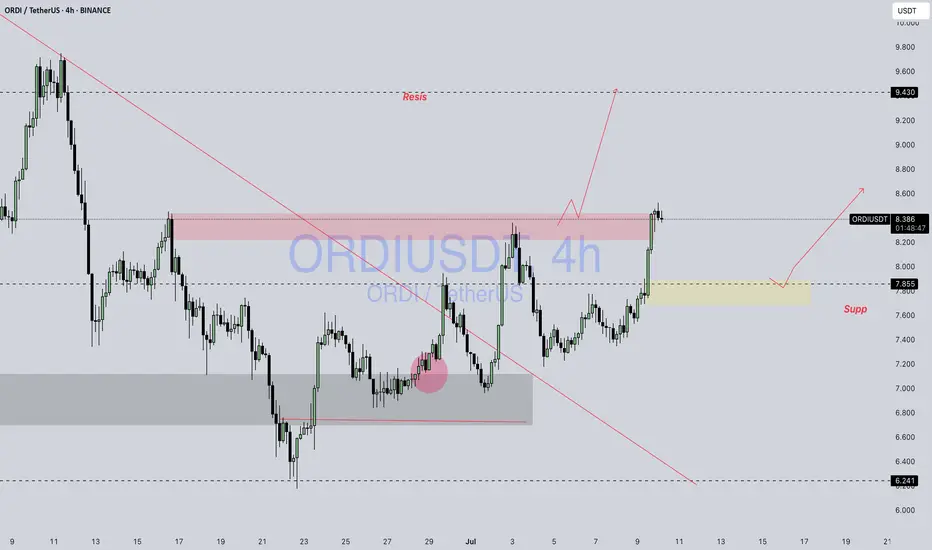
ORDI / USDTBINANCE:ORDIUSDT
### 📊 **Technical**###
* **Current Price:** \~8.377 USDT
* **Chart Type:** Candlestick (4H)
* **Trendline:** A long-term **downtrend line** has been broken, signaling a potential trend reversal or breakout.
---
### 📍 **Key Zones:**
1. **Resistance Zone (Red Box):**
* Located around **8.3 to 8.5** USDT.
* Price is currently testing this zone.
* A clean breakout with volume can send price toward the **next resistance at 9.43** USDT.
2. **Support Zone (Yellow Box):**
* Around **7.85** USDT.
* If price faces rejection from the resistance, it might pull back to this support and bounce from there.
3. **Next Major Resistance:**
* Marked at **9.430** USDT — likely the next target if the breakout sustains.
---
### 🧭 **Scenarios to Watch:**
* ✅ **Bullish Scenario:**
* Break and hold above the red resistance zone.
* Possible continuation toward 9.43 USDT.
* ⚠️ **Bearish Pullback Scenario:**
* Rejection from the red zone.
* Retest of the 7.85 support zone.
* A bounce here could still maintain a bullish structure.
Disclaimer : Not Financial Advice
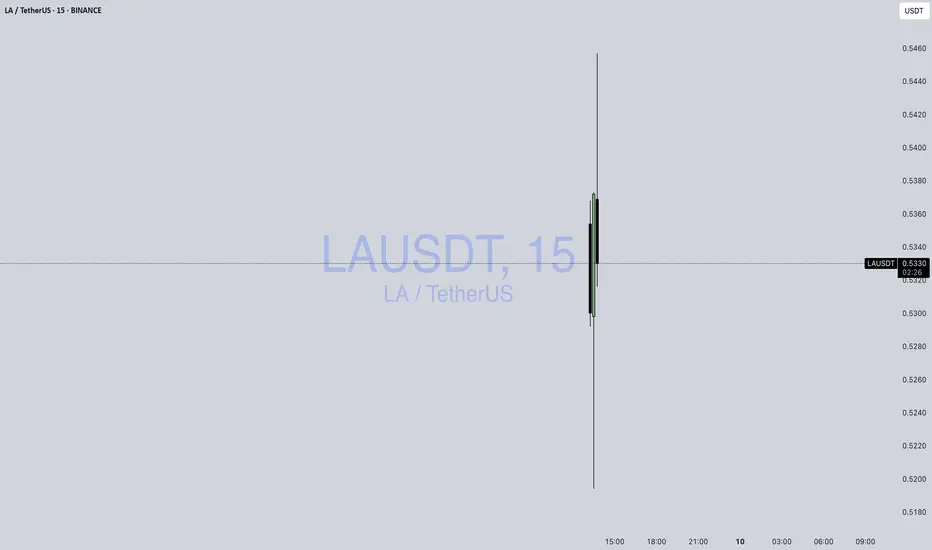
LA / USDTBINANCE:LAUSDT
LA/USDT spiked to 0.5618 but closed lower at 0.5210 (-7.05%), signaling rejection and sell-off.
Volume was strong, suggesting big players or coordinated action.
High volatility → trade cautiously, especially if fundamentals are unclear.
Disclaimer : Not Financial Advice
HBAR / USDTBYBIT:HBARUSDT
### 📉 **HBAR/USDT 4H Chart Analysis**
*(As of 0.15684 USDT)*
---
### 🔼 **Resistance Zones:**
1. **0.158–0.160 (Local Resistance):**
* Multiple rejections in this zone.
* Price currently struggling to break through.
2. **0.17548 (Major Resistance):**
* Strong historical level.
* Acted as a turning point previously.
---
### 🔽 **Support Zones:**
1. **\~0.150 (Local Support):**
* Recent reaction area.
* Price found temporary stability here.
2. **0.14241 (Major Support):**
* Strong reversal zone in previous sessions.
* Significant demand was seen historically.
---
### ⚙️ **Price Behavior:**
* Market is in a **sideways consolidation** phase.
* No breakout or breakdown confirmed.
* Structure is developing between support and resistance boundaries.
---
### 📌 **Key Observations:**
* Lower highs forming near resistance may suggest hesitation.
* Consolidation can often lead to stronger moves once direction is confirmed.
* Watching volume and reaction near key levels is critical.
---
> **Disclaimer:**
> This analysis is for educational and informational purposes only. It is **not financial advice**. Always do your own research (DYOR) and consult a professional before making any trading decisions.
