PSX

Resistance Playing WellBearish Divergence on Daily & Weekly TF.
Now Strong Resistance is around 119500.
Cup & Handle Formation appearing at the Top.

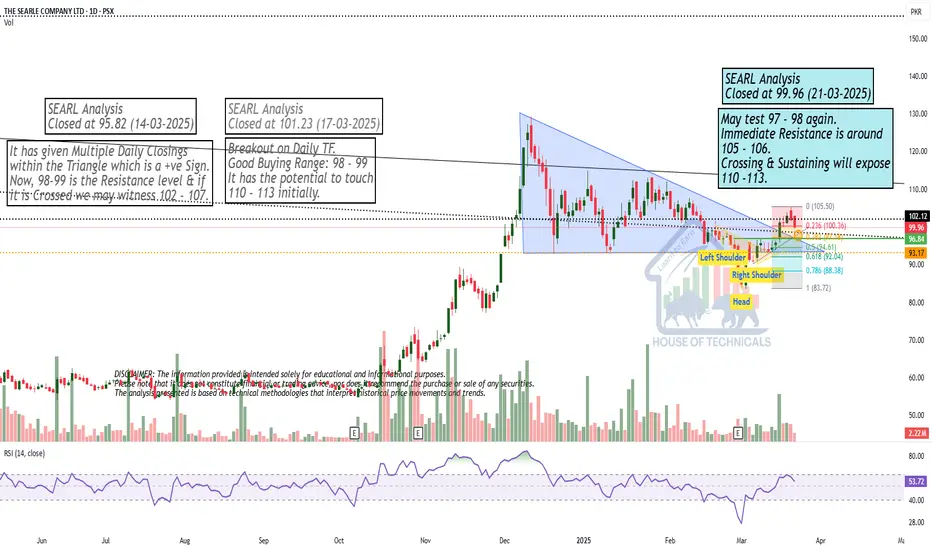
May test 97 - 98 again.May test 97 - 98 again.
Immediate Resistance is around
105 - 106.
Crossing & Sustaining will expose
110 -113.
Breakout ExpectedMonthly Closing above 18.40 will trigger
further upside.
Long Consolidation Breakout Expected.
Bullish on Weekly TF.
Hidden Bullish Divergence on Weekly TF.

Bearish Divergence has started appearing but...Bearish Divergence has started appearing
on Weekly TF but not yet on Monthly, so
a pressure might be seen around 116 - 117.
& Sustaining this level will expose 135 - 138 targets.
On the flip side, 101 - 109 may act as a Good
Support zone in case of pressure.

KEL is heading to 5KEL technically enters in bullish trend and it is expected to cross 5 level.
Note: this is not a buy sell call. Use SL too.

BBFL is heading to 55BBFL is in bullish zone and it is expected to cross 55 level
Note. This is not a buy sell call use stop loss.

Sys is heading to 600+Sys is in bullish trend and it is technically in strong bullish trend and it is expected to cross 600 and 620 level
Note. This is not a buy sell call and use stop loss too.

Efert could drop to 200 to 188Technically efert is dropping its support level and it is expected to more drop to 200 and 188 level
Note; This is not a buy sell call, use stop loss too.

PAEL - THE BEST SETUPPAEL has always been my favorite stock as it plays very well on price action and technical.
Right now the trending accumulation has ended and its time for a move.
if we take the simple and basic previous demand copy. It gives the target of 60 which everyone is expecting. but there might be some trick played to take out the retails. so be careful around 55 and 59 level you might see the trend slowdown in short term due to divergence on RSI.
right now if you want to accumulate more wait for the intraday retest levels around 46 to 44.
I HAVE ALREADY ENTERED THIS SETUP AROUND 43.
THE TAKE PROFIT IS 55 AND THEN 58 TO 59 ACCORDINGLY.

Bullish on All Time Frames.Bullish on All Time Frames.
Breakout above 46.50.
Already re-tested the Previous Breakout
around 38.
Immediate Support is around 42.50 - 44
Immediate Targets can be around 49 - 50
However, It has the potential to touch 59 - 60.
It should not Break 40 now.

BreakoutBreakout on Daily TF.
Good Buying Range: 98 - 99
It has the potential to touch
110 - 113 initially.

Still Bullish on Bigger Time Frames.Still Bullish on Bigger Time Frames.
Hidden Bullish Divergence has appeared.
Immediate Resistance lies around 186 - 189
Crossing this Level with Good volumes may
expose 197 - 200
Fresh Entry should be Triggered if 205 is Crossed
& Sustained; only then it may resume its Uptrend.

ABCD Pattern appearingImportant fib level tested.
ABCD pattern appearing but not
yet confirmed.
Should not break 15 on Closing basis.

Double BottomDouble bottom with Bullish Divergence
Immediate Targets around 43 - 45
Support is around 39 - 39.50
Should not Break 37.50

Some Positivity Seen...0.5% Fib level retracement &
Also, Confirmed HL around 29 - 30.
Important Support lies around 32.50 - 34.70
Should not Break 29, otherwise, we may witness
further Selling Pressure.
If 36.30 is Sustained, we may witness 38 - 38.50
which is again a Strong Resistance.
Stock will be in uptrend again if is Sustains 38.50
& it may hit 49 - 50 again. Also because , it seems
as now it is Re-testing the Breakout level around 34.50 - 35.

Hidden Bullish Divergence on Shorter Time Frame.Check out the levels for HCAR of all time frames from Monthly, Weekly to Daily.
Hidden Bullish Divergence on Shorter Time Frame.

Monthly + Weekly View
If Monthly Candle closes above 95, it would
confirm a Morning Star Formation which is a
Positive Sign.

Good Financial Results.169 - 175 can be a Good Support Area.
Better Financial Results.
Should not Break 162 even in Worst Cases.
Crossing 180 may lead it towards 190 - 193.

Breakout ExpectedSymmetrical Triangle Formation.
Breakout Expected around 116000;
Targeting 126000 if 118700 - 119000 is sustained.
Important Support Levels:
S1 around 111500
S2 around 108500 - 110200
Immediate Important Resistance is around 119000

THCCL- PSX - Technical AnalysisTHCCL price has made a wedge which is an indication of price going up any time. RSI has already bounced from 30 and moving upwards. Klinger is just hinting at likely beginning of the bull run for this SCRIPT.
Fundamentally, from cement sector, this will show progress as sales will be substantial during post Ramadan and pre-monsoon (April ~July). Coupled with company has already shifted its power requirements to solar energy, therefore manufacturing cost cutting is eminent.
This SCRIPT can be kept in portfolio for investment point of view as well since prices are already very discounted.
Trade Values:
Buy-1 :189.58
Buy-2: 167.08
TP-1: 233.36
TP-2: 255.66
TP-3: 305.41 (For SWING TRADE 6 months Plus)
TP-4: 336.62 (For SWING TRADE 6 months Plus)
SL: 159.88

MLCF WEEKLY TIME FRAME AND TRADE IDEAMLCF GAVE A BREAKOUT AT THE ACCUMULATION BOX. THE STOCK IS HEADING TO WEEKLY STRONG RESISTANCE AT 50.92
BUT EXPECTED TO BREAKOUT DUE TO THE SENTIMENT AND THE DESECENDING ACCUMULATION JUST BEFORE THE WEEKLY BREAKOUT LOOKS LIKE A CONFIRMATION. LOOKS LIKE THAT
THE BIG PLAYERS HAVE FILLED UP THIER BAGS AND READY FOR THE BREAKOUT
HOWEVER THIS MIGHT BE PLAYED NEXT WEEK OR IN THESE NEXT FEW DAYS
WATCH FOR PRICE ACTION ON H2 AND H4
BREAKOUT AT 50.92 will start a new quick rally however a retest might be possible at the breakout level at 50.92 to 5. The next target will be 58 to 59.
watch for order flows in orderbook. and look for the 5m timeframe above vwap session near breakout

Still Bullish on Bigger Time Frames.Still Bullish on Bigger Time Frames.
Hidden Bullish Divergence has appeared.
Immediate Resistance lies around 186 - 189
Crossing this Level with Good volumes may
expose 197 - 200
Fresh Entry should be Triggered if 205 is Crossed
& Sustained; only then it may resume its Uptrend.
