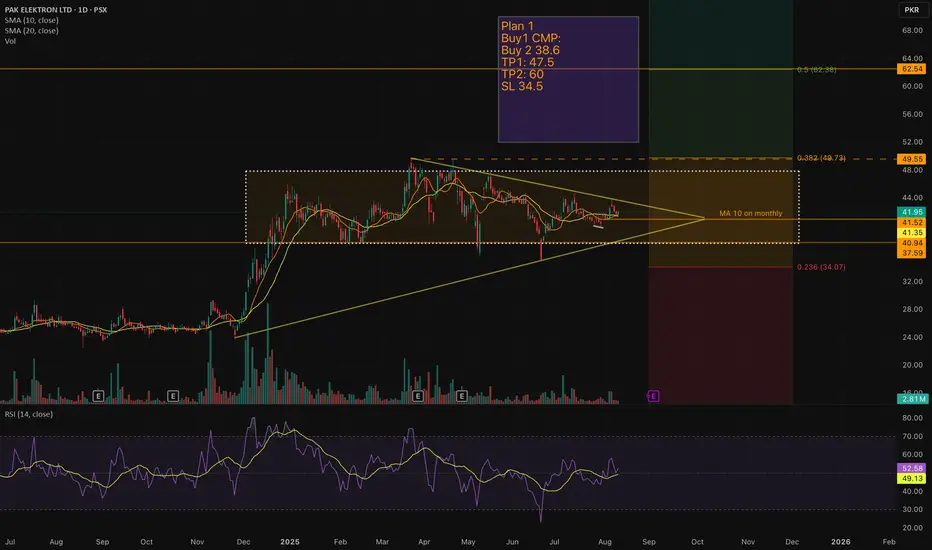
PAEL – Symmetrical Triangle Breakout Loading?PAK Elektron Ltd (PSX: PAEL) has been consolidating for months inside a symmetrical triangle, with price hugging the 10 & 20 SMA zone. The breakout could be just around the corner.
📊 Technical Outlook:
Pattern: Symmetrical triangle within a larger consolidation box.
Current CMP: 41.95
MA10 on monthly: Acting as dynamic resistance.
Volume: Noticeable spikes during upswings, showing accumulation.
RSI: Neutral zone at 52 – plenty of room for momentum in either direction.
📝 Trading Plan:
Buy 1: CMP (41.95)
Buy 2: 38.6 (on dip if retest happens)
TP1: 47.5 (near 0.382 Fib level)
TP2: 60 (major Fib retracement level 0.5)
SL: 34.5
⚡ Why Interesting?
Price has been coiling, reducing volatility – a breakout can trigger strong moves.
Weekly & Monthly structure shows alignment for a potential uptrend continuation.
Above 49.5, momentum could accelerate toward 62+.
🔍 Watch Levels:
42.50 breakout confirmation zone
38.50 retest support
49.5 major resistance
Disclaimer: This is not financial advice – just my personal trade setup based on technical analysis. Always do your own research before entering any trade.
Psxtrading
FCCL – Breakout Watch!Pattern: Ascending Triangle | Timeframe: 1D | Sector: Cement
After weeks of consolidation, FCCL is finally knocking on the resistance door. With strong volume and momentum, a breakout could unlock serious upside potential! 📈
🔍 Setup Overview:
✅ Breakout Level: 51.11 – Key resistance to watch. Entry on sustained close above this level.
🟢 Current Price: 49.51 – Just below breakout zone.
💡 Indicators:
RSI at 70.38 – Entering overbought territory, showing bullish momentum.
SMA(10) and SMA(20) support the trend.
🎯 Trade Plan:
📥 Entry: Above 51.11 (on confirmed breakout)
🛑 Stop Loss: 45.10 – Below structure support and SMA cluster
🎯 Target 1 (TP1): 60.09
🎯 Target 2 (TP2): 71.57
This gives a strong risk-reward ratio, ideal for swing traders.

PAEL SETUP ONCE AGAINPAEL is currently at its orderblock zone where the liquidity is resting if volumes come in at this level then we can expect a bounce again if the orderblock fails and there is no liquidity in OB then wait for downside levels and if the weekly ema 21 is broken then i see 30 level coming but still we will look into some more levels for now just focus on this orderblock
the previous supply is completed here

FFL THE PERFECT SETUP REVIEW AS DEFINED FFL tested the same key levels which I find through secret price action and institutional order flows. I don't want to repeat you can just look at the chart and its beauty.


Bullish on All Time Frames.Bullish on All Time Frames.
Breakout above 46.50.
Already re-tested the Previous Breakout
around 38.
Immediate Support is around 42.50 - 44
Immediate Targets can be around 49 - 50
However, It has the potential to touch 59 - 60.
It should not Break 40 now.

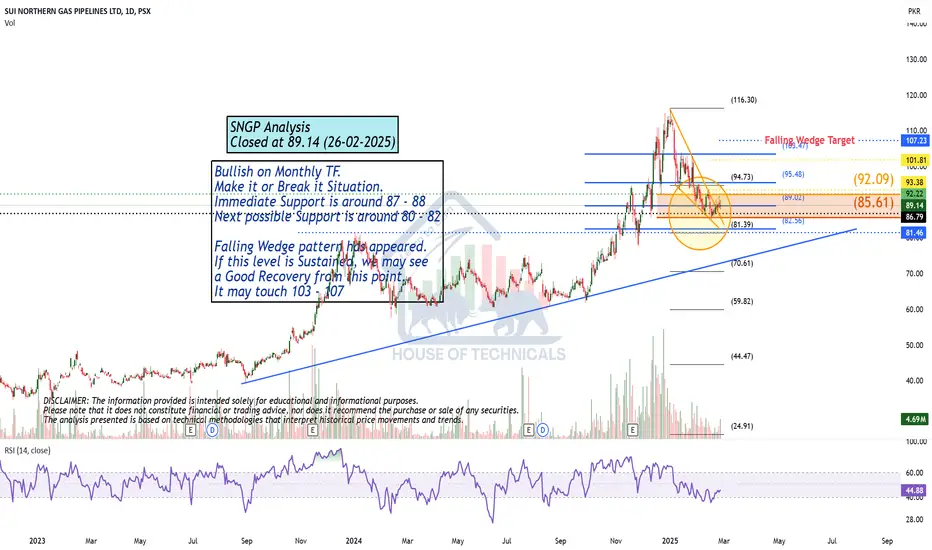
Bullish on Monthly TF.Bullish on Monthly TF.
Make it or Break it Situation.
Immediate Support is around 87 - 88
Next possible Support is around 80 - 82
Falling Wedge pattern has appeared.
If this level is Sustained, we may see
a Good Recovery from this point.
It may touch 103 - 107
Morning Star Formation on Weekly TF.Morning Star Formation on Weekly TF.
Strong Trendline Support around 9.40 - 9.50
However, Accumulation can be started from
Current Level (10 - 10.50);
Should not Break 8 (even in worst cases)
Upside Targets can be around 13 - 14 & then
16 -18

23 FEB 2025, KSE - 100 A simple yet clear viewThe volumes are low as compared to last year. As the big money stopped flowing into stocks for a moment the retail traders and the aggressive players are also waiting for a clear signal in the market.
The KSE 100 is very confusing right now. The simplest and most clear view is that the market is sideways and consolidating as we saw last year in these months.
Whoever is trying to analyze the KSE 100 and thinking that he can figure it out or all the youtubers, they don't know anything about technical.
Right now none can predict anything on the index.
The best thing is to stop watching the index until it closes above mentioned levels and focus on stocks only right now.
