XAUUSD - Overtrading and Revenge Trading - Trading PsychologyFrom Chaos to Control: Mastering the Art of Balanced Trading on Gold
Trading gold is exhilarating. It’s fast, volatile, emotional — and addictive.
But what most traders don’t realize is this: it’s not the market killing your account.
It’s you, pressing buy and sell like it’s a video game.
Over-trading is the silent account killer. It doesn’t scream. It whispers:
“Just one more entry.”
“Maybe this one will finally run.”
“Let me scalp this quick pullback…”
Before you know it, you’ve taken 12 trades by noon and your brain’s fried.
🧠1. Why Over-Trading Happens: The Dopamine Delusion
Over-trading isn’t just a strategy flaw. It’s chemical. Your brain rewards anticipation of profit — not just actual wins.
So every setup, every near-miss, every “maybe I missed the move” spikes your dopamine.
That’s why you keep clicking. Not because you saw a valid setup.
Because your brain craves the rush of imagining one.
This is why traders enter in zones they never marked, skip confirmation, and rush into impulsive entries.
The market didn’t give a signal. Your nervous system did.
📉2. The Real Damage: Not Just Losing Trades — Losing Discipline
Over-trading ruins more than your account. It ruins your edge.
• You stop following your plan
• You chase liquidity like a gambler
• You get shaken out of clean zones
• You increase risk, just to “make it back faster”
And worst of all? It feels productive.
But profits don’t come from activity. They come from precision.
If you don’t reflect about your actions, you repeat the bad ones.
💸3. The Financial Fallout: Over-Trading Blows Up Accounts
Over-trading nukes your capital.
• One extra trade becomes five
• SL gets wider or invisible because your entry was rushed
• Lot size gets heavier to “speed up” recovery
• Now you’re emotional, and revenge mode kicks in...
You’re not compounding anymore.
You’re compounding mistakes.
This is how smart traders blow up challenge accounts.
This is how funded accounts get revoked.
This is how small accounts die before they grow.
Over-trading is a trap with a $0 exit.
✅4. Tactical Fixes: Trade Smart, Live Smarter
✔️ Set a daily trade cap.
Limit yourself to 2–3 trades. If you keep entering, it’s not analysis — it’s compulsion.
✔️ Split your daily risk.
Risking 0.3% total? That doesn’t mean 0.3% per trade. Break it down, or you’ll break your account.
✔️ Set alerts — not alarms in your brain.
Stop watching every candle like it’s a soap opera.
Set TradingView alerts at your key zones and walk away.
The market doesn’t move faster just because you're glued to the screen.
✔️ Take real breaks — not just chart scrolling.
Go outside. Call someone or send time with family and friends. Eat good food.
Most traders come home from work and go right back into charts like it’s their second shift.
That’s not discipline. That’s burnout.
✔️ Build a life that doesn't revolve around entries.
The more you lose, the more you trade. The more you trade, the more you spiral.
It’s just like alcohol, drugs, gambling. Dopamine up. Reality down.
And the worst part? It looks like hard work from the outside — but it feels like slow death inside.
🧨5. From Over-Trading to Revenge Mode
If over-trading is the first crack in your foundation, revenge trading is the wrecking ball.
And it never starts from logic. It starts from pain.
You had a clean setup.
You got stopped out — maybe twice.
Now you're frustrated, humiliated… embarrassed.
You’re no longer reacting to price.
You’re reacting to loss.
Revenge trading doesn’t feel chaotic in the moment.
It feels righteous.
You convince yourself, “I just need one win to get it all back.”
😵💫6. The Emotional Spiral Traders Don’t Talk About
Over-trading and revenge trading are addictive.
You’re showing up to work. You’re posting charts. You’re pretending it’s fine.
But deep down?
You're wrecked. Emotionally, financially, and mentally.
This is the side of trading no one glamorizes.
The isolation. The loneliness. The pressure. The self-blame.
This is how people burn out — not from one bad week.
But from trying to trade their way out of pain.
⚠️ Final Word
Over-trading is not a badge of hustle.
It’s the first step toward emotional dependence on the market.
And that’s the most expensive habit you’ll ever form.
If you don’t catch it early, you’ll keep blaming the market, the spread, the broker…
when the real damage was done by your own reaction.
The market doesn’t owe you anything.
So be kind to yourself and build discipline, you will win in the long run.
If this lesson helped you today and brought you more clarity:
Drop a 🚀 and follow us✅ for more published ideas.
Psychological

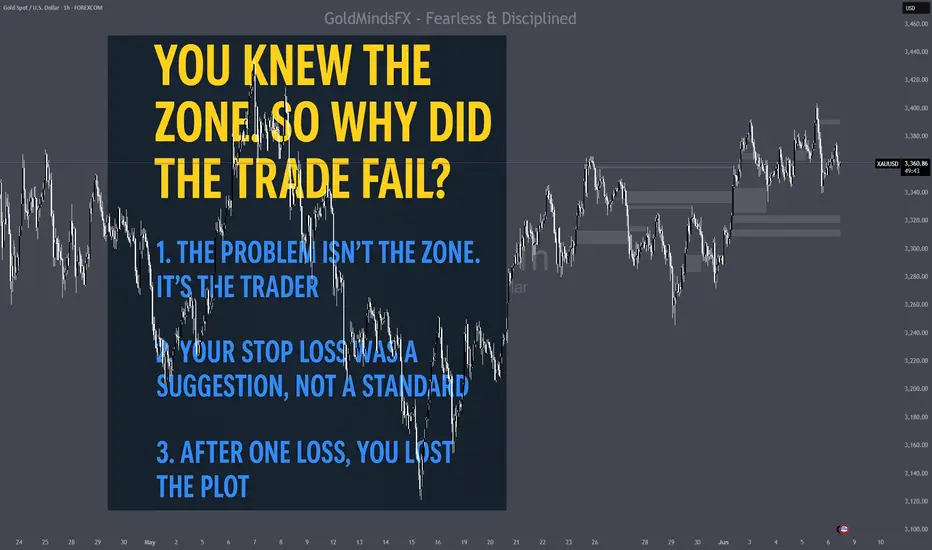
Gold execution psychology - why do your trades fail on XAUUSD?🎯 You Knew the Zone but the trade failed.
Execution psychology for Gold traders who are tired of guessing.
You marked the zone.
You waited for price to tap into it.
Maybe you even caught a reaction — but the trade failed anyway.
Not because the zone was wrong.
Because the execution broke down.
🧠 1. The Problem Isn’t the Zone. It’s the Trader.
There are two valid entry styles:
🔹 Bounce Entry
→ Enter on first touch of the zone
→ Works best when:
• Structure supports your bias
• Liquidity has been swept
• You're using a refined zone (OB, FVG, confluence)
→ SL must sit outside the zone — not inside it
→ Fast entries, fast rejections — but high responsibility, not for beginners.
🔹 Confirmation Entry
→ Wait for CHoCH or BOS on M5/M15
→ Enter on the retest
→ Cleaner invalidation, but slower execution
→ Less drawdown, but requires patience
⚔ 2. Your Stop Loss Was a Suggestion, Not a Standard
Gold isn’t EURUSD.
This pair moves 100–300 pips in minutes — and it will wipe out shallow SLs for fun.
Your SL must sit:
• Below the OB (not inside it)
• Outside the liquidity sweep
• Beyond the structural invalidation point
💰 Lot Size Must Match Your SL — Not Your Ego
We don’t increase lot size because we hope it will go perfect.
We always trade small — because Gold doesn’t need size to give payout.
The wider the SL, the smaller the lot.
That’s how you control risk and let price move.
We don’t chase leverage.
We prioritize precision, patience, and profit.
📉 3. After One Loss, You Lost the Plot
One trade didn’t go your way — now you’re flipping bias, skipping rules, and forcing setups.
That’s not trading. That’s emotional spending.
Real traders analyze the loss.
They re-read the setup.
They take the next trade — only if structure allows, even skip trading to the next day.
✅ So How Do You Fix It?
1. Define your entry style
2. Keep lot size small — even with 100 pip stops
3. Move SL to BE when appropriate
4. Walk away after 2 losses.
Accept that one good trade is better than 5 emotional entries, clear mind -cleaner executions.
If this lesson helped you today and brought you more clarity:
Drop a 🚀 and follow us for more published ideas.
Behind the Numbers : Meet Your Dark SideIn the heart of every trader lies an unspoken duality—a relentless pursuit of precision battling against a ravenous hunger for chaos.
It begins innocuously enough: the first trade, the first click, the first taste of triumph. But beneath the surface, hidden in the shadows of spreadsheets and tickers, a darker force stirs. It’s cunning, calculating, and seductive—a predator dressed in the guise of ambition.
You meet this dark side not in moments of triumph, but in the haunting seconds between fear and greed. It whispers to you as the market turns against you, as the screens bleed red and your pulse quickens. It watches as your composure fractures, as your carefully laid plans buckle under the weight of desperation. It thrives in the silence, in the endless ticking of the clock as you hesitate, second-guess, and linger on the edge of ruin.
The dark side is not an external force; it is you. It is your impatience when the chart doesn’t move fast enough, your overconfidence when the numbers briefly tilt in your favor. It is the knot in your stomach, the feverish obsession, the siren call of doubling down when you know you shouldn’t. It is your recklessness disguised as boldness and your hesitation masked as strategy.
You don’t fight the dark side.
You negotiate with it.
You confront it, standing toe-to-toe, dissecting its motives and unmasking its lies.
To do otherwise is to surrender—becoming a puppet to your own fear, enslaved to the same impulses that destroy those who lack the discipline to conquer themselves.
In trading, the battlefield is not the market. It’s the war within you. And to emerge victorious, you must first meet your adversary:
YOURSELF.
Craft

$100, $1,000, $100,000 — When Numbers Become Turning PointsHey! Have you ever wondered why 100 feels... special? 🤔
Round numbers are like hidden magnets in the market. 100. 500. 1,000. They feel complete. They stand out. They grab our attention and make us pause. In financial markets, these are the levels where price often slows down, stalls, or makes a surprising turn.
I’ll admit, once I confused the market with real life. I hoped a round number would cause a reversal in any situation. Like when I stepped on the scale and saw a clean 100 staring back at me, a level often known as strong resistance. I waited for a bounce, a sudden reversal... but nothing. The market reacts. My body? Not so much. 🤷♂️
The market reacts. But why? What makes these numbers so powerful? The answer lies in our minds, in market dynamics, and in our human tendency to crave simplicity.
-------------------------------------
Psychology: Why our brain loves round numbers
The human mind is designed to create structure. Round numbers are like lighthouses in the chaos — simple, memorable, and logical. If someone asks how much your sofa cost, you’re more likely to say "a grand" than "963.40 dollars." That’s normal. It’s your brain seeking clarity with minimal effort.
In financial markets, round numbers become key reference points. Traders, investors, even algorithms gravitate toward them. If enough people believe 100 is important, they start acting around that level — buying, selling, waiting. That belief becomes reality, whether it's rational or not. We anchor decisions to familiar numbers because they feel safe, clean, and "right."
Walmart (WMT) and the $100 mark
Round numbers also carry emotional weight. 100 feels like a milestone, a finish line. It’s not just a number, it’s both an ending and a beginning.
-------------------------------------
Round numbers in the market: Resistance and support
Round number as a resistance
Imagine a stock climbing steadily: 85, 92, 98... and then it hits 100. Suddenly, it stalls. Why? Investors who bought earlier see 100 as a "perfect" profit point. "A hundred bucks. Time to sell." Many pre-set sell orders are already waiting. Most people don’t place orders at $96.73. They aim for 100. A strong and symbolic.
At the same time, speculators and short sellers may step in, viewing 100 as too high. This creates pressure, slowing the rally or pushing the price back down.
If a stock begins its journey at, say, $35, the next key round levels for me are: 50, 100, 150, 200, 500, 1,000, 2,000, 5,000, 10,000…
Slide from my training materials
These levels have proven themselves again and again — often causing sideways movement or corrections. When I recently reviewed the entire S&P 500 list, for example $200 showed up consistently as a resistance point.
It’s pure psychology. Round numbers feel "high" — and it's often the perfect moment to lock in profits and reallocate capital. Bitcoin at $100,000. Netflix at $1,000. Tesla at $500. Walmart at $100. Palantir at $100. These are just a few recent examples.
Round number support: A lifeline for buyers
The same logic works in reverse. When price falls through 130, 115, 105... and lands near 100, buyers often step in. "100 looks like a good entry," they say. It feels like solid ground after a drop. We love comeback stories. Phoenix moments. Underdogs rising. Buy orders stack up and the price drop pauses.
Some examples:
Meta Platforms (META)
Amazon.com (AMZN) — $100 acted as resistance for years, then became support after a breakout
Tesla (TSLA)
-------------------------------------
Why round numbers work for both buyers and sellers
Buyers and the illusion of a bargain
If a stock falls from 137 to 110 and approaches 100, buyers feel like it’s hit bottom. Psychologically, 100 feels cheap and safe. Even if the company’s fundamentals haven’t changed, 100 just "feels right." It’s like seeing a price tag of $9.99 — our brain rounds it down and feels like we got an epic deal.
Sellers and the "perfect" exit
When a stock rises from 180 to 195 and nears 200, many sellers place orders right at 200. "That’s a nice round number, I’ll exit there." There’s emotional satisfaction. The gain feels cleaner, more meaningful, when it ends on a round note.
To be fair, I always suggest not waiting for an exact level like 200. If your stock moved through 145 > 165 > 185, don’t expect perfection. Leave room. A $190 target zone makes more sense. Often, greed kills profit before it can be realized. Don’t squeeze the lemon dry.
Example: My Tesla analysis on TradingView with a $500 target — TESLA: Money On Your Screen 2.0 | Lock in Fully…
Before & After: As you see there, the zone is important, not the exact number.
-------------------------------------
Round numbers in breakout trades
When price reaches a round number, the market often enters a kind of standoff. Buyers and sellers hesitate. The price moves sideways, say between 90 and 110. Psychologically, it’s a zone of indecision. The number is too important to ignore, but the direction isn’t clear until news or momentum pushes it.
When the direction is up and the market breaks above a key level, round numbers work brilliantly for breakout trades or strength-based entries.
Slide from my training materials
People are willing to pay more once they see the price break through a familiar barrier. FOMO kicks in. Those who sold earlier feel regret and jump back in. And just like that, momentum builds again — until the next round-number milestone.
Berkshire Hathaway (BRK.B) — every round number so far has caused mild corrections or sideways action. I’d think $500 won’t be any different.
-------------------------------------
Conclusion: Simplicity rules the market
Round numbers aren’t magic. They work because we, the people, make the market. We love simplicity, patterns, and emotional anchors. These price levels are where the market breathes, pauses, thinks, and decides. When you learn to recognize them, you gain an edge — not because the numbers do something, but because crowds do.
A round number alone is never a reason to act.
If a stock drops to 100, it doesn’t mean it’s time to buy. No single number works in isolation. You need a strategy — a set of supporting criteria that together increase the odds. Round numbers are powerful psychological levels, but the real advantage appears when they align with structure and signals.
Keep round numbers on your radar. They’re the market’s psychological mirror, and just like us, the market loves beautiful numbers.
If this article made you see price behavior differently, or gave you something to think about, feel free to share it.
🙌 So, that's it! A brief overview and hopefully, you found this informative. If this article made you see price behavior differently, or gave you something to think about, feel free to share it & leave a comment with your thoughts!
Before you leave - Like & Boost if you find this useful! 🚀
Trade smart,
Vaido

Trading Biases: Managing Psychological Factors in Day TradingIn the fast-paced world of day trading, psychological factors play an indispensable role in shaping performance and outcomes. Even the most seasoned traders, with years of experience and robust analytical skills, are not immune to emotional pitfalls that can lead to errors in judgment. While fear and greed are often highlighted as the primary psychological challenges in trading, there exists a broader spectrum of cognitive biases that can significantly affect decision-making processes and ultimately influence financial success.
The Role of Psychological Factors in Trading
At the core of day trading lies the interplay between logical analysis and emotional response. Fear can manifest as hesitation to enter trades or lead to premature exits, particularly in volatile markets where emotions run high. This fear, often rooted in the potential for loss, can cause traders to deviate from their strategies, resulting in missed opportunities. Conversely, greed can provoke excessive trading behavior, where the allure of quick profits leads to rash decisions, over-leveraging, and emotional trading based solely on market trends rather than sound analysis.
While understanding fear and greed is essential, this article will delve deeper into the concept of cognitive biases. These biases are mental shortcuts, shaped by our experiences and emotions, which can distort our perception of reality and lead to flawed decision-making. A comprehensive understanding of these biases is paramount for traders who wish to enhance their performance and navigate the complexities of the financial markets more effectively.
Defining Cognitive Biases in Day Trading
Cognitive biases occur when people make decisions based not on objective data but rather on subjective interpretations of information. In the realm of day trading, failing to recognize and account for cognitive biases can lead to significant mistakes, regardless of experience. Many biases can influence trading behavior, but here are several of the most significant that deserve careful attention:
Common Trading Biases
1. Anchoring Bias:
Anchoring occurs when a trader fixates on a specific reference point, often the price at which they initially entered a position, leading them to disregard other pertinent information. For instance, if a trader buys shares of a stock at $50 and the price subsequently drops to $40, they may hold on to the investment, hoping it will return to the original price. This reluctance to adapt to changing market conditions can trap them in losing positions for longer than necessary.
2. Gambler’s Fallacy:
This bias illustrates the flawed reasoning that past random events affect the probabilities of future random events. For instance, a trader may wrongly believe that after a series of winning trades, a losing trade is "due" and should not be considered. This belief can lead to reckless trading decisions based on perceived momentum rather than statistical reality. When combined with risk-taking behavior, it can result in substantial losses.
3. Risk Aversion Bias:
Risk aversion can inhibit traders from pursuing opportunities that could lead to significant profits. When faced with the choice between a guaranteed small profit and a risky opportunity for larger gains, risk-averse traders may cling to the former, often missing out on lucrative trades that carry inherent risk but also the potential for significant rewards. This bias can particularly hurt traders in bullish markets where volatility is inherent and opportunities abound.
4. Confirmation Bias:
Confirmation bias manifests when traders seek out information that supports their existing beliefs while dismissing contrary data. For example, a trader bullish on a specific stock may only read positive analyst reports, ignoring bearish signals or warning trends. This selective information processing can lead to overconfidence in their positions and often culminates in poor financial outcomes.
5. Overconfidence Bias:
Overconfidence bias leads traders to believe they possess superior knowledge and skills, often causing them to take excessive risks. This overestimation of abilities may result from a few successful trades or a limited understanding of market dynamics. Overconfident traders frequently skip rigorous analysis, placing undue faith in their instincts, which can lead to significant financial losses when the market turns against them.
6. Herding Bias:
Herding behavior occurs when traders follow the majority, often leading to crowded trades and inflated market valuations. This bias arises from the assumption that if many people are buying a stock, it is likely to continue rising. However, such collective behavior can create price bubbles that eventually burst, resulting in substantial financial losses when the trend reverses.
The Impact of Biases on Day Trading Performance
The repercussions of cognitive biases in day trading can be devastating. Traders often find themselves making irrational decisions that deviate from sound analytical practices, which can lead to unnecessary losses and stress. For example, a trader influenced by herding bias may buy into a stock experiencing a sharp uptick without conducting due diligence, only to find themselves trapped in a market correction as the price collapses.
Biases also exacerbate emotional strain, affecting mental well-being and leading to decision fatigue. Neglecting to address these biases can result in a cycle of self-doubt, anxiety, and even depression as traders grapple with the consequences of poor decision-making. It is therefore crucial that traders proactively identify and address these biases to enhance their trading performance.
Strategies to Mitigate Emotional Biases in Trading
Managing cognitive biases necessitates a combination of self-awareness, disciplined practices, and structured strategies. Below are several effective strategies for traders seeking to mitigate the impact of these biases on their performance:
1. Establishing Robust Trading Rules:
The foundation of effective bias management begins with establishing and adhering to a comprehensive set of trading rules. These rules should encompass entry and exit strategies, risk management protocols, and the use of analytical indicators. For example, a trader might establish a rule requiring confirmation from multiple indicators before executing a trade or a maximum loss limit for each position. The key is not only to formulate these rules but to commit to them unwaveringly.
Read Also:
2. Implementing Comprehensive Risk Management:
A well-defined risk management framework is crucial for surviving biases. Strategies should include:
- Determining Appropriate Leverage: Assess personal risk tolerance before determining leverage levels to avoid overexposure.
- Size of Positions: Proper positioning helps manage risk and ensures that no single trade can devastate the overall portfolio.
- Utilizing Stop Loss and Take Profit Orders: Automation tools like stop-loss orders can safeguard against emotional decision-making during stressful market fluctuations by enforcing predetermined exit points.
3. Engaging in Self-Reflection:
Self-reflection is an indispensable tool for combatting biases. Traders should engage in regular reviews of their trading behavior, documenting both successful strategies and costly mistakes. Identifying patterns associated with specific biases allows traders to recognize triggers and adopt strategies to counteract those influences effectively.
4. Solidifying a Trading Strategy:
Developing a well-structured trading strategy and following it closely is paramount. Traders should create their strategy based on research and conviction, thoroughly test it on a demo account, and ensure that it aligns with their risk appetite and market conditions. A clearly defined strategy acts as a buffer against emotional impulses and helps traders stick to their principles.
5. Enhancing Emotional Regulation:
Cultivating emotional control is essential for managing biases. Traders can benefit from mindfulness practices, such as meditation or breathing exercises, to foster a disciplined mindset during trading sessions. By learning to respond to market fluctuations calmly, traders can maintain objectivity and sidestep impulsive reactions to changes in the market.
Read Also:
6. Embracing Small Losses:
Accepting small losses as a normal part of the trading process is crucial. Acknowledging that no trader is infallible reduces the tendency to hold onto losing positions in anticipation of a rebound—straying further from sound decision-making and risking greater losses. Establishing predetermined loss thresholds can aid in cuts early and effectively.
7. Diversification of Investments:
Diversification is a powerful strategy for mitigating risks associated with cognitive biases. By spreading investments across various asset classes and sectors, traders can minimize the impact of a single adverse event on their overall portfolio. This strategy helps cushion the ramifications of poor decisions based on biased reasoning.
Read Also:
8. Utilizing Technology and Trading Tools:
Advances in technology offer numerous tools to obstruct the influence of biases. Automated trading platforms can execute trades following preset guidelines without emotional interference, allowing for a disciplined approach to trading. Utilizing algorithms and trading bots to strategically execute trades based on well-defined rules can provide additional layers of safeguard against cognitive distortions.
Conclusion
In conclusion, recognizing and addressing emotional and cognitive biases is essential for anyone involved in day trading and investing. The pervasive and profound impacts of these biases on decision-making processes can lead to substantial financial fallout, making it imperative for traders to employ strategies that enhance self-awareness, risk management, and disciplined adherence to trading plans.
By actively working to identify, understand, and counteract cognitive biases, traders can equip themselves with the mental fortitude necessary to navigate the complexities and vicissitudes of the financial markets. Investing time and effort into mastering one’s psychological landscape is not just a theoretical exercise; it is an essential undertaking that can pave the way for more consistent performance and long-term success in the world of trading.
✅ Please share your thoughts about this educational post in the comments section below and HIT LIKE if you appreciate! Don't forget to FOLLOW ME; you will help us a lot with this small contribution

Transitioning from Successful Demo Trading to Live TradingHow to Avoid Choking Your Live Account
The journey from demo trading to live trading is often more challenging than most traders anticipate. The image you’ve shared captures the key steps of this transition—from mastering a demo account to navigating the psychological hurdles of live trading. While demo trading is an essential part of a trader’s education, live trading introduces emotional and psychological challenges that many traders find difficult to manage. Let’s dive into the key stages and explore how to transition successfully without choking your live account.
1. Successful Demo Trading
At the start, many traders achieve consistent results in demo trading. In a demo environment, there’s no real money at stake, which allows for calm, calculated decisions and plenty of room for mistakes. It’s here that you develop and fine-tune your strategy without the fear of financial loss. However, the ease of success in a demo account can create a false sense of security about your readiness for live trading.
2. Transition to Live Trading
Moving from demo to live trading is a crucial moment. Many traders believe that because they are profitable in demo trading, they are automatically ready to replicate that success in a live account. However, the difference between the two is the introduction of real money and real emotions. The fear of loss and the pressure to protect your capital can interfere with the clear thinking that guided you in the demo environment.
3. Overthinking Begins
In live trading, overthinking is a common problem that often creeps in early. Unlike demo trading, where decisions flow effortlessly, live trading introduces hesitation. Traders tend to question their strategies, second-guess their analysis, and get caught up in minute details that don’t necessarily matter. The fear of making a wrong decision becomes amplified when real money is on the line, often causing traders to overanalyze market movements.
4. Paralysis by Analysis
As overthinking intensifies, traders can fall into what is known as paralysis by analysis. This happens when you analyze the market so extensively that you become too hesitant to make any trading decisions. Constantly doubting your entry points, second-guessing signals, or being afraid of missing out can lead to missed opportunities and a lack of trading action. At this stage, fear dominates logic, and traders may either overtrade or avoid trading altogether.
5. Trading Failure
Inevitably, if you allow overthinking and paralysis to take control, it can lead to trading failure. This failure isn’t necessarily about blowing your account—it’s about failing to follow your trading plan, succumbing to emotional decisions, and deviating from the strategy that made you successful in demo trading. Fear of losing, coupled with poor decision-making, can lead to a downward spiral.
6. Need for Strategy
When traders hit a rough patch, they realize the importance of sticking to a well-defined strategy. A consistent strategy should not only outline entry and exit points but also incorporate risk management, stop-loss placement, and clear goals. At this stage, traders must revisit their demo strategies and adapt them to the emotional reality of live trading. Importantly, the need for strategy isn’t just about the technical side—it’s about managing emotions and sticking to the plan under pressure.
7. Implementing Strategies
Having a solid strategy is one thing, but implementing it consistently in live trading is a different challenge. This stage is where traders must learn to trust their strategy, let go of the fear of losses, and maintain emotional discipline. It’s crucial to trade small positions at the beginning to minimize the emotional impact of any losses. Gradually scaling up as confidence grows allows for emotional adjustment without the added pressure of large financial risk.
8. Successful Live Trading
The final stage is successful live trading, where traders have mastered not just the technical aspects of their strategy but the emotional and psychological elements as well. Success in live trading is marked by consistent execution of a plan, disciplined risk management, and the ability to stay calm during market fluctuations. At this point, you’ve learned to manage your emotions, handle losses gracefully, and take profits when the time is right.
Tips to Avoid Choking Your Live Account
Start Small: When transitioning from demo to live trading, start with a small account. Even if you’re profitable in demo trading, your psychological state will change when real money is at stake. Trade with smaller positions until you feel comfortable managing your emotions in a live setting.
Have a Trading Plan: Stick to the same strategies that worked in your demo account. A well-defined trading plan will give you clear guidelines to follow, even when emotions run high. Make sure your plan includes risk management and contingency plans for when trades don’t go your way.
Control Emotions: Live trading introduces a range of emotions—fear, greed, anxiety, and excitement. The key to success is emotional discipline. Set your stop losses and take profits before entering a trade and avoid changing your plan mid-trade based on emotion.
Risk Management: Risking too much on a single trade is one of the fastest ways to lose your live account. Never risk more than 1-2% of your total account balance on any trade. This will help you stay calm and reduce the emotional pressure to win every trade.
Accept Losses: Losing trades are part of the game. Even professional traders have losing trades, but they manage those losses with proper risk management and emotional control. Accept that losses are a part of trading and avoid chasing the market or trying to win back losses impulsively.
Regular Reflection: After each trading session, take time to reflect on your trades. What went well? What could have been improved? This reflection will help you adjust and improve your strategy over time.
Conclusion
Transitioning from demo trading to live trading is more about managing emotions than it is about mastering the technical aspects of trading. While the technical skills you develop in demo trading are essential, emotional discipline is what separates successful live traders from those who struggle. By starting small, sticking to your strategy, and managing your risk, you can avoid choking your live account and set yourself up for long-term success in the markets.

Understanding the Psychological Landscape of TradingTrading is not just about numbers, charts, and strategies—there’s a critical psychological component that often plays a decisive role in a trader’s success or failure. The image you've shared, titled "The Psychological Landscape of Trading," visually captures some of the key emotional states that traders frequently navigate: Emotions, Fear, Hope, Greed, Frustration, and Boredom. Let’s break down each of these elements and understand how they influence trading behavior.
1. Emotions: The Root of Decision Making
In trading, emotions often dictate our decisions. Whether consciously or subconsciously, how we feel can lead to impulsive choices, clouding our logical thinking. Emotions are not inherently negative, but when left unchecked, they can distort the way we interpret market signals. To manage emotions effectively, traders must develop self-awareness and practice emotional regulation to ensure that decisions are based on analysis rather than emotional reactions.
2. Fear: The Barrier to Risk-Taking
Fear is a powerful driver in trading, often resulting in hesitation or avoidance. Traders who experience fear might avoid taking necessary risks, miss opportunities, or exit trades prematurely. Fear can stem from previous losses, market volatility, or uncertainty about the future. Overcoming fear requires building confidence through education, experience, and sticking to a well-defined trading plan that includes risk management strategies.
3. Hope: The False Comfort
While hope may seem like a positive emotion, in trading, it can lead to irrational decisions. Traders may hold onto losing positions far longer than they should, hoping that the market will reverse in their favor. Relying on hope rather than strategy can magnify losses. A successful trader knows when to let go of hope and accept losses as part of the trading process.
4. Greed: The Trap of Overtrading
Greed is one of the most dangerous emotions in trading. It can push traders to take on excessive risk, chase unrealistic gains, or continue trading beyond a well-planned strategy. Greed often leads to overtrading, ignoring risk management rules, or staying in winning trades for too long, hoping for an even larger profit, only to watch it disappear. To avoid falling into the greed trap, discipline and sticking to a plan are essential.
5. Frustration: The Reaction to Unmet Expectations
Frustration occurs when trades don’t go as expected. This emotion can lead to revenge trading—attempting to recoup losses with risky, impulsive trades—or simply to a loss of confidence. It's important to recognize that losses are a part of the trading process and maintaining a long-term perspective helps in managing frustration. Traders need to learn from their mistakes and adjust strategies accordingly.
6. Boredom: The Gateway to Poor Decision-Making
Boredom can be surprisingly dangerous in trading. When the market is slow or a trader has not executed a trade in a while, boredom can lead to forcing trades or taking unnecessary risks just to feel engaged. This lack of patience and discipline can result in poor decision-making and unnecessary losses. Traders should recognize when boredom strikes and avoid taking trades just for the sake of action.
Balancing the Psychological Landscape
Success in trading requires not only technical knowledge and market understanding but also the ability to manage these psychological factors. Developing emotional discipline, having a clear plan, and understanding when these emotions are influencing your decisions can help you stay on track and improve your performance.
In conclusion, the key to navigating the psychological landscape of trading is maintaining balance. By recognizing and addressing emotions like fear, greed, hope, frustration, and boredom, traders can develop the resilience needed to thrive in the financial markets.

1D CHART BITCOIN BULLRUN GUIDEThe Idea is simple. We will have 3 hits to the EMA50 on the 1D timeframe on Bitcoin. We saw this price action during the 2021 Bullrun aswell. Check the 1D chart back then. We flushed the many longs positions out of the market yesterday. It was crystal clear imo that we flush on the 1st day of uptober. We can also say that 3 is a psychological number - google it. So 3 hits to the 1D chart EMA50 seems possilbe. Time will tell. Trade SAFE!

Possible 3 hits to the high on BitcoinThis is a trade of my Paper Trading Training - 20netrust Trading Bootcamp
Bitcoin makes a possible third hit to the high. It's around 4pm. I consider the current move to the upside as a stop hunt. 3 is a psychological number and appears often on charts. I use this approache as in this case. We are still in the sideways range, but I think we will see the low of the range again.

Psychological Levels and Round Numbers in Technical Analysis
When traders analyze the key levels, quite often then neglect the psychological levels in trading.
In this article, we will discuss what are the psychological levels and how to identify them .
What is Psychological Level?
Let's start with the definition.
Psychological level is a price level on a chart that has a strong significance for the market participants due to the round numbers.
By the round numbers, I imply the whole numbers that are multiples of 5, 10, 100, etc.
These levels act as strong supports and resistances and the points of interest of the market participants.
Take a look at 2 important psychological levels on EURGBP: 0.95 and 0.82. As the market approached these levels, we saw a strong reaction of the price to them.
Why Psychological Levels Work?
And here is why the psychological levels work:
Research in behavioral finance has shown that individuals exhibit a tendency to anchor their judgments and decisions to round numbers.
Such a decision-making can be attributed to the cognitive biases.
Quite often, these levels act as reference points for the market participants for setting entry, exit points and placing stop-loss orders.
Bad Psychological Levels?
However, one should remember that not all price levels based on round numbers are significant.
When one is looking for an important psychological level, he should take into consideration the historical price action.
Here are the round number based levels that I identified on AUDUSD on a weekly time frame.
After all such levels are underlined, check the historical price action and make sure that the market reacted to that at least one time in the recent past.
With the circles, I highlighted the recent reaction to the underlined levels. Such ones we will keep on the chart, while others should be removed.
Here are the psychological levels and proved their significance with a recent historical price action.
From these levels, we will look for trading opportunities.
Market Reaction to Psychological Levels
Please, note that psychological levels may trigger various reactions of the market participants.
For instance, a price approaching a round number may trigger feelings of greed, leading to increased selling pressure as traders seek to lock in profits.
Alternatively, a breakout above/below a psychological level can trigger buying/selling activity as traders anticipate further price momentum.
For that reason, it is very important to monitor the price action around such levels and look for confirmations .
Learn to identify psychological levels. They are very powerful and for you, they can become a source of tremendous profits.
❤️Please, support my work with like, thank you!❤️

Why does investor behaviours never change?The consistency of investor behaviors stems from the fundamental aspects of human psychology, which remain largely unchanged over time.
Achieving proficiency in investing requires not just a surface-level understanding of psychology, but a deep and nuanced comprehension that can only be acquired through years of observation and study. And you need work with your own mindset.
Market dynamics are driven by the actions of its participants, who are essentially human beings. Whether in the short term or the long term, market movements are a reflection of human behavior.
This doesn't diminish the importance of analytical skills in investing; rather, it underscores the crucial role that understanding human behavior plays. Even someone with exceptional analytical abilities may struggle to succeed in investing without a keen insight into human psychology.
Because human behavior tends to remain consistent over time, investor behavior also remains consistent. As a result, markets will continue to exhibit familiar patterns and tendencies as long as they are driven by human participation.
Throughout 2022 - 2023, a common narrative has permeated discussions:
* We will see 2008 financial crisis.
* Interest rates are poised to increase
* The belief is that the Federal Reserve will no longer intervene to rescue the markets.
* Btc its just a cat bounce, sp500 should go down to 2800
* There is no new alt season
* AI trend its a Dot com bubble
And many other.
people love to find some LOGIC or patterns, because its will be much easier play the games in "experts"
Yet, there's a fundamental flaw in this narrative: human behavior.
We have a tendency to forget lessons learned and revert to our previous habits. As global crises begin to recede, history shows that we often resume our previous patterns.
In other words, we revert to our old ways: buying, buying, and buying once again.
Human nature and the market are constants that remain unchanged over time. Understanding our typical behaviors, whether good or bad, is essential.
To excel as an investor, one must delve beyond just grasping the fundamentals or technicalities of investing; it's crucial to delve into human behavior. This entails studying not only market behavior but also human behavior in general.
By releasing expectations of instant wealth in the market, we can appreciate its intricacies. The market serves as a remarkable platform where one can glean insights into money, business, psychology, history, and, most significantly, oneself.
It's a rigorous system that penalizes errors but also bestows rewards for wise decisions.
At the end just reduce your expectations, and just simply trade assets not your wishes.
Hope you enjoyed the content I created, You can support with your likes and comments this idea so more people can watch!
✅Disclaimer: Please be aware of the risks involved in trading. This idea was made for educational purposes only not for financial Investment Purposes.
---
• Look at my ideas about interesting altcoins in the related section down below ↓
• For more ideas please hit "Like" and "Follow"!

Gamblers and a traders The difference between a gambler and a player, as well as the similarities between a player and a trader.
The player and the gambler are very often confused; if we are talking about gambling itself, then this is a psychiatric problem. If you come across conditional roulette, then you will always catch the trigger, absolutely every time it will cause the same positive emotions that roulette caused you before and this will direct the Vector of your behavior and thinking towards trying to play again. That is, the only solution is to leave. If we are talking about players, that is, is the trader a professional gambler, I 100% agree with this. That is, a player is a person who wants to win, and for a gambler it’s a game for the sake of playing.
When a person, so to speak, trades, he will form a certain technical picture in some market, he will see some specific situations that lead to a result that is understandable to him. Look for understandable patterns that lead to understandable, logical results! There will be a positive mathematical expectation and a negative one! Everyone remembers this story about 10 thousand hours! So, by analyzing charts and studying information, you can grow as a player and a trader, and if you just sit and look at the roulette wheel for 10 thousand hours where red and black appear, nothing will change, it will just be an accident!
You also need to understand that there are gamblers in trading who open a trade for the sake of trading, in order to be in a position and feel some kind of emotion! This is already a problem! People who have lost regularly in casinos or sports betting will always deny that it was a problem for them! It’s the same in trading, if you open a thoughtless series of positions just to be in the market and feel emotions, this is already a problem, not gambling yet, but already a problem!
Therefore, in trading, a large part of success is occupied by psychology and working on oneself! Mastering the technical side is much easier than defeating yourself!
Therefore, it’s probably still self-analysis and the ability to critically evaluate one’s actions
The results and actions that lead to these results are very important! In the game for the sake of playing it does not exist, the game is for the sake of the game, it is maintained due to emotional passion, in the moment only if you play longer and the moment stretches out, that’s all!
Be attentive to your emotional state!

OvertradingOvertrading is a common issue in trading and can lead to significant losses. It occurs when a trader excessively opens and manages positions, often due to psychological and emotional factors. To avoid overtrading, consider the following strategies:
Establish a Solid Trading Plan: Having a well-defined trading plan is crucial. Your plan should outline entry and exit strategies, risk management rules, and criteria for position sizing. Stick to this plan and avoid deviating from it due to emotional impulses.
Risk Management: Limit the amount of capital you risk on each trade. A common guideline is not to risk more than 1-2% of your total trading capital on a single trade. This approach helps protect your capital from significant losses.
Diversify Your Portfolio: Avoid putting all your capital into a single trade or asset. Diversifying your investments across different assets can help spread risk and reduce the temptation to overtrade a single asset.
Set Trading Hours: Define specific trading hours or sessions during which you'll be actively trading. Outside of these hours, avoid opening new positions or making impulsive decisions. This approach can help maintain discipline.
Emotional Control: Recognize the emotional triggers that lead to overtrading, such as desperation, overconfidence, or impatience. When you feel these emotions, take a step back from trading, focus on your trading plan, and practice mindfulness techniques to manage emotions.
Monitor Your Trading Frequency: Keep track of the number of trades you execute in a day or week. If you notice you're trading excessively, it's a warning sign of overtrading. Review your trading activities and identify what drove you to make those trades.
Limit the Number of Open Positions: Setting a maximum number of concurrent open positions can prevent overtrading. This restriction forces you to be selective and prioritize quality over quantity.
Use Stop-Loss and Take-Profit Orders: Implementing stop-loss and take-profit orders can automate your exit strategy. This reduces the temptation to constantly monitor and adjust trades, which can lead to overtrading.
Trade Size: Be mindful of your position size relative to your account balance. Avoid increasing position sizes disproportionately after a series of wins. Stick to a consistent position sizing strategy that aligns with your risk tolerance.
Take Regular Breaks: Trading for extended periods can lead to fatigue and emotional decision-making. Schedule breaks to clear your mind and refocus your trading strategy.
Remember, trading is a long-term endeavor, and success is not determined by individual trades but by your overall performance. Avoid the allure of quick profits and stay disciplined in following your trading plan to mitigate the risks associated with overtrading.
Hope you enjoyed the content I created, You can support with your likes and comments this idea so more people can watch!
✅Disclaimer: Please be aware of the risks involved in trading. This idea was made for educational purposes only not for financial Investment Purposes.
---
• Look at my ideas about interesting altcoins in the related section down below ↓
• For more ideas please hit "Like" and "Follow"!

What is FOMO? Syndrome of lost profit in tradingFOMO is the lost profit syndrome.
Now it is especially common due to the popularity of smartphones and social networks. Many are simultaneously afraid of social isolation and worried about lost opportunities. A similar situation is possible in trading. As soon as traders see a bullish trend, they start opening trades and buying those assets that match their analysis. In addition, a lot of information, thoughts and impressions are concentrated around us, which only aggravates the situation. Let's figure out how to deal with such an obsessive fear.
The syndrome of lost benefit is a strong fear of missing an important event or a profitable opportunity. This fear is especially pronounced against the background of the bright life of friends and acquaintances. After all, then there is a feeling that you are wasting time in vain. SUVs are directly related to dissatisfaction with personal life, and social networks only increase the unpleasant state.
The greater the dissatisfaction, the greater the desire to find others. And the need for new information turns into intrusive thoughts.
FOMO is distinguished by the following features:
-Frequent fear of missing something important;
-Constant use of language turns like "everything but me";
-The desire to delve into all forms of social communication (attend all the parties, go to concerts, etc.);
-Obsessive desire to always be liked by others, accept praise and be available for communication;
-The need to constantly update the feed on Facebook, Instagram and other social networks.
How to get rid of lost profit syndrome?
-Constantly responding to messages and checking the crypto rate every 2 minutes, you waste a lot of time. Therefore, you should establish clear rules for using a PC and a smartphone:
-remove unnecessary programs and turn off pop-up messages in programs that are not of great importance;
-leave groups and unsubscribe from accounts that are not useful to you;
-refuse unnecessary e-mails;
-check news and stock quotes no more than twice a day (for example, in the morning and in the evening);
-do not take your smartphone to bed and do not sit on the Internet before falling asleep;
make two separate schedules - for working with personal and business messages.
Five tips — how to avoid the FOMO syndrome as an investor
Instead of succumbing to the fear of missing out, you can change your life for the better and find success in the cryptocurrency field. Here are our 5 tips on how to avoid FOMO affecting your investing.
1. Forget about the past
What has already happened in the market is irrelevant from FOMO's point of view. There are not many investors who look at past quotes. Successful investors always take the time to analyze when opening a trade: they look at the current state of assets and assess their prospects in the future based on past price charts.
The idea that the chance can be one for a lifetime is completely false. There are always and always will be profitable opportunities, just as the market always was and always will be. Charts will never tell you what an asset will be like in a year, two or five years. They simply provide information about events and possible future probabilities. Therefore, competent long-term investors understand that it is never too late to buy assets, it is important to navigate them and make balanced decisions.
2. Buy when everyone is selling and sell when everyone else is buying
There is an opinion that on the stock exchange it is necessary to go against the trend. Of course, it is easy to talk about it, but to translate all this into reality is much more difficult. After all, the effect of the lost profit syndrome only increases when you do not invest in an asset that is growing.
The "anti-cyclical" behavior is explained as follows: the most successful purchases with possible high returns occur during a fall in the rate and general panic, and sales - during a rise in value, when everyone is eager to buy bitcoin or another crypto as soon as possible.
However, this tactic does not at all mean a ban on buying tokens in an uptrend. It is inextricably linked to the next tip, so it should be taken in the same context.
3. Set clear goals
Remember the chosen strategy and determine the goals when buying this or that cryptocurrency. One possible option is target cost. If the stock price has reached your indicator, feel free to sell the asset and lock in the profit, or set a stop loss, with the hope that the trend will continue.
Many traders use a simple rule - it is better to receive 4 thousand dollars 10 times than to wait six months for 50 pieces. If the deal in a short period of time brings 50% profit or more, it is better to close it. And this should become a proven mechanism.
Usually, when the value of a cryptocurrency starts to increase rapidly, many market participants buy it. You can understand this in time and, having sold the asset, watch the further growth that is already taking place by inertia. The growth will stop only when the rest finally realizes that the coin is "overheated" and no longer has the potential for growth. Conclusion: While most buy the coin on the rise due to FOMO, you sell the crypto and get your profit.
As for purchases at a reduced price, not everything is so smooth either. After all, not everything will be so profitable that it has become cheaper. Here it is necessary to look at the reasons for the price drop on the chart. If unforeseen circumstances have occurred, for example, a lawsuit by the state regulator in court, then you need to determine what value of the asset will become the most attractive for you in the current period, or how critical the situation with the lawsuit is.
Of course, I mentioned isolated cases here. In order to analyze all possible situations in the market, you need to publish an entire online almanac. Each case has a common feature — the psychology of human behavior. Therefore, do not give in to general panic or joy.
4. If there are no investment ideas, wait
The famous stock speculator and Wall Street investor Jesse Livermore used to say the following: "Big money doesn't buy or sell, big money waits"! It is true, because one day you will not be able to find more interesting coins to invest. There will be very few of them, and the crypto market will continue to conquer new heights.
5. Your strategy is the main thing
If you managed to accumulate knowledge in some area of trading, learned SmartMoney analysis, know how to set goals and evaluate the potential of a particular token, it will bear fruit, but continue to develop further, because there are no limits to perfection! :)
New trading tools, technologies and new tokens appear every day that promise to bring significant profits and make cryptocurrency trading as convenient as possible. Do not follow the tricks of speculators. Become the best in your field. Keep a clear mind and don't be influenced by the masses.
Hope you enjoyed the content I created, You can support with your likes and comments this idea so more people can watch!
✅Disclaimer: Please be aware of the risks involved in trading. This idea was made for educational purposes only not for financial Investment Purposes.
---
• Look at my ideas about interesting altcoins in the related section down below ↓
• For more ideas please hit "Like" and "Follow"!

XAUUSD 15m (BTMM)using the theory of cycles within cycles and repeatable patterns (fractals) we can anticipate high probability trade setups that may develop and play out with speed. This leads to low stress easy money

Game of probabilitiesBINANCE:BTCUSDT
The proper attitude and understanding of trading principles are fundamental to achieving success in the trading world. This article is aimed at aspiring traders who want to thrive in this field.
Trading is a probabilistic game , where outcomes are based on probabilities, either happening or not happening. It's crucial not to have rigid expectations or demands from the market or other participants. In the world of trading, no one owes anything to anyone, and this principle applies universally. When trading, you have the freedom to express yourself, and you can approach it in various ways. However, this freedom also reveals how humans can be irrational creatures, often struggling to control their thoughts, emotions, and actions. The key challenges faced by all traders are taking excessive risks and lacking self-control, which ultimately leads to financial losses.
The feeling of missing out is a common trigger that can push traders to make unwise decisions. It begins with a sense of having missed potential profits. When observing a favorite asset's price surge, traders may start fantasizing about the potential gains and become obsessed with buying more, driven by the desire to earn even more due to a larger volume. Such emotions can lead to entering trades without proper awareness or acceptance of the potential consequences, which can be detrimental.
The main point to remember is that successful trading relies on understanding probabilities, maintaining emotional discipline, and not allowing emotions to override rational decision-making. Traders should approach the market with a calm and rational mindset, following a well-defined trading plan that includes risk management strategies. By controlling emotions and adhering to systematic approaches, traders can increase their chances of success in the volatile world of trading.
Reflecting on your trading journey and evaluating your achievements so far is a crucial aspect of being a successful trader. It is essential to be honest with yourself about the level of risk you are willing to take. If you realize that you are not prepared to risk everything you have, it is vital to question the impulse that drives you to consider such high-risk actions. Often, the desire to take extreme risks stems from the longing for significant life changes. However, it is crucial to fully comprehend the risks involved before making any impulsive decisions.
The "filter of perception" refers to the cognitive biases that arise when traders have specific expectations of positive trade outcomes. Once you create such expectations, your consciousness may become biased, and you might unconsciously ignore information and market signals that contradict your preconceived notions. This phenomenon is akin to putting blinders on your perception, preventing you from objectively evaluating market conditions.
The danger lies in holding onto false expectations throughout a trade, leading to potential losses or missed opportunities. This filter of perception can be difficult to recognize until you close a trade and look back, realizing that your expectations were not in line with reality. To overcome the dangers of expectations, it is crucial to approach trading with objectivity and discipline. Stick to a well-defined trading plan, follow your risk management strategies, and avoid making decisions based solely on emotions or impulsive desires. By doing so, you can maintain a clear perception of the market and make more informed and rational trading choices.
Trading is not a suitable endeavor for everyone.
It requires continuous self-improvement, emotional control, critical thinking, and strict adherence to established rules. Success in trading is not guaranteed, and it demands a level of dedication and mental fortitude that may not resonate with everyone. If you find that trading does not align with your strengths, interests, or personality, it's essential not to be disheartened. Each individual has unique talents and passions, and success can be achieved by pursuing endeavours that truly align with your inner potential and aspirations. In essence, trading is a probabilistic game, and having the right attitude is crucial. It involves making decisions based on probabilities, understanding that outcomes are uncertain, and embracing a systematic approach. Emotions should not dictate trading decisions, especially when experiencing stop losses. Instead, employing a methodical strategy with a certain success rate allows you to stay on track and eventually realize profits over time.
It's important to enjoy the trading process and feel positive emotions while engaging in it. These positive emotions can help you navigate the challenges and avoid falling into the "trader's cycle," where emotional turmoil can hinder your decision-making and overall trading performance. In summary, trading requires a unique set of skills and characteristics. If trading does not resonate with you, it's okay to explore other avenues that align better with your natural inclinations. Success can be found in various fields, and the key is to focus on your true passions, continuous improvement, and leveraging your inherent strengths.
System trading involves following a specific set of conditions to enter a trade. These conditions can encompass various elements, such as chart patterns, candlestick formations, indicators, and even unconventional factors like astrological dates. The crucial aspect is that the trading system has a high percentage of success (working out) and a favorable risk-reward ratio. Once you have developed your own trading system, it is vital to maintain a trade diary. In this diary, you should meticulously record the rules of your trades, including the circumstances that prompt you to enter a trade. Regularly self-testing your decisions against these predefined criteria will elevate your trading skills, leading you to become a top-tier trader and empowering you to profit from the market consistently. By adhering strictly to your trading rules, you will achieve a balanced mindset. Whether a trade results in a take profit or a stop loss, you will understand that you acted systematically and followed your predefined strategy. Recognise that the outcome of each trade is not a reflection of your worth as a trader; it is simply a consequence of adhering to your rules and facing the inherent uncertainties of the market. System trading provides a structured approach to trading that relies on predefined conditions for entering trades. Keeping a trade diary and consistently self-testing against your established rules will significantly enhance your trading capabilities. Embracing a systematic approach will help you achieve a more balanced outlook, and the ultimate goal is to achieve consistent profitability by leveraging your well-designed trading system.
Fear and doubt are common emotions that can hinder a trader's decision-making and lead to destructive outcomes. It is essential to acknowledge and reject these emotions to maintain a clear and rational mindset while trading. One primary reason for fear and doubt before opening trades is the fear of risking too much capital in a single trade. Drawing an analogy to a coin toss, where tails come up 70 percent of the time, we understand that even with a high probability of success, there will still be occurrences where heads come up multiple times in a row. Similarly, in trading, there might be instances where a series of stop losses occur despite following a systematic approach. To overcome this fear, it is crucial to manage risk effectively. Traders should risk only a small percentage of their capital on a single trade, ideally one to two percent. By doing so, even if a stop loss is triggered, it will not significantly impact emotional balance or overall trading performance. The objective is to prevent falling into the "trader's cycle," where emotional reactions drive decision-making rather than a systematic approach. Before determining the optimal risk amount, traders should ask themselves what the purpose of their trading is. Is it to relentlessly increase the size of their capital at any cost, or is it to steadily grow and protect their capital? By prioritizing capital preservation and consistent growth, traders can achieve a more disciplined and sustainable approach to trading. In conclusion, managing fear and doubt is vital for successful trading. Utilising a systematic approach, managing risk, and focusing on capital preservation and growth will help traders stay emotionally balanced and make well-informed decisions in the dynamic and unpredictable world of trading.
Trading frequency is an important aspect that new traders should carefully manage to avoid "overtrading" and prevent "trading burnout." The key is to exercise patience and wait for the formation of a new system setup on the chart before entering a trade. Checking the chart excessively, like every ten minutes, can lead to impulsive decisions and emotional trading, which are detrimental to a well-thought-out trading strategy. Instead, traders should define specific timeframes for entering trades, focusing on higher timeframes for more reliable signals. Higher timeframes offer a broader perspective of market movements and reduce the impact of short-term noise and volatility. When it comes to managing take profits and stop losses, consistency with the trading system is paramount. Regardless of the number of stop losses received in a row or consecutive take profits, sticking to the pre-established rules of the trading system is essential. It is crucial to avoid deviating from the system, even during challenging market conditions or moments when technical analysis may seem ineffective.
Maintaining a systematic approach and being in control of emotions during trading can help traders endure a series of stop losses without significant emotional distress. A well-designed trading system should have a statistically validated edge, such as a 70% probability of working out, and a favorable risk-to-reward ratio of at least 2 to 1. With such a system, even if only 27% of trades are successful, profits can be generated over the long term. In summary, managing trading frequency and adhering to a well-defined trading system are vital for success in the trading arena.
Practicing patience, controlling emotions, and maintaining a systematic approach based on statistical probabilities will help traders navigate the markets with more confidence and consistency.
Hope you enjoyed the content I created, You can support with your likes and comments this idea so more people can watch!
✅Disclaimer: Please be aware of the risks involved in trading. This idea was made for educational purposes only not for financial Investment Purposes.
---
• Look at my ideas about interesting altcoins in the related section down below ↓
• For more ideas please hit "Like" and "Follow"!

⌛ It's Just A Matter Of Time📍Journey Of a Successful Trader
No one started as a good trader. Every profitable trader was once a newbie. The journey of a successful trader is filled with challenges, hard work, and perseverance. It begins with a strong desire to learn and a commitment to become an expert in the markets they are trading.
📍The Right Path To Reach The Top
🔹Learn the basics of Trading
🔹Pick a Strategy that you fully understand
🔹Trading plan customized to your lifestyle
🔹Back Testing your strategy and plan
🔹Review your Trades, calculate your expectancy
🔹Demo Trading to build basic knowledge
🔹Live Trading, Manage your risk and emotions
🔹Professional Trader
📍Summary
The first step in the journey is to acquire the necessary knowledge and skills. This includes learning about the financial markets, technical analysis, risk management, and trading psychology. Successful traders also develop a trading strategy that fits their personality and trading style.
Once they have acquired the necessary knowledge and skills, successful traders spend countless hours studying the markets, analyzing charts, and monitoring news events that may impact their trades.
👤 @AlgoBuddy
📅 Daily Ideas about market update, psychology & indicators
❤️ If you appreciate our work, please like, comment and follow ❤️

First Republic Bank Continues Below $5Merely an update to my previous idea.
And well... I started this idea before the bell, and it was $3.51 at the time.
It's now $2.01 post as of typing this but that will be different already.
I think I will just post this as is, because it's moving too quickly to make any rational conclusions.
To be noted, every time $15 was broken, the market dumped it below preventing it from becoming proper support.
Now, the HKEX:5 line is going to be doing similar tricks on it and FRC fell below it.
Notice the two more recent dead cats I have professionally marked 😼
I did not have HKEX:3 price line on my previous chart, but I see that now there's a clear line there as well.
Only psychological levels matter at this point.
Same ideas:
*It's a personal opinion of mine that psychological levels, whole number resistance and support, should have this much control over price action.
Psychological levels have the most effect when there's extremes of emotions. I feel it's rather self-explanatory.
It's either going towards zero or it's getting bought to prevent it from hitting the pavement.
The variance in price alone is a clear indicator its in deep trouble while it was just downgraded to BB.
Previous low on charts of $17.60 is notable, while HKEX:20 pertains to psychological significance.
Below this, I see little more than psychological levels.
HKEX:10 , double digits. HKEX:5 , where select exchanges consider a stock a penny stock. HKEX:1 , where the rest consider it a penny stock.
You can label a ton of this chart a deadcat bounce here or there.
Please add thoughts. I didn't see a Fibonacci ladder helping much because the price action was too chaotic.
DYOR/DYOC.*

Biases that influence your decisions Biases that influence your investment decisions
Most people who invest in the stock market don't reach their goals. The top 1% of investors can double or even triple their returns from the market.
Reason: how investors think
How this article will help you avoid these biases: * Awareness - Knowing what biases affect your decision making is half the battle.
*Routine: I've made a list of biases that affect your analysis and biases that make you overestimate investments.
Cognitive frivolity
All of the following biases work so well because of the way people's minds work. Cognitive light-mindedness is a state of mind that is wanted and linked to good feelings. This is the main reason why people make bad choices.
Halo effect
It is much easier to think in black-and-white stereotypes than in gray ones. The halo effect explains why we like or dislike everything about someone or something that is connected to them. It's harder than we think to agree with some ideas and disagree with others.
What You See Is All There Is
All there is is what you see. You can't think about something you don't know. In a strange way, self-righteousness goes up when you only listen to one point of view. Again, we choose certainty over uncertainty.
Anchoring
Our decisions are mostly based on the first information we get. If you know that Apple shares are worth $150, they will look like a good deal at $120. Not even knowing if $150 is close to what something is really worth.
Regression (Correction)
We love to find links between things that don't have any. Regression to the mean can be one of the most important, but often overlooked, factors. Due to price balancing, everything tends to be worth about the same.
Perceptual bias
We think that events were easier to predict than they really were because of what we already thought. In hindsight, it's easy to make up connections between things. The truth, though, is more complicated. There are a lot of good ways to guess what will happen.
The Fallacy of Mastery
Both buyers and sellers know the same things. They buy and sell stocks based on what they think. People don't believe that short-term stock picking is good luck because it's done by smart people.
Loss aversion
Loss aversion makes us ignore even gambling that has a good chance of going our way. A loss has twice the weight of an equal gain.
Dedication bias
Commitment is linked to good traits like consistency and intelligence. In this way, we don't break our promises. Investment decisions must be talked about in public. The more you talk, the more you can persuade yourself of something.
Leaning toward recent events
We tend to give too much weight to things that have happened recently. Because of this effect, the market tends to move in a certain direction most of the time. When things are going well, we think they will only get better. We think that when things go wrong, they will only get worse.
Effect of ownership
When we own something, we value it more. This is one way we can explain why we did what we did. Before we buy a stock, we look at it critically and try to find any risks. After making a purchase, we think about the good things about it to justify our choice.
This is called confirmation bias
We choose what to believe based on what we already know. What doesn't fit with our ideas is either ignored or called a lie.
Thinking based on odds
We often think based on how we feel. But in our lives, everything is a game of chances. Using reasoning to think about the most likely outcomes will help us make better decisions.
Hope you enjoyed the content I created, You can support with your likes and comments this idea so more people can watch!
✅Disclaimer: Please be aware of the risks involved in trading. This idea was made for educational purposes only not for financial Investment Purposes.
---
• Look at my ideas about interesting altcoins in the related section down below ↓
• For more ideas please hit "Like" and "Follow"!

Psychological state in tradingThe important point is to describe your psychological state in two cases:
When you are not in a trade.
When you are in a trade.
In the first case, the common problem is missed profit. Often, novices take this very painfully and think about the missed opportunity that could have brought them potential profit. However, the market, especially the cryptocurrency market which operates 24/7 without breaks, has many trading ideas and opportunities, so there is no need to fixate on it or torment yourself with it.
Therefore, when you are not in a trade, try to describe your psychological state, what you feel at that moment, whether it's the fear of potential loss from missing a trade or something else.
In the second case, when you are in a trade, you need to describe your state, what worries you. It could be greed to fixate profit or fear of losses. In both states, you need to fully describe yourself, the trading setups that cause such emotions.
To avoid these emotional swings, you should have a clear plan for taking profit and an approximate loss in case of failure before entering a trade. When you do not have such a plan, you will swing back and forth, and the outcome may be negative. Therefore, when you are in a trade, describe your state in detail and document it in a journal related to your psychology, as psychology is 80% of successful trading.
All these aspects will help you learn more about yourself and your psychology, which will enable you to build your trading strategy, as psychology accounts for 80% of successful trading. That's why soulless machines, neural networks, and AI are so good at trading compared to humans with their emotional instincts.
Because many people want more profit here and now, they are not willing to bear losses, develop, or understand themselves. Due to this incorrect psychological mindset, people often lose money and then blame trading for being a casino. Of course, it's a casino for ludomaniacs who, without a strategy, listen to "experts on Instagram" and are already turning to the 30th leverage for a short.
I hope you understand why this aspect is necessary. Nevertheless, in subsequent articles, we will try to describe more about psychology in trading.
Hope you enjoyed the content I created, You can support with your likes and comments this idea so more people can watch!
✅Disclaimer: Please be aware of the risks involved in trading. This idea was made for educational purposes only not for financial Investment Purposes.
---
• Look at my ideas about interesting altcoins in the related section down below ↓
• For more ideas please hit "Like" and "Follow"!

Watch big round numbers and their halvesSee how price reacts at 1000 pips increments (1, 1.10, 1.20, 1.30) and their quarters (1.25, 1.05, 1.075 and so on).
The reaction at those levels is nearly guaranteed. Once price hit 1.10 recently, we saw a pullback of 350 pips to the downside.
Those psychological levels will be highly useful to any trader. They work well on majors (USD baed pairs), less so on crosses.
For educational purposes only.

🧊The Iceberg Illusion In TradingThe iceberg illusion in trading refers to the perception gap between what people think trading is and what it actually means. Many people see trading as a simple way to make quick profits and accumulate wealth, with the idea that all one has to do is buy low and sell high. However, the reality is far more complex. Under the surface of what appears to be a straightforward process lies a world of risk, stress, and uncertainty. Trading is not just about making money, it requires discipline, patience, and a deep understanding of the markets. Those who don't understand the true nature of trading may face financial loss, depression and failure, much like the hidden dangers beneath the surface of an iceberg. Success in trading often requires much more than just a basic understanding of market trends and patterns, and those who dive in without being fully prepared may face dire consequences.
🔷 Above the Iceberg
Above the iceberg, people often see the glamorous and attractive side of trading, characterized by success, wealth, and financial independence. They imagine traders as confident and knowledgeable individuals, making smart decisions and reaping the rewards of their investments. The image of traders making large profits in a short amount of time is one that is often perpetuated by media and popular culture. People often see the stock market as a fast-paced, exciting place where opportunities for financial gain are abundant, and the idea of being able to control one's financial future through trading is alluring. This perception of trading often creates a rosy and idealized image of what it entails, leading many to believe that success in the markets is easy to achieve.
🔶 Bellow the Iceberg
Below the iceberg, lies the reality of the challenges and difficulties that traders face on a daily basis. There are many hidden risks and uncertainties that are not immediately apparent to those who are new to the world of trading. Some of the things that people don't know that lie beneath the surface of the iceberg include:
🔸 Market volatility:
The stock market is a highly volatile environment, and prices can fluctuate rapidly and unpredictably. This can make it difficult for traders to manage their positions and minimize their losses.
🔸 Emotional stress:
Trading can be a highly emotional experience, and the pressure to make the right decisions can be immense. Many traders struggle with anxiety, fear, and depression, particularly when faced with losing trades.
🔸 Lack of understanding:
The stock market is complex, and it can be difficult for traders to understand all of the factors that influence market trends and prices. This can lead to costly mistakes and an increased risk of financial loss.
🔸 Competition:
The stock market is a highly competitive environment, and traders must be able to keep up with fast-moving markets and make quick decisions based on complex data and information.
🔸 Long-term success:
Many traders are focused on short-term profits and may not consider the long-term impact of their trading decisions. Achieving lasting success in the markets requires a well-thought-out strategy and a strong understanding of the markets and the risks involved.
🔸 Timing:
Successful trading often requires precise timing, as markets can change rapidly and prices can fluctuate. Traders must have a deep understanding of market trends and be able to make quick decisions to take advantage of opportunities.
🔸 Risk management:
Trading involves risk, and traders must be able to manage their positions and minimize their losses. This requires a well-planned and executed risk management strategy, including setting stop-losses and taking profits at appropriate levels.
🔸 Knowledge and experience:
Trading is not just about buying low and selling high. It requires a deep understanding of market trends, economics, and financial analysis, as well as years of experience to develop a successful trading strategy.
🔸 Discipline:
Trading requires discipline and patience, as well as the ability to stick to a well-thought-out strategy. Many traders make impulsive decisions based on emotions or market rumors, which can lead to financial losses.
Welcome to the hardest game in the world.
👤 @AlgoBuddy
📅 Daily Ideas about market update, psychology & indicators
❤️ If you appreciate our work, please like, comment and follow ❤️

The "So-Called" Psychology of a Market Cycle!Greetings Dear Investors and Traders, today CryptoQueens, an educational post regarding the so-called Psychology of a Market Cycle.
When making investment decisions, investors have a wide variety of tools at their disposal. While these tools can form the basis of a sound investment thesis, their effectiveness is limited by one’s emotions. Allowing emotions to dictate decisions is a common mistake made by many investors, yet they may not even realize it. People experience different emotions during these market cycles ranging from fear to greed. Below we will analyze, as well as you will find attached in the chart image the different emotions experienced by investors during market cycles which overwhelms the majority of the traders:
Disbelief:
This phase happens after the bottom has been hit. There is a sense of disbelief among investors about the rally. They believe just like it happened in the past few months, the markets will fall again. Their fear of making another mistake causes them to miss the optimal window to re-enter the market.
Optimism:
During this phase, the realization dawns on most of the investors that the rally is real. Investing during this phase if stocks are chosen well can give good returns.
Enthusiasm:
This is the time when the majority of investors are convinced about the market rally, therefore market demand rise. They believe that now is the time to be fully invested. Some naysayers still don’t believe in the market rally and advise caution.
Euphoria:
This is the phase where there is irrational exuberance in the markets. Investors share a collective dopamine as they think that they are genius because they made a fortune. It is advisable to stay cautious during this phase.
Overconfidence/Greed:
Investors continue to increase their positions despite high volatility.
If you buy during this phase, you are sure to lose money, whatever you buy.
Anxiety:
Fear sets in, as losses begin to mount.
Investors believe that the dip is taking more time than expected. This is the the moment when people are notified with margin calls due to the recent market fall. Anxiety kicks in.
Denial:
The herd ignores the market signs as market demand weakens. They believe that since their investments are in great companies, they will bounce back.
Panic:
Herd mentality takes over and market participants rushes to sell leading to widespread selling even at losses. This is a good time to buy extremely selectively for the long term as it may be very difficult to know even for well-informed investors whether we are in the denial phase, panic phase or capitulation phase.
Capitulation:
Market Participants accepts their losses and completely exit the market. They are selling close to the bottom of the cycle.
Agony/Anger:
Steep losses take a psychological factor in many investors and they start to blame the government, or anything correlated, perceiving it as market manipulation.
Depression:
This is the period when investors believe that their retirement savings are gone and their financial security is affected. They even start blaming themselves for investing. However, markets inevitably starts to recover.
Conclusion:
As an investor, you need to recognize these signals and never lose sight of the bigger picture. It is like Warren Buffett once mentioned. Be scared when others are greedy and greedy when others are afraid. Therefore, keep an eye on the fundamentals and behavioral factors that influence the market and always remain ahead of the game. Make sure you include this in your trading plan before to take action on it.
If you liked it, make sure to support with a like, follow and a comment!
Best Regards, CryptoQueens.
