Good pull back to $365 | Long BiasDaily Chart
Netflix NASDAQ:NFLX has downed from $485 to $431.6 now
Netflix has the support zone around $365 that is good level to buy for next bull run
Wait for next move
Pullback

SPY with a Classic RestestTraders,
In my last post I alluded to SPY. I stated that it remained in breakout territory which is still true today. I stated that as long as we remain above 450, I remain bullish. Still true. In fact, all that has happened here is that we have a classic retest of previous resistance taking place currently. If we break below, another story may unfold and I will have to re-assess. But as of this post, 450 is holding strong and the retest (if it holds) is yet another rather bullish signal.
Stay tuned,
Stew

BSDE - PULLBACKI bought my positions today
July 31, 2023
The reasons:
1. Low-risk entry
2. A pullback to breakout level
3. It is in a confirmed stage 2 uptrend
4. It has a high relative strength line
5. A crisp pullback buy point
I start a pilot position today, I like to see some follow-through action from this point.

AUD USD H1 BUYIt's currently correcting and it may not correct in the main uptrend and go sharp but I'm entering here.

SILVER Local Short! Sell!
Hello,Traders!
SILVER broke the key
Horizontal level then went
Up to retest the new
Resistance of 24.47$ from
Where I think we will see
A local bearish pullback
Sell!
Like, comment and subscribe to help us grow!
Check out other forecasts below too!

GBPJPY: Bearish Forecast & Outlook
Balance of buyers and sellers on the GBPJPY pair, that is best felt when all the timeframes are analyzed properly is shifting in favor of the buyers, therefore is it only natural that we go long on the pair.
❤️Please, support our work with like & comment!❤️

NZD-JPY Strong Breakout! Sell!
Hello,Traders!
NZD-JPY was trading in an
Uptrend along the rising
Support but the a strong
Breakout happned, followed
By the rebound and now
We are seeing the pair
Being close to retesting
The supply area formed
By the supply confluence
Of the rising and falling
Resistance line so I am
Bearish biased and I
Think that we will see
A bearish move down
Sell!
Like, comment and subscribe to help us grow!
Check out other forecasts below too!

CADJPY - Bearish Double TOP📉Hi Traders👋🏻
On The Daily Time Frame The CADJPY Price Reached A Resistance Level (107.400-107.812) and 61.8 fibonacci retracement level !
Currently, The Price Formed a Double Top Pattern📉
The Neckline is Broken🔥
So, I Expect a Bearish Move📉
i'm waiting for a retest...
-----------
TARGET: 104.950🎯
___________
if you agreed with this IDEA, please leave a LIKE, SUBSCRIBE or COMMENT!

GBP/AUDFast intraday search through my watchlist.
You can follow the price with candle confirmation or whatever strategy you have.
None of these are 100 %, complete confident analyses.. this market is all about probability .. so try to work on your risk management and self-control.. all the traders in the world can tell for sure what's going to happen or where the price is going in the next 1 hour.
Ps. Leave your comment and thoughts.
I posted this position a couple of days ago .. still valid.

GBP/AUDFor this week, I'm looking at GBP/USD for opportunities to enter sell positions, as I showed on the chart ..
the price has been moving in a trading range ( NOT A CLEAN ONE) for some time now.
We have a resistance zone where the price had been rejected a couple of times .. last week, the price broke the resistance for 10 hours max but came back to our range with a big black candle and also made a pullback to our highlighted zone .. in lower time frames; if the price breaks the 15 min low then there's a good chance were you can follow it to the cluster made by a dynamic trend line and the last low in 4h time frame.
Please Tell me what you think about this. Leave your comment and thoughts.

AUDJPY LONG PROJECTIONAUDJPY on daily showing strong bullish momentum with EMA's crossed over confirming buyers coming into the market with a resistance turned into support broken as well as the trendline. On our H4 execution timeframe we are seeing a pullback to the broken daily trendline and H4 support zone which will set us up for long positions once the trendline and support have been retested and rejected.

Golden ticket go to next stop $740Weekly chart
MicroStrategy NASDAQ:MSTR has broken up descending trend line and now it's pulling back to the support around $380
It's time to get in and go to next stop
Wait a confirmation around the support

TOMMY XAU | BASIC MARKET STRUCTURE Good afternoon gold gang!
Thought id jump on here to talk to you about basic market structure, as its the basis for any strategy and super important to learn.
We can identify that the market moves 3 ways ..
up trend
down trend
sideways (consolidation)
I prefer to trade when the market is trending in either direction. I determine this by looking at the monthly and weekly candles.
In a trending market, i am looking to identify areas that the market can reverse from. If we are making a higher high for example .. I can identify that price is likely to pull back down to the key level it started its ascent from. From there i can wait for confirmations on the lower time frame to take a trade in the direction of the trend.
obviously this doesnt work everytime .. news etc .. but its always good to have it in the back of your mind the phase of the market you are currently in.
you will find with my strategy .. that price will make new structure points around my key levels ( the ones i place on my chart)
Hope this helps some of you out .. back to basics is sometimes the way to go if you are getting overwhelmed with information
Have a great sunday and see you tonight for the outlook
tommy

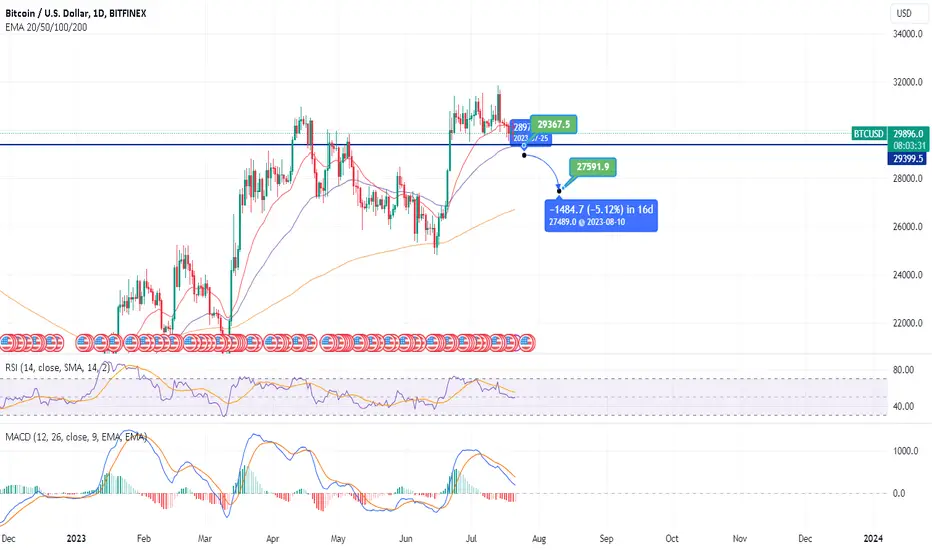
expecting a downside to 2 main target bitcoin is having a big deal into the 30,000 resistance
first target is 29300 which is the 50MA,
Second support area is 28300
this short term fluctuation is not an indicator to see 21,000 again.
25-26k unlikely but sure why not
28k'sh is the more realistic range before heading to 30k again on September as investors are waiting for 25 points less on interest rates
✅TESLA SWING SHORT🔥
✅TESLA will be retesting a resistance level of 313.00$ soon
From where I am expecting a bearish reaction
With the price going down but we need
To wait for a reversal pattern to form
Before entering the trade, so that we
Get a higher success probability of the trade
SHORT🔥
✅Like and subscribe to never miss a new idea!✅

FTM.H4Entry Tips for Selling
pull back
MTR
Return to break point
bear trend
short candle
BIG CYCLE COLOR
Come to the ring to support
Sales position

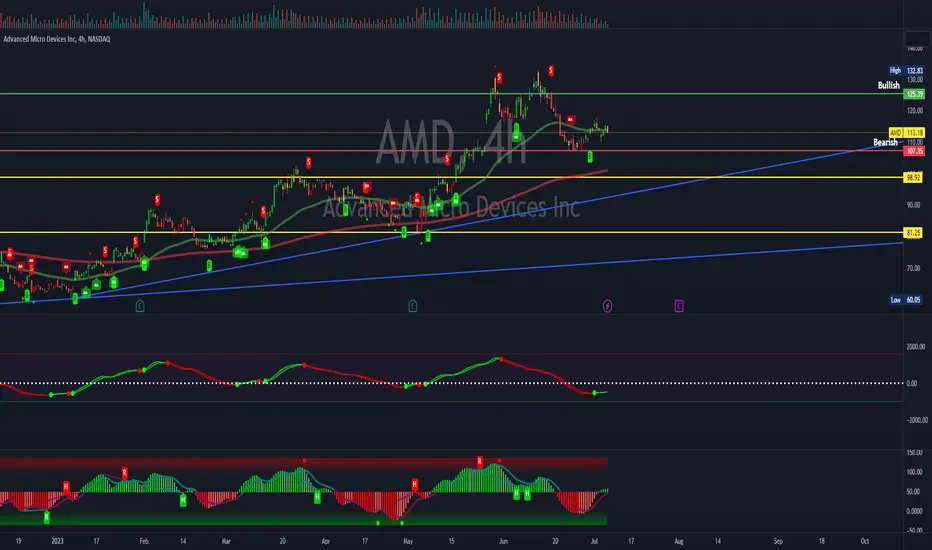
$AMD the 2nd fiddle fizzle?Looking at NASDAQ:AMD , you can see that AMD struggles to hold above $125. This brings up the question, "Will it be able to catch up to NASDAQ:NVDA ?" It appears that more time is needed. AMD remains a solid company with the potential to continue capturing more market share. Although AMD's chips are not primarily used for AI, it doesn't mean the company won't try to enter this race. Meanwhile, NASDAQ:INTC hasn't made substantial progress but continues to hold on to most of their legacy market share. Therefore, I like where AMD stands as it continues to close in on Intel.
Bullish Case - At present, AMD has tested the $125 level twice, suggesting that it is searching for more support. Let's see if AMD can find support and take a third shot at it soon. I see a great opportunity to monitor the levels to determine if we can make a lower high or accumulate below in a consolidation phase before breaking out to challenge the $125 level again.
Bearish Case - Let's be serious, there is a reason for this double top. It's time for it to make a significant pullback. It needs to pull back to the .618 Fibonacci level. Fine, bulls, you are in an uptrend, but enough of the parabolic move—let the ticker breathe.
Conclusion - Being below the CheatCode Swing 0 line favors the bear case to provide support in a commonly targeted area of Fibonacci retracement, yet looking at the CheatCode Squeeze momentum indicates a potential continuation of the bullish trend. This could leas to chop and indecision.
Bullish above $125.39
Bearish below $107.35
CADCHF - Are We Still In An Upwards Trend?Analysis:
Looking at the chart things may look bearish to the untrained eye as we've had a strong recent move to the downside, however price to us still looks bullish and this is the last line of defence so we expect that this is where most of the bulls will be wanting to push price higher from. We still think that price is in an upwards trend as we haven't broken the most recent higher low. Whilst some people may think we put in another higher low at the top of the move, we didn't as price didn't break higher so we never formed a higher low, just a higher high, meaning that our area we have marked out is where the most recent higher low is. This may be difficult to understand but this is how we see the market trend. At this area we have marked out, in the past we can see that this level has held as both support and resistance so we'd expect this to happen again, making it a great possible entry zone. To add to our idea we also have the 50% fib retracement level which has been tagged so we expect to see some sort of bullish pressure from this level as this is where some bulls will be sat at wanting to hold price and push it higher, which goes in favour of our idea. Fundamentally the CAD is the 4th strongest major currency compared to the CHF which is the 3rd weakest major currency, so this is already favouring our bullish idea. As of the most recent report for institutional positioning we did see a big decrease in long positions but we saw a 2 times bigger decrease in short positions so this is bullish for the CAD. For the CHF, in regards to institutional positioning we did see an increase in both long and short positions so this is slightly bullish for the CHF, but not as bullish as the CAD is. Tomorrow we have some big news coming out for the CAD so this could give us the catalyst that we need to see price head to the upside and for the CAD to make its bullish run. Fundamentals are what actually drive the markets, so whilst the technicals don't look that clear to the untrained eye, the fundamentals are clear. The CAD is stronger then the CHF. This is why overall we are bullish on CADCHF.
Please feel free to leave any comments you have and like this idea if you agree with us. Any feedback or comments will be read and responded to. We any comments at all so thank you!
Stay Safe - The JPI Team
Disclaimer:
This does not constitute as financial advise. We are not responsible for any monetary loss that you endure. Trading is hard to be profitable with and we take losses just like everyone else does too. Our ideas won't always be correct which is why we urge you to always do your own analysis first before entering into the market but please feel free to use our analysis to assist you with yours.

USDJPY - Is This Just A Healthy Pullback?Analysis:
Recently price has just been heading higher and higher on this pair, and we've been looking to catch this move for a while now but we needed to stay patient and wait for a pullback and that's exactly what we might have now. Price has pulled back to a key level of prior resistance and as we know, resistance often becomes support, so this is starting to look like a potential place to enter long. We're also still in an upwards trend as the most recent higher low hasn't been broken so this move to the downside is just a healthy pullback rather then a break of structure. At our area of previous resistance now turned support we also have the 61.8% fib retracement level which is often classed as the strongest fib retracement level so we'd expect that buyers would be sat at this area wanting to hold price and push it higher. On top of that we also have an upwards trendline touch, which acts as dynamic support, so we'd expect buyers to also be sat at this area wanting to hold price and push it higher. All of these technical confluences line up together and signal that this area could hold and provide bullish momentum so we like the look of this. We don't just have the technicals on our side but we also have the fundamentals too. Fundamentally the USD is the strongest major currency compared to the JPY which is the weakest major currency, so this massively goes in our favour. As of the most recent report for institutional positioning we saw the USD stay pretty bullish whereas for the JPY we saw an increase in long positions but we also saw an almost 2.5 times bigger increase in short positions compared to long positions opened. This signals that there is still more possible bearishness to come for the JPY, making it favourable to short rather then going long. With all of the technicals and fundamentals lined up together we have a very strong bias to the long side of USDJPY.
Please feel free to leave any comments you have and like this idea if you agree with us. Any feedback or comments will be read and responded to. We any comments at all so thank you!
Stay Safe - The JPI Team
Disclaimer:
This does not constitute as financial advise. We are not responsible for any monetary loss that you endure. Trading is hard to be profitable with and we take losses just like everyone else does too. Our ideas won't always be correct which is why we urge you to always do your own analysis first before entering into the market but please feel free to use our analysis to assist you with yours.

Hang tightWe may see a short term strong pull back soon, hang tight. I don't think is going to crash but it is possible a test of the bottom of the wedge.

Ethereum Short Term Buy IdeaD1 - Bullish trend pattern followed by a correction in the form of double wave down.
Price respected a strong support zone and bounced higher.
Most recent downtrend line breakout.
H4 - Bullish trend pattern.
Currently it looks like a pullback is happening.
Until the two strong support zones hold my short term view remains bullish here.

AUD-CHF Bearish Breakout! Sell!
Hello,Traders!
AUD-CHF broke the rising
Support and is now making
A pullback after which
I will be expecting a
Bearish continuation
Sell!
Like, comment and subscribe to help us grow!
Check out other forecasts below too!

CADJPY I Approaching pivot support Welcome back! Let me know your thoughts in the comments!
** CADJPY Analysis - Listen to video!
We recommend that you keep this pair on your watchlist and enter when the entry criteria of your strategy is met.
Please support this idea with a LIKE and COMMENT if you find it useful and Click "Follow" on our profile if you'd like these trade ideas delivered straight to your email in the future.
Thanks for your continued support!
