GBPUSD have bottomed?Has GBPUSD bottomed? Price action suggest that it has. Since GBPUSD dropped to $1.036, higher lows pattern have formed WITH contracting pattern (tightening). From that pattern I drew a trendline.
Price broke the key moving averages confluenced with the trendline break. Currently price is retracing back to its mean 50/100/200 after testing several times the $1.163 level.
Actionable plan : wait for the price to test the key moving averages (keep it simple) and identify a rejection at those level and then Long.
*Rejection could be anything. but preferably confluenced with pocket pivot (blue bar or green bar at volume indicator)
Pullback

BTC Scalping AnalysisHello guys.
i think i saw a good bullish divergence in RSI and price in 4H time frame.
What do you think about that?
is this a pullback to 20000 level??
Share me your opinion
thanks

GOLD - BREAK OF STRUCTURE 📉The XAUUSD price is in 0.5 FIB Level 🧐
the Higher Low is broken 🔥
so, i predict a bearish move 📉
TARGET: 1622.845🎯
...
if you agreed with this IDEA, please leave a LIKE, FOLLOW or COMMENT!

EURUSD Bullish Continuation EURUSD gathered momentum and rallied bullishly hitting my initial targets before pulling back.
Price is now in a corrective phase before resuming the bull trend.
Watch out for reversal confirmation on the highlighted support level.
Possible buying opportunity LINK CryptocurrencyWelcome
We have a break in the structure with an increasing momentum for buyers, so if the price reaches the block of orders before breaking the high, we can activate a buy trade, then the targets are as shown in the chart. If the high is broken before the price reaches the block of orders, the order will be canceled

Important week for EURUSD This week, we have FED Interest Rates.
This is the most important event for the market right now!
We're probably going to see big fluctuations in price and the best opportunities will be after the news on Wednesday.
One option is to wait for EURUSD to go near 1,0090 and see if there will be a rejection during the news.
If price action confirms the entry, then that will be a great setup.
We're not sure if price will rise and reach that level so we don't recommend looking to buy immediately!

EUR-USD Still Bullish! Buy!
Hello,Traders!
EUR-USD broke the falling resistance
Last week and went up, but is now making
A pullback to retest the broken resistance
But the breakout is a breakout
So I am still bullish on the pair
Thus, after the retest the price
Will probably go up
Buy!
Like, comment and subscribe to boost your trading!
See other ideas below too!

DOW JONES Resistance Ahead! Sell!
Hello,Traders!
DOW JONES is trading in a downtrend
In an opening wedge and the price
Is about to retest the falling resistance
From where a bearish pullback
Will be expected
Sell!
Like, comment and subscribe to boost your trading!
See other ideas below too!

After ECB, it's FED's turn Yesterday ECB raised the rates just as expected.
There wasn't much of a reaction which most likely means, everything will be decided during FED next week.
Technically, we had a rejection of the 1,0090 level.
A potential entry would be on the re-test of that level and further rejection.
We have to wait for confirmation, the upside move is done and we are going to see a continuation of the downtrend!

✅EUR_USD WILL GO UP|LONG🚀
✅EUR_USD broke the long-term
Falling resistance and is now retesting
The broken line which is now a support
From where a move up is expected
With the first target being the breakout high
LONG🚀
✅Like and subscribe to never miss a new idea!✅

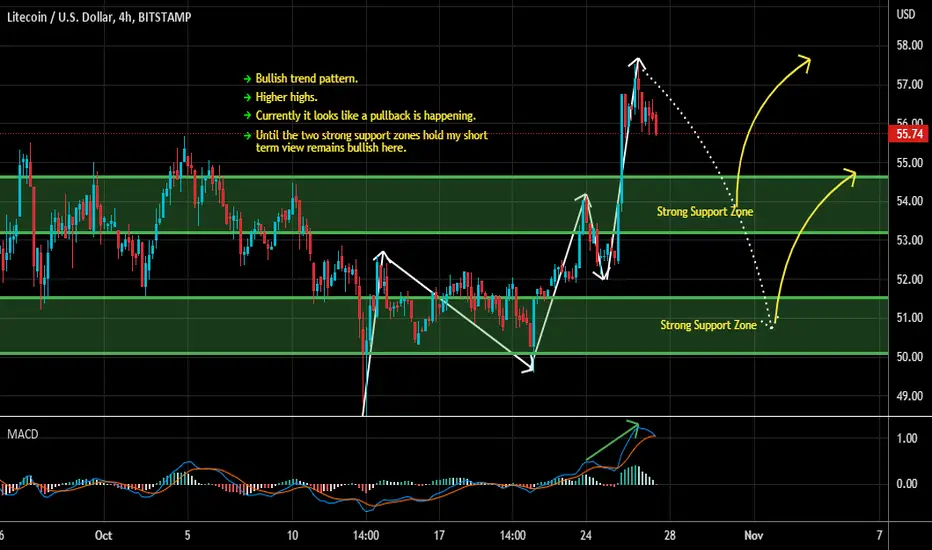
Litecoin - Looking To Buy Pullbacks In The Short TermH4 - Bullish trend pattern.
Higher highs.
Currently it looks like a pullback is happening.
Until the two strong support zones hold my short term view remains bullish here.
CADCHF - BEARISH TRIPLE TOPThe CADCHF price is in Daily Resistance Level & Bearish Triple Top Pattern🧐
the neckline is broken 🔥
so! i predict a bearish move 📉
TARGET: 0.71560 🎯
...
if you agreed with this IDEA, please leave a LIKE, SUBSCRIBE or COMMENT!

Important news for EURUSD Today we have ECB Interest Rates decision.
We should see them going up by 0.75%.
No matter what will be the bank's decision, we're going to see big moves on EURUSD.
We could see more bullish pressure on EURUSD, but we have to keep in mind that FED is also coming out with their decision soon.
That means, whatever upside move we see today, it could reverse pretty soon.
That's why, we think the best decision today would be to wait for the news and look for entries after that.
Also, price reaching higher levels will only give us a better sell opportunities.

✅NZD_CAD WILL GO UP|LONG🚀
✅NZD_CAD broke the key structure level
While trading in an local uptrend
Which makes me bullish
And I think that after the retest of the broken level is complete
A rebound and bullish continuation will follow
LONG🚀
✅Like and subscribe to never miss a new idea!✅

Bitcoin MonthlyFinally we have a nice bullish pullback.
Pullback doesn't mean bullish trend guys.
Patient is the key to be profitable.
Just follow my boxes and you'll be good.
All you need to know to trade safe and with profit.

Trading RSI Divergences LIKE A BOSS (I may have failed you)Get your copy of the Free Heiken Ashi Algo Oscillator
I'm not going to lie. There is WAYYY too much technical stuff to type up in this for you guys. its best if you watch the video. Always Always Always ask questions below. I am always more than happy to show you what's what.
This is some UPPER LEVEL STUFF in this video and i know a lot of you won't fully understand it but i want you to understand what it is that you DON'T KNOW about.
Unless you know these things, you won't know what questions to ask about. So here we go. Let's get into it.
Trading the RSI Divergence like a BOSS
After the RSI Divergence is found:
On the chart: (KEYS)
1 = last HH
2 = current HH
3 = 1st HH Closing Price
4 = Confirmation of candle closing BELOW 1HH close price
5 = Find your targets
6 = Pinpoint any target with multiple confirmations
Steps to take:
1. See last Highest High
2. Draw a line across the last Highest High close price.
3. Confirm second HH is higher price but lower RSI value.
Now wait....
4. Wait for candle to close below price of step (2)
5. Enter SHORT if (Heiken Ashi Candle is closing RED)
6. Your 50ema is Take Profile #1 (Set it up)
7. Your swing high is your stop loss
8. What does the RSI Formula tell you? Is it in the positive? So what! Use the same numbers but trade SHORT. Yep, that what i said, TRADE IT IN REVERSE! This is Take Profit #2
9. Do the Fibonacci trick to confirm which is closer (tp 1 or tp2)
10. Look left for the most recent area of Liquidity. It's a candle with a long wick up or down where price reverses sharply.
11. Scan the Algo for a price level WITH volume. You have found your target. Adjust your take profit and walk away.


AUD CHF LONG TRADE Market structure
price action
wave analysis
order blocks
momentums
pullback
impulse wave

EURUSD continues to rise In the beginning of the week, we talked about price reaching its current levels of 0,9950 and then sell.
However, yesterday we had an impulse move up and right now we won't be looking for short positions yet.
After such a move, we are actually expecting a continuation higher.
Tomorrow we have ECB Interest Rates which is expected to cause more big moves.
In case of a continuation higher, we are looking at 1,0090 next!
This will be the next level where we will look to sell!

Gold Short Term Buy IdeaH1 - Bullish convergence.
Currently it looks like a pullback is happening.
Until the two strong support zones hold my short term view remains bullish here.

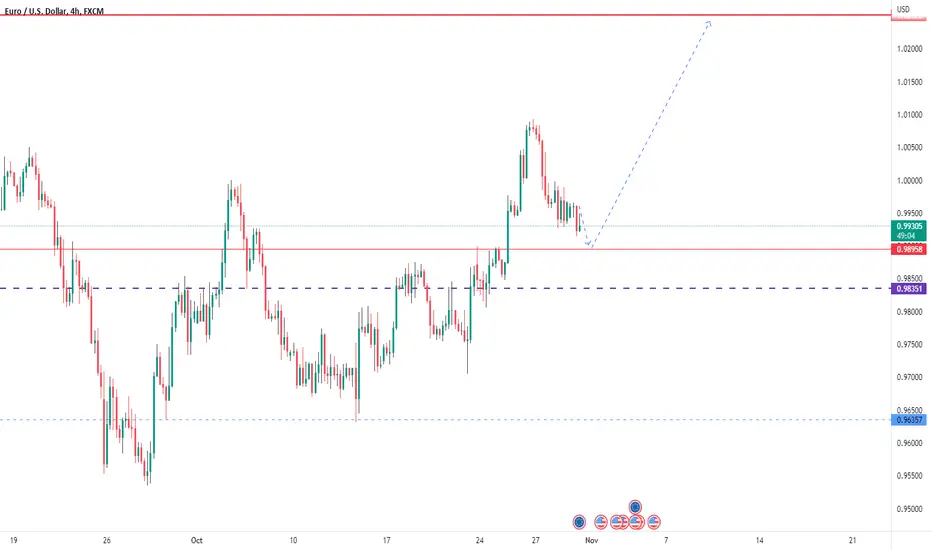
Nothing has changed on EURUSDRight now, the situation on EURUSD remains the same as yesterday.
It's heading towards 0,9950 - the level where we should see a reaction.
It's also important to know that this week, we have ECB Interest Rates.
This will definitely bring some volatility and it also makes the entries before the news more risky.
That's why we have to wait for the right moment only after confirmation.

✅EUR_USD SHORT FROM RESISTANCE🔥
✅EUR_USD is trading along the falling resistance
And as the pair will hit it soon
I am expecting the price to go down
To retest the demand levels below
SHORT🔥
✅Like and subscribe to never miss a new idea!✅

EURGBP showing signs of start of a big push down Weekly and Daily pound took strength from euro, but euro still has strength on monthly, looking for some pull backs on 4 hour and looking to short EG when it happens, going to keep a head up on monthly chart to check which direction for longer term
