💢SELL NZDJPY at the best place and price💰🔰You can see the analysis of the New Zealand dollar to Japanese yen currency pair in a 30-minute time frame (NZDJPY_ 30min) 🔍⚡
💥Considering that the price has broken the Up trend line🖤 and pulled back💜 to it twice❗ If the price can reach the SUPPLY zone, it can experience a fall from this zone to the DEMAND zone🚀🔺
Do you think this analysis can be profitable❓
I hope the analysis was useful for you🤍🌹
________📈TRADER STREET📉_______
Pullback

GBPJPY Short Idea 1:2.6We could see this retest a support area down towards the 167.5 zone
A pullback before possibly further extension beyond 170
small risk on this one
stops around 168.65
target 167.55

Is the pullback on EURUSD over? It looks like the pullback that started at the end of September has already come to an end.
This will provide us with selling opportunities.
If we see that the price comes back to around 0,9867, we can wait for rejection and then sell.
Another sell setup could be a breakout and test of 0,9750.
We are not selling at current price levels!
We are also not looking for long positions!

EURUSD isn't strong enough to continue It looks like the upside move that we're expecting this week doesn't have enough strength to continue.
Yesterday, we didn't see the rejection of the 0,9808 support.
You shouldn't be looking to buy anymore but instead, wait for a sell signal.
We could possibly see a move up towards 0,9915 and that's where we will be looking for potential reversal.

Rise in EURUSD EURUSD bounced off 0,9808 yesterday but it still hasn't moved towards the parity.
We can potentially see another retest of the same level today and that could give us buying opportunities.
The target remains at 1,0090 but we have to watch out around the other important levels- 0,9915 and 0,9999.
This scenario is only valid if price doesn't break below 0,9725!

EURUSD is heading towards 1,0090! The breakout of 0,9808 from yesterday, confirms the ascend of EURUSD.
The first target here will be 0,9915, followed by 0,9999.
All long positions must be closed before 1,0090!
It's important to understand, that this is only a part of a pullback from the higher timeframes and we should see a reversal to the downside soon.
This will be valid only if price doesn't break below 0,9725!

XAUUSD ANALYSIS hello traders
The last wall of sellers has been broken and the price is falling in a corrective manner that will retest the order block and form a higher top

AUDUSD - HEAD AND SHOULDERS 📉The AUDUSD price is in Bearish Head And Shoulders Pattern 🧐
the Neckline is broken ✔
so, i predict a bearish move 📉 im waiting for a pullback 📈
TARGET: 0.62051 🎯
...
if you agreed with this IDEA, please leave a LIKE, SUBSCRIBE or COMMENT!

Important levels for EURUSD We expected more upside movement on EURUSD after the low from last week.
However, it looks like the market doesn't have enough strength and we don't have a reason to buy.
The continuation up will be confirmed upon break above 0,9808.
Before that we could see another drop but right now, we don't have a sell signal either.
That's why we should wait for a better setup before taking a trade.

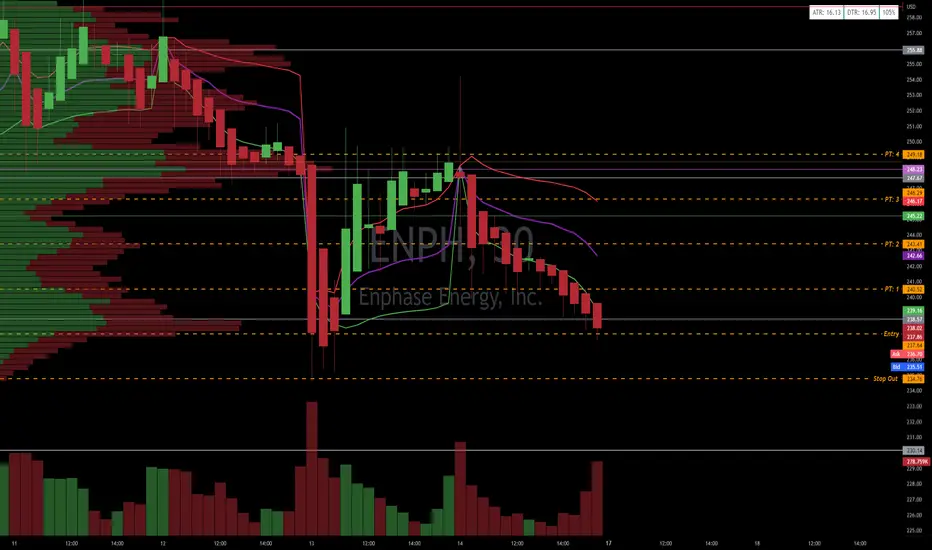
ENPH: Pull Back + Bounce + Active Level RetestBig Picture:
Earnings coming up 10/25/22. Had good Earnings last time. Coming back into aggressive buying from July and last earrings period. (Will the buyers want to fight for the price a little bit now before earnings?)
--------------------------------------------------------------------------------------------------------------------------------------------------------------------------------------------------------------------------------------------------------------
Setups:
07/20/22 - 07/27/22: ENPH broke out out from a volume accumulation + Aggressive Buying
08/02/22 - 09/06/22 Volume Accumulation
09/15/22 - 09/21/22 Volume Accumulation
09/22/22 Aggressive Selling
09/26/22 - 10/04/22 Volume Accumulation
10/05/22 - 10/07/22: Aggressive Selling
--------------------------------------------------------------------------------------------------------------------------------------------------------------------------------------------------------------------------------------------------------------
Intraday Technical:
ATR: 16.13
ATR (200Day): 14.42
DTR: 16.95
%: 105.00%
RVOL: 0.82
Rel Vol (Finviz): 0.75
RSI (14 Day): 30.64
RSI (200 Day): 52.51
Volume: 2,884,739
AvgV: 3.83M
Ch% (FINVIZ): -4.35%
FS%: 3.31%
Shs Outstanding: 135.20M
Shs Float: 132.68M
Inst Own: 75.10%
2 Day VWAP: 244.6
Weekly VWAP: 250.33
Monthly VWAP: 263.01
--------------------------------------------------------------------------------------------------------------------------------------------------------------------------------------------------------------------------------------------------------------
10/13/22
Open: 248.73
HOD: 254.21
LOD: 237.26
Close: 244.59
--------------------------------------------------------------------------------------------------------------------------------------------------------------------------------------------------------------------------------------------------------------
Key Areas of Support:
216.82
230.14
245.49
--------------------------------------------------------------------------------------------------------------------------------------------------------------------------------------------------------------------------------------------------------------
Key areas of Resistance:
257.08
283.43
295.02
315.29
Inflection Point:
245.35
--------------------------------------------------------------------------------------------------------------------------------------------------------------------------------------------------------------------------------------------------------------
Trade Plan:
Look for a pull back to 237.64
If pulls back to 237.64 and see absorption then start long.
If blow through VWAP then Cover and look to add back in a pull back. If add in pull back this is a new trade and make sure to cover this new add at the next neck line.
If hits PT 2 then look for a pull back with absorption and add. Then sell this Add right into the above neckline.
Take original trade to PT 3 and sell
Risk/Reward: 20% of ATR $2.88
Entry: $237.64
Stop $234.76
Exit: $249.18
PT 1: $240.52
PT 2: $243.41
PT 3: $246.29
PT: 4 $249.18
GBPUSD Another Short OpportunityHello Traders,
OANDA:GBPUSD just rejected 1 h 200 EMA or 4h 50 EMA
Expected pullback formation for major bear-market downtrend
Profit Target 1.10300
Profit Target 2 1.09100
Thank You

🌟buy AUDUSD🌟🔰You can see the analysis of the Australian dollar to US dollar currency pair in a 15-minute time frame (AUDUSD_ 15min) 🔍🧨
💥Due to the breaking of the Down trend line🖤 by the price, it can be expected that the price will rise from the pullback zone💜 to the supply zone🚀🔺
Do you think this analysis can be profitable❓
I hope the analysis was useful for you🤍🌹
_______📈TRADER STREET📉______

Where is EURUSD going? The ascending move from yesterday didn't have enough strength to continue higher.
Now it's important to see which level will be violated next.
In case of a breakout of 0,9775, then we're probably heading to the parity level again!
However, if the market breaks below 0,9669 then we will have to see how the setup will develop later on.
Trades at current price levels are considered risky and not confirmed!

Natural Gas: The supply-demand dynamic is at a critical stageDeutsche Bank reported that in a particularly critical phase is the supply-demand dynamics regarding natural gas towards the winter season, which the behavior of households will be decisive in the coming months, as their consumption represents a large percentage of total consumption. A supply failure is likely to be avoided at least as the scenarios confirm that a 20% YoY reduction in consumption this winter (and flat annual demand thereafter) is likely to lead to some shortages either early in 2023 or the winter of 2023/24.
The reduction in Germany remains at 40%, while if demand falls by only 10% YoY stocks will not be exhausted even in such a scenario. For certain, fill levels would fall below 10% in late winter 2022/23, but this would not put energy security in doubt until 2024. The European Commission is working on proposals to limit prices. While negotiating with reliable suppliers, for instance, Norway, and strengthening common markets seem to be the Commission’s preferred options, the idea of a (temporary) price cap on imported natural gas is gaining ground.
The greater the potential for the implementation of a cap the lower the success of the implementation of the first two measures. Such an implementation could lead to increase supply risks, depending on the design of such an import price cap which would accompany the mandatory demand reduction.
From an Elliot wave perspective, we will examine the Natural Gas chart to see its potential move in the short to mid-term.
Looking at the weekly chart, natural gas made an impulsive five-wave rally from the lows, which suggests that low is in place and we can expect a bigger recovery. However, in Elliott waves, after every five-wave rise we can expect a slow down in three waves, so we are tracking now an (A)-(B)-(C) correction before the uptrend resumes. First support is around 5.3 level, while second support would be around 3.5 level.
All the best!
If you like what we do, then please like and share our idea.
Disclosure: Please be informed that information we provide is NOT a trading recommendation or investment advice. All of our work is for educational purposes only.

USDCAD Is Looking Higher Within A Five-Wave ImpulseUSDCAD is breaking higher, now making some extended upward move which is acting like an impulse because of an extended and sharp move up from 1.3. As such, we think this can be impulse wave 3 where pair can slow down for a corrective pullback into wave four. Ideally that upcoming wave four will then stop and stabilize at the upper line of a base channel.
Trade well!
If you like what we do, then please like and share our idea.
Disclosure: Please be informed that information we provide is NOT a trading recommendation or investment advice. All of our work is for educational purposes only.

Important levels on EURUSDWe are still not trading EURUSD and waiting for better entry opportunity.
Current price levels are important to determine what will be the next move.
Right now, EURUSD doesn't give us any entry confirmations but we will be waiting for the 0,9643 level.
In case of rejection around that level, we will have to see if price will gain enough strength to continue higher.
We recommend waiting for further confirmation or pick another pair to trade.

DAX Will Fall! Sell!
Hello,Traders!
DAX has retested a horizontal resistance
After the massive bearish breakout
And we are already seeing a pullback
So as we are bearish bias
A further move down will be expected
Sell!
Like, comment and subscribe to boost your trading!
See other ideas below too!

types of pullbacksIn this lesson, I shared with you the types of pullbacks
Be careful, pullbacks are breaks in the middle of the trend
Poolbacks do not have the strength of main steps
In my opinion, the best type of trading with pullbacks is to recognize the completion of these corrections patterns so that we can move in the direction of the trend at the right point.
Of course, it depends on your trading time frame.

EURUSD H1 analysis Like we said yesterday, the downtrend on EURUSD is still valid and the best trading opportunities will appear as soon as price confirms another downside push.
However, it is still early to enter short and expect to see a breakout of the previous low.
We are now waiting for the pullback to continue and trick us a few more times.
That's why we should reduce the amount of trades and position size before we see a clear setup.
We could potentially see a drop to around 0,9750 and then another push higher maybe taking price above the parity level.

XAUUSD LONG TRADE wave analysis
impulse wave
correction
running flat
support and resistance
liquidity
break out
pullback

No trades on EURUSD Yesterday, EURUSD reached the parity level again.
That means, we could possibly see continuation up in the next few days.
Right now we won't trade EURUSD as current price levels are not good for entries.
We are still in a downtrend on the Daily chart and the best opportunities will be once the market goes back to the downside!

Wait for rejection on EURUSDAfter a very definite downtrend, it's now time for a pullback on EURUSD.
Right now, we don't have any signals to sell yet.
Today, we need to observe and see how it will react between the levels of 0,9850-0,9930.
In moments like this, it is very important to show patience and wait for the right signal to enter a trade.
The downtrend continuation will be confirmed on a breakout of the previous low!

Is it time to sell EURUSD?EURUSD rejected the sell zone on Friday.
Now, we could see the beginning of the next downside move.
You can wait for a confirmation which will be a breakout of 0,9731.
However, selling right now is not yet confirmed as we can easily see price going above 0,9854.
The direction is still to the downside and we are only looking to sell!
