RANGE BROKEN - BEARISH - TOYOTA MOTOR CORP - 30MN - MY IDEASAfter a long period ranging between the two blue lines (support/resistance), we are observing a break out in the downside.
The history of the market tells us that it has several times tried to revert with very strong volumes. ALL FAILED!
Until we had the confirmation of the downside trend.
What to look up next:
Check the volumes and see if it helps the market to revert the trend otherwise there is a high probability for the market to keep decreasing even if the slope have flatten a bit.
Pullbacktrade


Bullish on the US Dollar FutureWe can see that there is a clear range illustrated by the market . The top and bottom blue lines are the new support and resistance.
We have two clear reasons to see that the possibilities for the market going bullish increasing significantly :
-The formation of the candlesticks on the support line, taping the line to rebound .
-Combined with the strong volume bigger than all of the other ones before.
Go bullish for the moment, we are in the middle of the range. Take decision after new analysis when the resistance is reached.
Possibilities:
-Pullback down again (Stay in the range)
-Strong break but return into the same range (To get rid of all buyers)
-Strong break with volumes and the formation of the right candle stick afterwards for a new long entry.
- Beware of the support line which still stays another possibility if it keeps ranging
Timing:
- If already in the market in the long direction exit at the top blue line or the next red candlestick.
- Strong probability to see the top level reached: beginning of next week.

Running back of the ZN1! Waiting for pullback or breakThe market was going down for a while now, with few pullbacks on the supporting blue line .
When volumes increased we noticed a strong break of the support . A powerful move not giving anymore room for a short entry.
Market gave us a signal of return to the support line which is now a resistance line.
Line that have seen some past pullbacks, therefore, we look at possibility of pullback or a break of that line for a change of market trend.

SPX500 SELL SIGNALHey tradomaniacs,
welcome to another free trade-plan.
Important: This is meant to be a preparation for you. As always we will have to wait for a confirmation.
Waiting for break below purple line (Support).
Market Sell-Order: 2886,00
Stop-Loss: 2904,00
Target 1: 2885,50
Target 2: 2853,50
Target 3: 2842,00
Stop-Loss: 18 pips
Risk: 1%
Risk-Reward: 2,65
LEAVE A LIKE AND A COMMENT - I appreciate every support! =)
Peace and good trades
Irasor
Wanna see more? Don`t forget to follow me.
Any questions? PM me. :-)

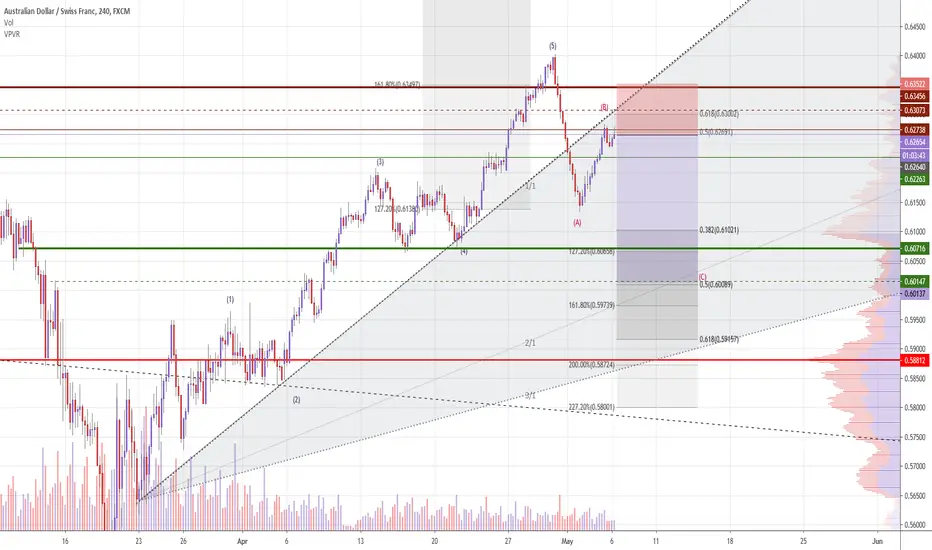
AUD/CHF SELL SIGNALHey tradomaniacs,
welcome to another free trade-plan.
Important: This is meant to be a preparation for you. As always we will have to wait for a confirmation.
Market Sell-Order: 0,62625
Stop-Loss: 0,63525
Target 1: 0,61670
Target 2: 0,60830
Target 3: 0,60150
Stop-Loss: 90 pips
Risk: 1% -2%
Risk-Reward: 2,84
LEAVE A LIKE AND A COMMENT - I appreciate every support! =)
Peace and good trades
Irasor
Wanna see more? Don`t forget to follow me.
Any questions? PM me. :-)
USOIL 3MIN ScalpGoto 3MIN chart and view this idea, ..I cant post min chart here
*Target,stoploss,entry mentioned above
*Concervative wait for the reversal in 1 MIN
*Strictly maintain stoploss
*Feel Free To Ask Your Doubts
*Please Consider To Like
*Follow Me to get regurlar updates
*Show me your support and thoughts in Likes and comments...It Would Be Awesome
*Good Luck
Disclaimer
*The content on this analysis is subject to change at any time without notice, and is provided for the sole purpose of assisting traders to make independent investment decisions.

EURNZD: Pullback setupOverall picture is bearish with recent market ranging close to a month. Latest update was a breakout, which is my setup for a pullback.
Entry: 1.1.7870
SL: 1.7900
TP: 1.7685
Entry can be adjusted lower for higher chance of entry. Similarly, TP can be further optimized for more pips but is subjected to further price action.

AUD/NZD SELL SIGNALHey tradomaniacs,
welcome to another free trade-plan.
Important: This is meant to be a preparation for you. As always we will have to wait for a breakout and confirmation.
AUD/NZD: Swingtrade-Execution
Sell-Limit: 1,06860
Stop-Loss: 1,07750
Target 1: 1,05900
Target 2: 1,05260
Target 3: 1,03930
Stop-Loss: 89 pips
Risk: 1-2%
Risk-Reward: 3,33
LEAVE A LIKE AND A COMMENT - I appreciate every support! =)
Peace and good trades
Irasor
Wanna see more? Don`t forget to follow me.
Any questions? PM me. :-)

USDCAD LongThe pullback segment took place and will wait for 4H candle to be bullish and engulf the previous before entering the trade. 1:1 R2R ratio due to the higher resistance level on the daily.

ETHUSD 1D KELTNER CHANNEL PULLBACK TRADING STRATEGYTrading Pullbacks with Keltner Channel
Trading pullbacks successfully can only be done in the presence of a strong trend. Using the Keltner channel indicator we can study how the price behaves around the upper and lower envelopes to gauge the strength of the trend.
As you already learned when the price hugs one of the two bands and crawls along with the band, we have a case for a strong trending market.
There will be highlighted small retracements while the price hugs the upper Keltner band. Notice that the price can retrace to the area around the 20-EMA. It won’t give you an exact price, but a price zone from where the price can potentially bounce and the bullish trend can resume.
This is a good way to measure pullbacks in price. Successful trading doesn’t require catching the exact turning point.
For a better timing of our trades, we can use the Stochastic RSI indicator in combination with the Keltner indicator for more confluence.
The trade trigger is simply to follow with this Keltner Channel pullback strategy. Pull the trigger when the price retraces to the middle band and the stochastic indicator develops a crossover from oversold territory.

Gold Pullback and Bearish Continuation. Next week Gold/Dollar Trade Idea.
Looking at the H4 and H1 time frame, you notice that the price has just broken the up trend line. Forming a Double Top on a 2012 resistance line.
Wait for a retest on the Up trend line, and plan your sell entry.
Good Luck


AUDJPY | WATCH THE HORIZONTAL SUPPORTHelloo everyone, please hit the thumbs button if you find this idea useful.
Price making series of higher lows bouncing off the 20 moving average indicating a strong trend to the upside. after a breakout to the resistance, price pulled back to find support. We wait for a confirmation to go long .
ALWAYS REMEMBER UNCERTAINTY IS THE NAME OF THE GAME.

AUDUSD - Waiting for Pullback - TREND-CONTINUATION TradeHi Traders!
As you can see the market is in an uptrend.
The market started rallying since it was at 0.55000.
After that the market went up.
But, why is it in an uptrend?
Actually, the market was not in an uptrend until it broke the resistance at 0.62000.
Until than, the picture was like that:
- Overall market in a downtrend,
- market now consolidating,
- waiting for trend continuation.
But then the market broke this level, so the picture is now:
- Market in a fresh uptrend,
- just broke the level,
- waiting for a retest,
- making profits in trend continuation.
We recommend to buy the successful retest of the breakout!
Thanks and good luck :)!

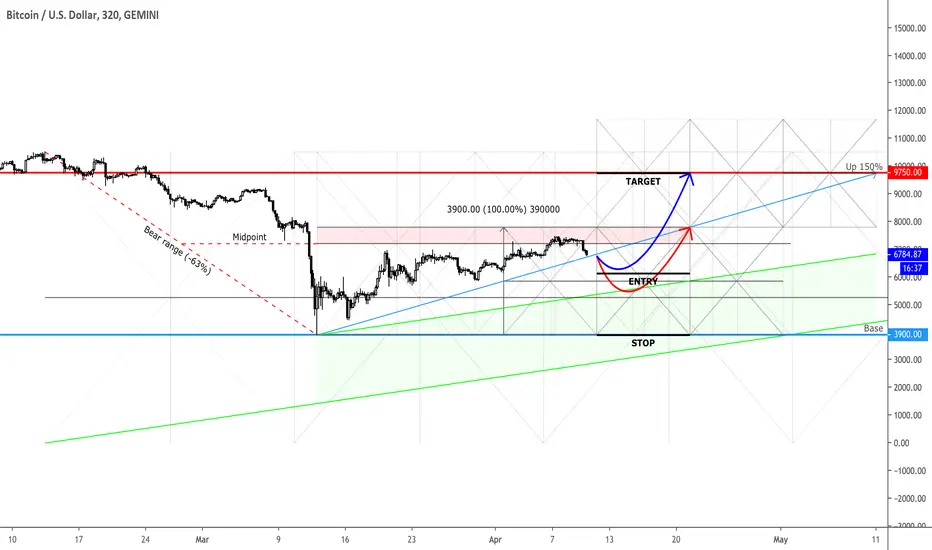
BTCUSD: Limit Buy SetupBTCUSD is seemingly being well-offered around the the 50% reaction point on the earlier 60% bear move, potentially providing a good opportunity to buy the pullback within the bullish leg that almost did a 100% move higher from the $3.9k low. The highlighted areas serve as a visual representation of how supply&demand zones are expected to shift through the passing of time. As long as the lower green shaded areas, remains intact, BTC doom can be avoided. Below that area, BTC is in a bearish territory.


Trendline Broken | Targets | Re-Entry LevelsGoing to keep this one short and simple. We broke our ascending trendline and further downside is expected. Most of the time, with every break comes a pullback. As you can see on the chart, the arrows showing two possible re-entry levels for the short positions:
1) We pullback to the minor resistance area of 6400-6500 before dumping again.
2) We pullback further into the ascending trendline to retest it and bounce off of it (somewhere around 6900).
If we fail to see any pullbacks then you can try enter the next dump during consolidation periods within smaller time frames (15min/5min). Those consolidation periods usually form into wedge patterns before continuing to dump on higher time frames so you can watch out for that as well. I will publish an idea if we manage to see anything like that form up in the future but Im always skeptical about analysing charts on smaller time frames.
Targets for our shorts can be seen on the chart. Long term I still think 3200 is possible but we need to see more volatility within the markets for that to happen. Should we see a break above 6900/7000 then my bias will change completely.
This is NOT a financial advice, trade at your own risk!

EUR/USD SELL SIGNALHey tradomaniacs,
welcome to another free trade-plan.
Sell-Limit: 1,09610
Stop-Loss: 1,10050
Target 1: 1,09450
Target 2: 1,08920
Target 3: 1,08500
Stop-Loss: 44 pips
Risk: 1-2%
Risk-Reward: 2,60
Notice: Countercyclical trades are always risky but can be very yammi.
Keep your risk low and manage this one aggressively!
LEAVE A LIKE AND A COMMENT - I appreciate every support! =)
Peace and good trades
Irasor
Wanna see more? Don`t forget to follow me.
Any questions? PM me. :-)

Bullish on $LYFT - two price targets: 31.67 and 34.91There was a false breakout at a strong resistance point (@28.86). We see the stock get rejected @ 30.92.
I believe it is going thru a small retrace (with the last candle stick having low selling volume) - potentially to 26.41, if not much sooner @ 27.14 - where investors who entered call options ~20 are more than likely cashing out on profits.
I plan to catch LYFT coming out of the pull back
LET SEE WHAT TMW BRINGS!!!!
