Big Gains Ahead As Pump .fun Eyes 0.0041 Breakout MoveHello✌️
Let’s analyze pump .fun’s price action both technically and fundamentally 📈.
🔍Fundamental analysis:
PUMP. FUN is shifting focus to curated CTO tokens with revenue-sharing, but real success depends on turning hype-driven traders into long-term ecosystem users 🔄
📊Technical analysis:
There are strong indications that this may not be the final leg of the move for BYBIT:PUMPUSDT 📈 A further upside of at least 25 percent remains on the table, with 0.0041 as the next key target.
✨We put love into every post!
Your support inspires us 💛 Drop a comment we’d love to hear from you! Thanks, Mad Whale
Pump

PWAS/USDT BIG PUPMPBreak down trend in daily time frame & now probably Big pump for Paws this bad shit coin is coming!

VerasityVra usdt daily analysis
Time frame daily
Target 0.00377 $
Risk rewards ratio >4.4 👈👌
Vrasityis a high Risk asset but I like it for small and fast benefits
Be carefull
For short time trade set LS tighter

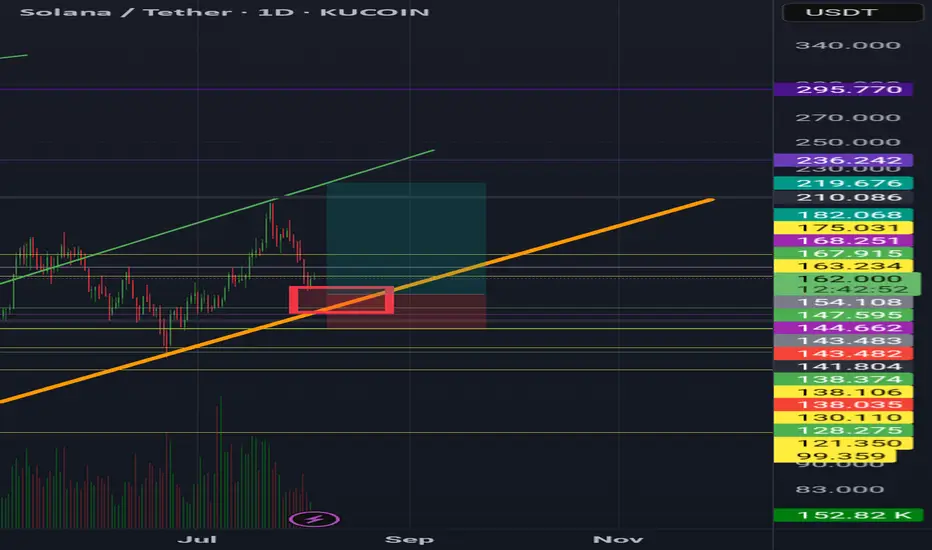
SolanaZol usdt daily analysis
Time frame daily
Position long
Target 219$
Risk rewards ratio >4 👌👈
Red box on the cart is the good erea to entrance long position
Orange uptrend line is a very strong support lines
I guess in this turn of upcoming, solana will reach my target
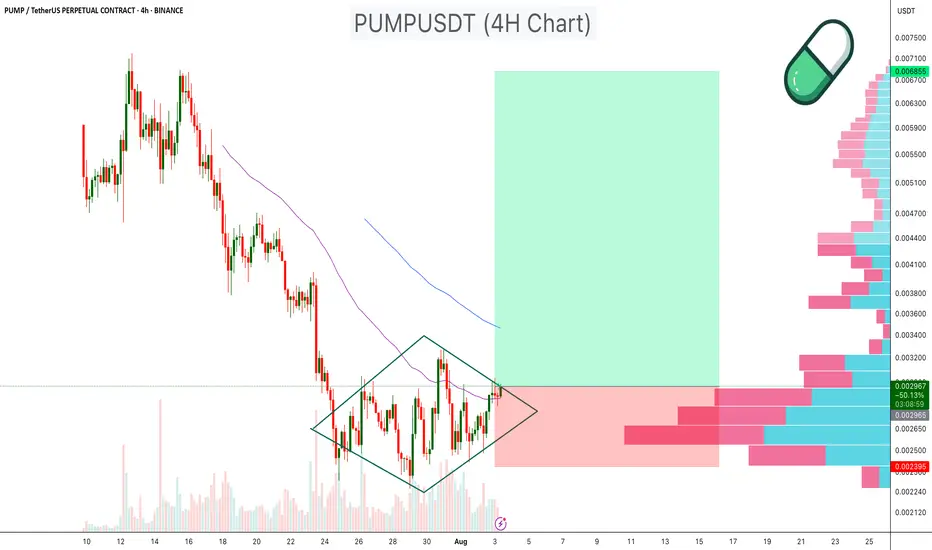
PUMPUSDT Diamond Pattern PUMPUSDT has been consolidating within a diamond chart pattern on the 4 hour timeframe, following a prolonged downtrend. This type of structure signals potential reversal when occurring after a decline.
Diamond Formation: Price is compressing inside converging and diverging trendlines, creating a symmetrical diamond pattern.
Volume Profile Support: Significant volume support is visible in the $0.00240–$0.00250 range, which may act as a strong demand zone.
EMA Resistance: 50 EMA is currently positioned above the price, serving as dynamic resistance.
Breakout Potential: A breakout above the diamond resistance, especially with increased volume, could target the $0.005 –$0.007 zone, representing a major upside move.
Cheers
Hexa
NYSE:PUMP BYBIT:PUMPUSDT
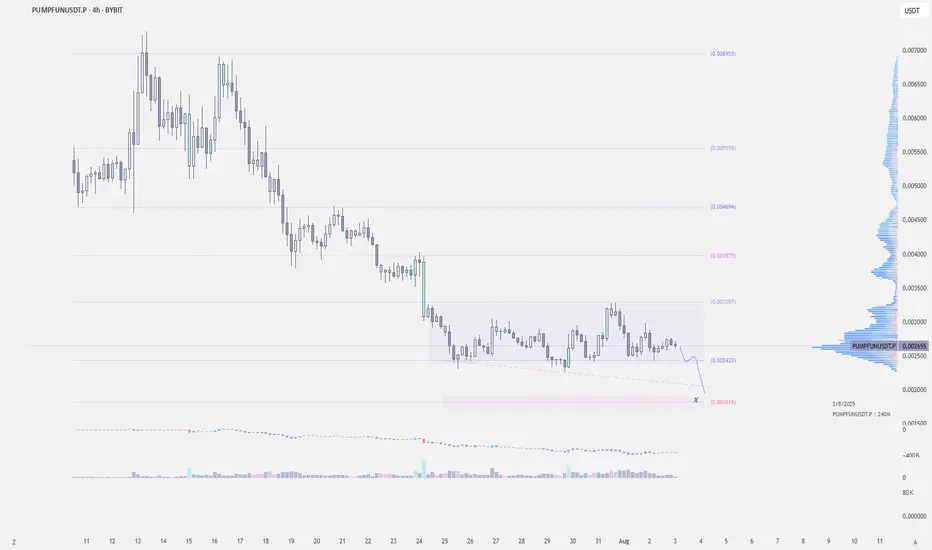
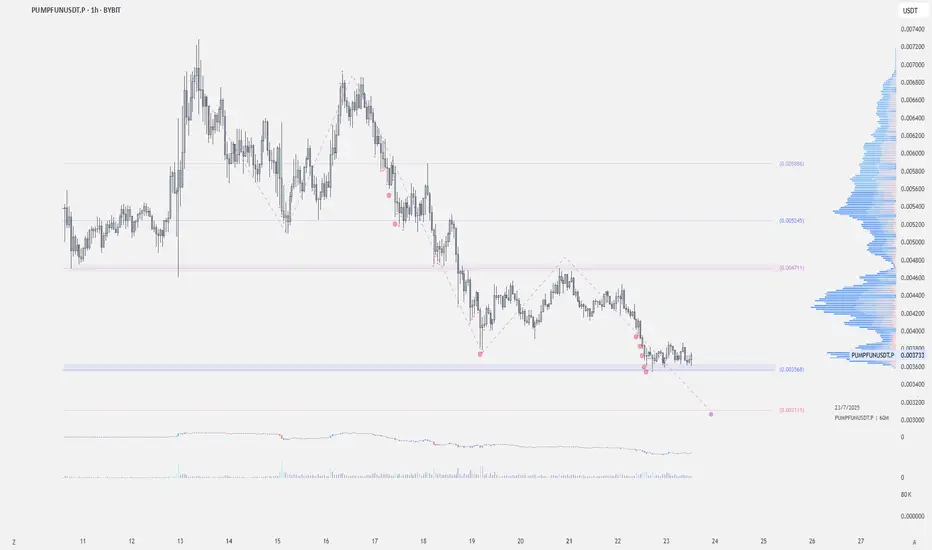
$PUMP May Still Dump to .0020-.0018BYBIT:PUMPUSDT | 4h
PUMPFUN is one of the few coins still holding support during the dump.
It’s looking tempting here, but a drop to the 0.0021–0.0018 zone is still likely.
Planning to long around 0.0021–0.0018
Targets:
.0028-.0032
.0037-.0040
.0045-.0048

ALCH / Usdt BINANCE:ALCHUSDT.P
### ALCH / TetherUS Perpetual Contract (1h) - Binance
- **Price**: 0.16361 (-0.44%, -0.00073)
- **High/Low**: 0.16458 / 0.16310
- **Buy/Sell**: 0.16356 (BUY) / 0.16353 (SELL)
- **Levels**: Support at 0.16029, Resistance at 0.17000
- **CVD (1D)**: Mixed volume (1.17M to 1.53M)
- **OI (Open Interest)**: ~407M (stable)
- **Volume (ALCH)**: 1.2M
- **Sentiment (Trendmaster)**: Neutral (51.79M)
**Summary**: Slight bearish movement, low volatility, neutral sentiment. Watch key levels (0.16029 support, 0.17000 resistance).
Disclaimer : Not Financial Advice

PUMPUSDT: Bullish Breakout and Retest - A Potential 34% Upside?Hello, traders!
Today we're looking at the PUMP/USDT pair on the 4-hour timeframe, and a very clean technical setup is unfolding that points towards potential bullish continuation. Let's break down the key elements of this analysis.
The Analysis
The chart presents a classic breakout and retest scenario, which is often a strong indicator of a trend reversal or continuation.
Descending Trendline Breakout: The most significant feature is the decisive breakout from a major descending trendline that had been capping the price for a considerable period. Breaking this trendline is a primary signal that the previous bearish momentum is weakening and buyers are starting to take control.
Break of Horizontal Resistance (S/R Flip): Following the trendline break, the price also successfully pushed through a key horizontal resistance zone, identified on the chart between approximately $0.002966 and $0.003044. This level has now, as expected, turned into a new support base.
The Retest: We are currently witnessing a pullback to this newly established support zone. This "retest" is a critical phase. A strong bounce from this level would confirm the breakout's validity and suggest that the market has accepted this price floor, paving the way for the next leg up.
Volume Confirmation: Notice the volume bars at the bottom of the chart. There was a visible spike in volume during the initial breakout candles, which adds conviction to the move. It indicates that the breakout was backed by significant buying interest.
The Trade Idea
Based on this structure, a potential long opportunity presents itself.
Entry: A favorable entry point could be found within the current support zone ($0.002966 - $0.003044), especially upon seeing confirmation of a bounce (e.g., a bullish engulfing candle or a hammer on the 4H or 1H chart).
Target: The analysis points to a primary target at the next major resistance level, located around the $0.004000 psychological mark. As measured on the chart, this represents a potential upside of over 34%.
Invalidation: This bullish outlook would be invalidated if the price fails to hold the current support and decisively closes back below the $0.002966 level. Placing a stop-loss below this zone is a prudent risk management strategy.
Conclusion
In summary, PUMPUSDT is displaying a textbook bullish setup. The combination of a trendline breakout, an S/R flip, and a live retest offers a compelling case for potential upside. As always, manage your risk carefully and wait for your preferred confirmation signals before entering a trade.
Disclaimer: This is not financial advice. The analysis provided is for educational and informational purposes only. Trading cryptocurrencies involves a high level of risk. Please conduct your own research and risk assessment before making any investment decisions.

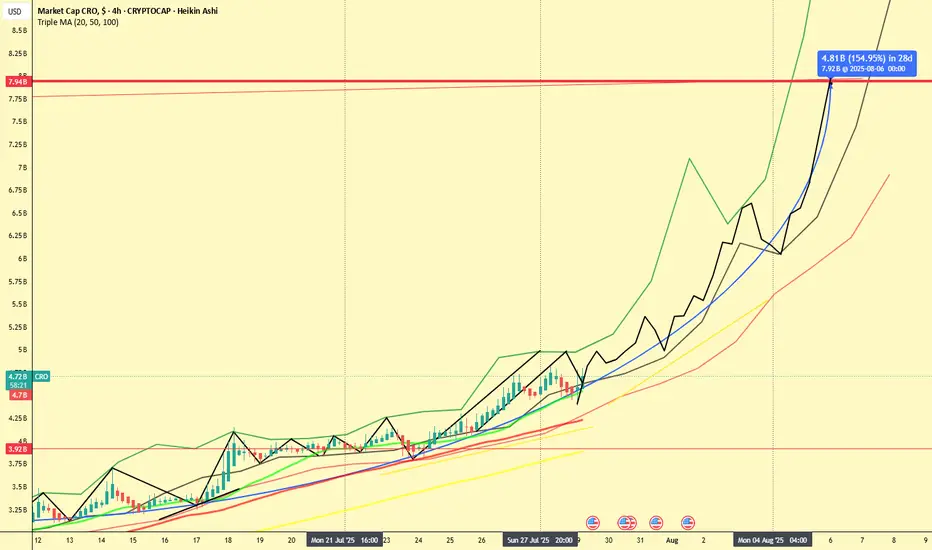
CRO 2x in 7 Days? Chart Hints at Explosive Move!📆 July 29, 2025
📍 CRO Market Cap (4H Heikin Ashi - Historical Projection Analysis)
If this chart doesn’t scream "Breakout Incoming", I don’t know what does.
CRO (Crypto.com) is showing signs of a massive 154% move incoming — and it might all happen within 7 days, according to the current market cap projection.
🔍 Chart Breakdown
The chart combines:
Heikin Ashi candles on 4H timeframe
Six SMAs (21 to 1000) showing steady incline
A historical path projection (green/black lines) based on earlier fractals
A measured move (blue arrow): from ~$3.9B to ~$7.92B by August 6th
This projection implies a 2x from current levels ($4.72B) — within just a week!
⚠️ 2 Healthy Corrections Already In
Let’s not forget: CRO already had two corrections within this structure — visible in the black zig-zag overlay:
End of July: Quick dip into the SMA cluster
Start of August: Second pullback before resuming trend
These retracements build confidence, as they typically reset indicators before major continuation.
📈 Momentum is Building
Price is respecting all major SMAs (21, 50, 100, 200, 300, 1000)
We’ve re-entered the aggressive uptrend channel
No significant resistance seen until the $7.9B area
🧠 Final Thoughts
Could CRO really double in a week?
If it follows the trajectory mapped by the historical fractal pattern, the odds aren’t as crazy as they seem.
Stay sharp. These setups don't come around often.
💬 Agree or disagree? Drop your thoughts and let's chart it together.
📊 #CRO #CryptoCom #Altseason #FractalAnalysis #HeikinAshi #TradingView
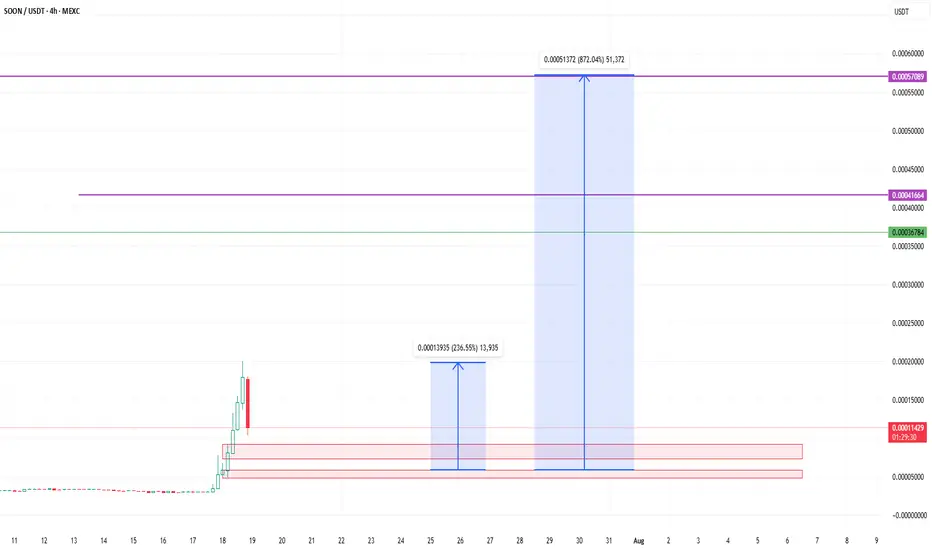
MR SOON GO TO THE MOON with huge commiunity and holder MR soon token is the Best meme for buy noow and a few wait foor a BIG pump so just buy and wait for pump and dont wory be happpy !
MR SOON GO TO THE MOON with huge commiunity and holder
now i am waiting for a very very very BIG PUMP my freind
PUMPUSDT at a Decisive Turning Point – Breakout or Breakdown?
🧠 Technical Overview:
PUMPUSDT has been in a sustained downtrend over the past several days, forming a clearly defined descending trendline that has acted as a dynamic resistance since mid-July. Now, the price is approaching this key level once again—and this time, momentum seems to be shifting.
Interestingly, the current structure is forming what appears to be a potential Inverse Head and Shoulders (IH&S) pattern, a well-known bullish reversal formation. If confirmed with a breakout above the neckline/trendline, this could spark a strong upward reversal.
---
📌 Key Technical Highlights:
Descending Resistance Line: Holding since July 15, acting as the primary ceiling on price action.
Inverse Head and Shoulders Pattern: Potential bullish reversal setup forming on the 2H chart.
Volume: Currently low but showing signs of increase near the potential breakout zone—a bullish early signal.
---
📈 Bullish Scenario (Breakout Confirmation):
If the price successfully breaks and closes above the yellow trendline, especially with a strong candle and volume confirmation, we could see a momentum-driven rally toward the following targets:
1. ✅ $0.003614 – Minor resistance zone
2. ✅ $0.003917 – Retest of previous consolidation structure
3. ✅ $0.004441 – Measured move target from IH&S pattern
4. ✅ $0.005251 – 0.618 Fibonacci retracement area
5. ✅ $0.006795 – Major swing high and liquidity zone
> Potential upside of 100%+ from current levels if momentum continues.
---
📉 Bearish Scenario (Trendline Rejection):
If the price fails to break above the trendline and faces another strong rejection, then sellers could regain control, leading to:
⛔ $0.002500 – Psychological support and consolidation base
⛔ $0.001950 – Local bottom and potential long-term entry zone
> A failed breakout could trigger a quick sell-off or stop-loss cascade below the IH&S setup.
---
🔍 Technical Summary:
Indicator Status
Descending Trendline Actively being tested
Volume Increasing near breakout zone
RSI Rising from oversold territory
Price Pattern Inverse Head & Shoulders (Potential Reversal)
Risk/Reward High, favoring breakout strategy
---
🧭 Strategy Suggestions:
Aggressive Entry: Enter on breakout candle close above trendline with volume confirmation.
Conservative Entry: Wait for breakout + successful retest of the trendline before entering.
Stop Loss: Below neckline or recent swing low (~$0.0025).
Take-Profit Zones: $0.0039, $0.0044, $0.0052 and beyond.
---
🧠 Final Thoughts:
> “Charts never lie—PUMPUSDT is building pressure beneath a key resistance. If it breaks, the move could be explosive. Are you ready to ride the wave?”
Microcap altcoins often fly under the radar—until they don’t. This setup is showing the classic signs of a potential breakout. Use sound risk management and watch the next candle closely.
#PUMPUSDT #CryptoBreakout #InverseHeadAndShoulders #TechnicalAnalysis #AltcoinSetup #PumpFun #BreakoutAlert #MicrocapGems #CryptoReversal #ChartPatterns #CryptoSignal #CryptoStrategy

CardanoAda usdt Daily analysis
Time frame daily
Risk rewards ratio >3 👈👌
Double bottom pattern has been created

Blokblok usdt daily analyses
time frame daily
long position risk of ratio >9
target 0.00075$
if price breaks the upper line my long position will start. duration of this forecast is long
if it cannot break and move between orange lines my short position will be active. this duration is short
short position risk of ratio >2
target 0.00027$

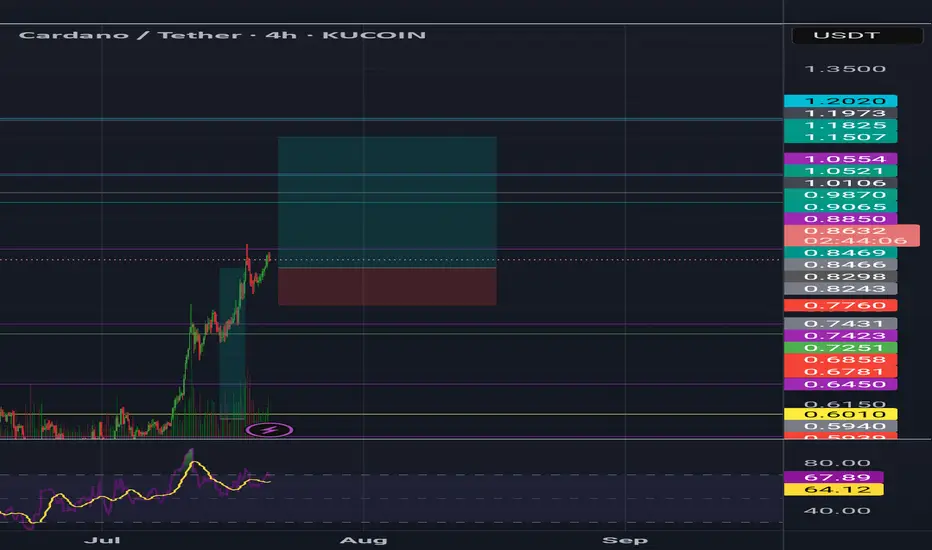
CardanoAda usdt Daily analysis
Time frame 4hours
Risk rewards ratio >4.3
Target =1.15$
Cardano is the Valuable asset in crypto market
Pump.fun (PUMP) Price Crashes 20% After First Bearish CrossoverMEXC:PUMPUSDT price is currently at $0.003055, down by nearly 20% in the last 24 hours . The MACD (Moving Average Convergence Divergence) indicator, a key tool used to track price momentum, has signaled the first bearish crossover for PUMP token since its launch.
The bearish crossover occurred after a period of rising bullish momentum, signaling that the altcoin may now be facing a downturn.
The token is holding above a key support level of $0.002921 , but this support is fragile. If MEXC:PUMPUSDT fails to maintain this level, it could continue to decline, potentially dropping to $0.002499 . This would confirm the continuation of the downtrend, and the price could fall further.
On the other hand, if MEXC:PUMPUSDT manages to hold its ground at $0.002921, it could experience a bounce back. This would allow the altcoin to rise towards $0.003803, potentially invalidating the current bearish thesis and pushing the price past the resistance of $0.004124 . The next few days will be critical in determining if PUMP can recover from its recent losses.

Link / UsdtBINANCE:LINKUSDT
### 📊 **Chart Overview – LINKUSDT (4H):**
* **Current Price:** \$17.65
* **Recent Trend:** Pullback from the \$20.00 resistance zone.
* **Key Support Zones:**
* Immediate: **\$17.00 – \$17.20** (gray demand zone).
* Stronger: **\$14.00 – \$14.20**.
* **Resistance:** \$20.00 psychological level.
---
### 🔍 **Technical Breakdown:**
1. **Trendline Interaction:**
* Price is testing the **ascending red trendline**, which could act as dynamic support.
* A break below could push LINK toward **\$17.18 or even \$14.16** for a deeper correction.
2. **Bullish Scenario:**
* If the \$17.00 zone holds, LINK could bounce and aim for **\$18.50 – \$19.80** in the short term.
3. **Bearish Scenario:**
* A decisive break below \$17.00 may trigger a larger move down to the **\$14.00 support zone**, offering better accumulation levels.
---
### 📌 **Summary:**
LINK is at a **critical decision point** — watch the \$17.00 support zone and the trendline closely for direction confirmation.
---
⚠️ **Disclaimer:**
*This analysis is for informational and educational purposes only. It is not financial advice. Always DYOR and manage your risk before trading.*

ARTY - The Undervalued Gaming Rocket?While most eyes are on memecoins and major Layer-1s, a sleeping giant may be gearing up in the GameFi sector — and this time, it’s powered by real innovation and user growth.
🎮 Fundamental Boost
Artyfact has just launched its long-awaited Play-and-Earn mode — the first of its kind. This new feature is expected to onboard hundreds of thousands of gamers into the ecosystem. And here’s the catch: players can only purchase gaming NFTs using KUCOIN:ARTYUSDT . This shift not only introduces a fresh wave of demand but also builds real token utility — the kind most GameFi tokens lack.
💼Additionally, recent sell pressure from early investors has now faded. Those who had been staking ARTY for three years have finally taken their profits. With that wave of selling behind us, the token now has room to breathe — and potentially fly.
And yes, I bought ARTY myself — not financial advice, but I’m personally betting on its next big move.
📊 Technical Analysis
AMEX:ARTY has been trading within a bullish ascending triangle, forming higher lows and maintaining strong support around the $0.13 level. Each time it tapped this zone, it triggered strong impulse moves — one up 88%, another over 100%.
Right now, ARTY is back at that exact support level, with a third impulse wave potentially brewing. A bounce from here could send it back toward the upper trendline near $0.30 — our first target.
If that breaks, the next resistance sits around the $0.70 zone, a previous structural high and psychological round number. And if the gaming adoption kicks in as expected, we could be heading toward a macro bull market target of $1+, which would represent a multi-X move from here.
📈 3 Bullish Targets for AMEX:ARTY
$0.30 — top of ascending triangle
$0.70 — structural resistance from prior impulse
$1.00+ — psychological milestone backed by new NFT demand and adoption
📍 Why ARTY?
Artyfact is not just another GameFi project — it’s building a functional gaming economy where NFTs have real use, and where the token is required for participation. In a sea of hype-driven tokens, ARTY stands out by actually shipping product and onboarding users.
With the new Play-and-Earn mode gaining traction, a solid technical base forming, and sell pressure behind us, ARTY could be setting up for its biggest run yet.
➡️ As always, make sure to do your own research and only invest in what you truly believe in.
🎯 Stick to your trading plan — entry, risk, and execution.
Good luck!
All strategies are good, if managed properly.
~ Richard Nasr

$PUMP - Jew ModeBYBIT:PUMPUSDT | 1h
It has dropped below its ICO price level $0.004, currently trading around $0.00373. The drop seems driven by airdrop anticipation and broader market cooldown.
If they stagger the airdrop, it could be a bullish move—reducing supply shock and pushing platform engagement.
Price looks to have bottomed, but still feels uncooked — we’d prefer to see a shakeout to flush early longs
Watching for a potential long around $0.0030
Total to 5T & BTC to...?Morning fellas,
No way BTC is stopping here. People are gonna get reckt shorting, and are not gonna believe where this price action is gonna stop.
TOTAL must reach anywhere between 4.5T & 5T, this spread across all Alts.
It has been a long time coming, and the party hasnt even started yet.
Hold your horses and trade thirsty, my friends!

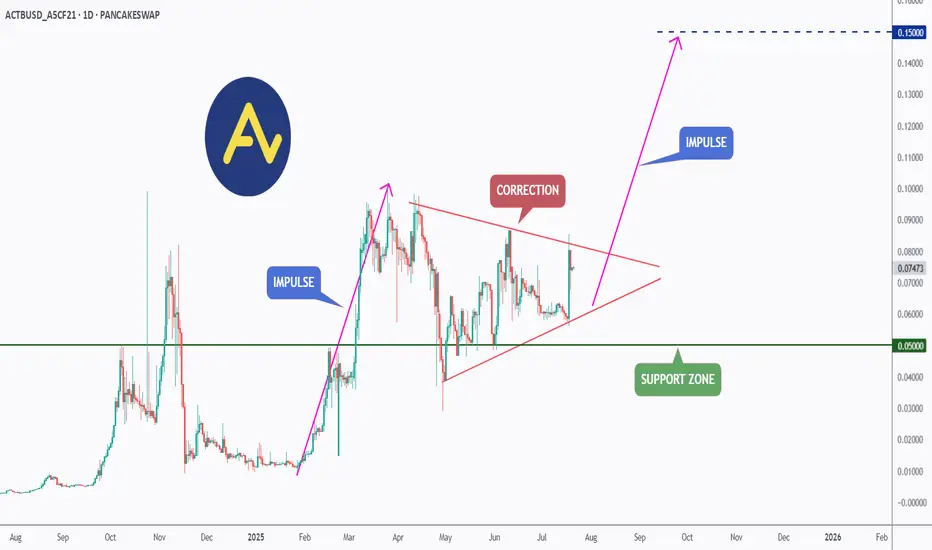
ACT (Acet) - Eyeing the Next Impulse Move?ACT has been forming a textbook bullish continuation pattern.↗️
After a strong impulse leg earlier this year, price has been consolidating within a symmetrical triangle, signaling a healthy correction phase.
🏹Today, ACT broke out of the triangle to the upside , indicating that bulls may be taking control once again.
📍If momentum continues, the next impulse move could push price toward the $0.15 resistance as a first target — a major psychological and technical level.
As long as the $0.050 support holds, ACT remains in bullish territory with upside potential in sight.
📚 Always follow your trading plan regarding entry, risk management, and trade management.
Good luck!
All Strategies Are Good; If Managed Properly!
~Richard Nasr
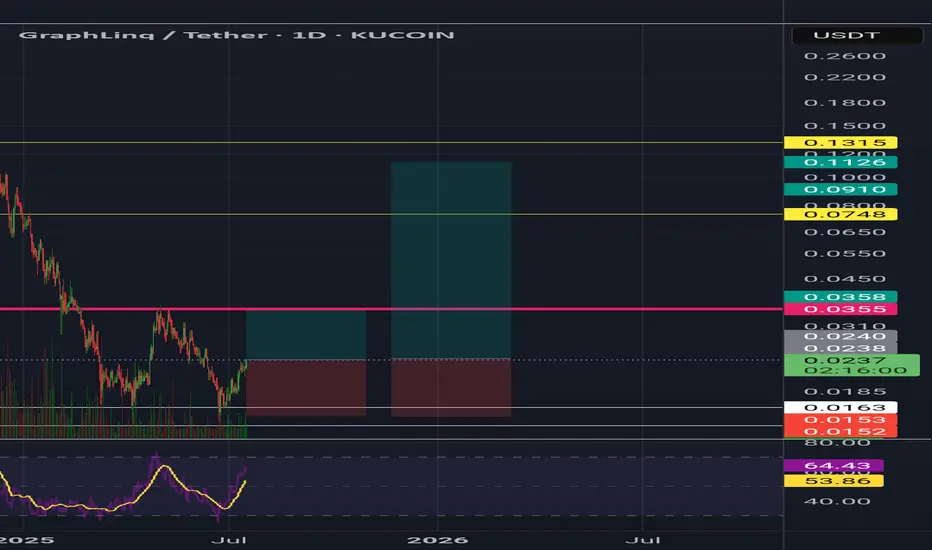
Graph link GLQ usdt Daily analysis
Time frame daily
first target =0.0355$
Risk rewards ratio >1.3 👈
Second target = 0.112$
Risk rewards ratio =10 👈👌👈👈👈👈
Don't forget this asset
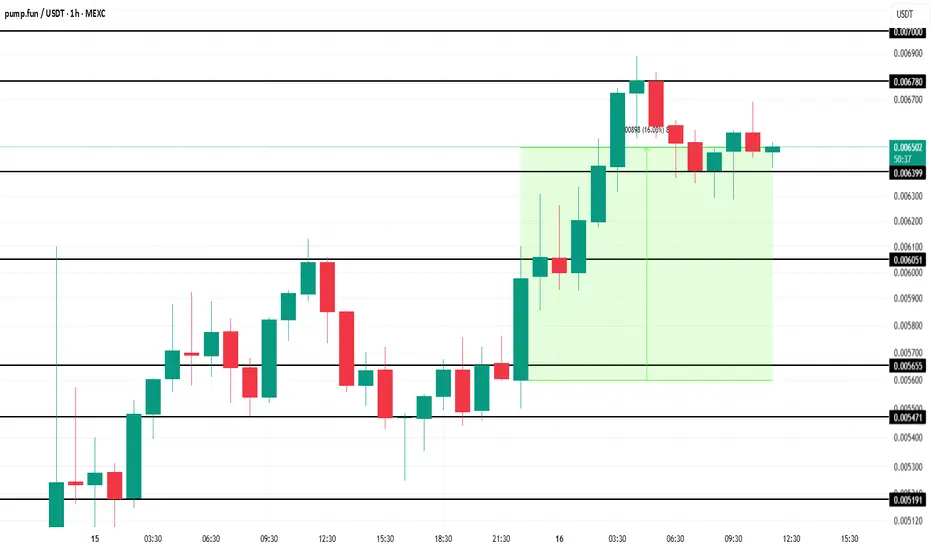
Pump.Fun (PUMP) Token Nears Milestone $1 Billion OI In 3 DaysMEXC:PUMPUSDT price stands at $0.0065 after bouncing off the $0.0063 support level. The token has gained 16% in the last 12 hours , showing that the demand for PUMP is strong.
The valuation of Pump.Fun has skyrocketed in just two days, reflecting a surge in demand. In only 48 hours since its launch, the altcoin has amassed 45,500 holders .
The macro momentum behind Pump.Fun is undeniable, with open interest in MEXC:PUMPUSDT nearing $913 million. It is on track to hit the $1 billion mark by day three of its launch.
Given the ongoing momentum and investor confidence, the token is likely to continue pushing upwards in the near future.
With the current market conditions and growing support, MEXC:PUMPUSDT could breach the $0.0067 resistance and reach as high as $0.0070 in the coming days. This would mark a significant achievement for the altcoin, continuing its impressive upward trajectory.
However, if MEXC:PUMPUSDT faces a sudden wave of selling or broader market bearishness, the token could lose the $0.0063 support level. A decline below this point would likely see PUMP slipping to $0.0060, invalidating the bullish outlook and signaling a potential market correction.