OBOL $0.15 as soon as possibleHello,
I think Obol pump as soon as possible and very fast price go to the $0.15 and more.
The total tokens in circulation are less than 100 million, but volumes above 200 million on a particular exchange are unusual and indicate a price manipulation that is caused by lowering the price and collecting tokens on other exchanges.
You can buy on other exchanges and transfer to your wallet and expect a pump and profit of over 300%.
What do you think?
Thank you
Pump

SEI - One More Bullish Impulse Soon!Hello TradingView Family / Fellow Traders. This is Richard, also known as theSignalyst.
📈After surging by over 75% last week , SEI is currently in a correction phase.
However, it is approaching the intersection of the previous high marked in orange and blue trendline acting as a non-horizontal support.
📚 As per my trading style:
As #SEI approaches the blue circle zone, I will be looking for bullish reversal setups (like a double bottom pattern, trendline break , and so on...)
📚 Always follow your trading plan regarding entry, risk management, and trade management.
Good luck!
All Strategies Are Good; If Managed Properly!
~Rich

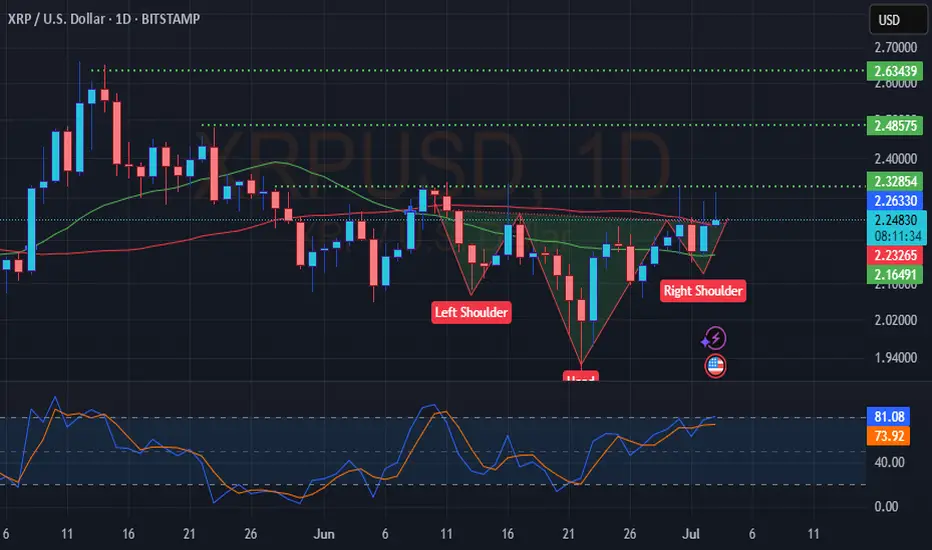
XRP IH&SGood day all. XRP looking great for a breakout. All targets marked in the chart. please leave a like for future updates. and post your charts if you disagree. Not financial advice. just my crucial thinking.
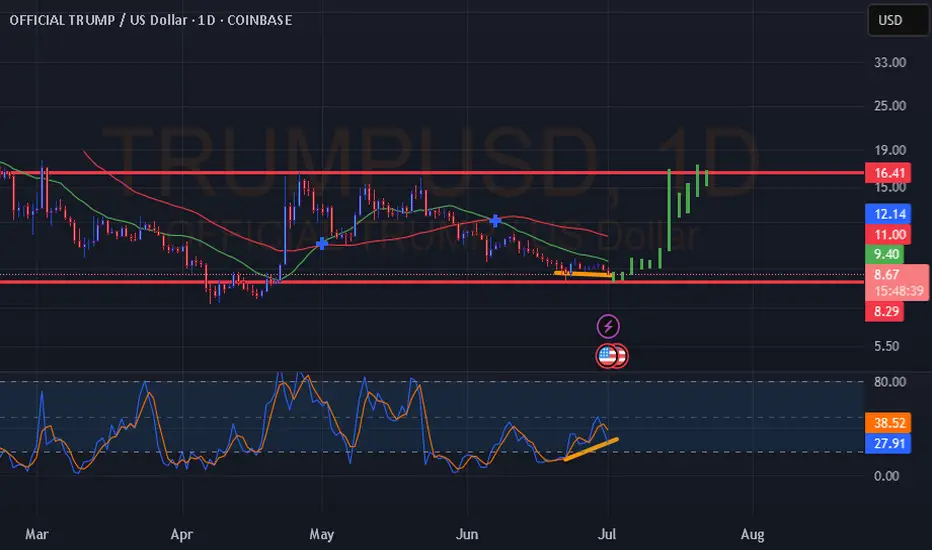
TRUMP USD Bullish DivergenceHi Everyone. TRUMP showing some strength here. Could be an overall price reversal starting off as indicated. Not financial advice. Good luck.
USDT - Hope AheadMorning my friends,
Figured I'd share a little bit of this USDT chart.
Deff showing a downtrend, even though our beloved coins are still suffering. Thats mainly because of BTC.D.
Once USDT moves lower, signaling a breakdown we should get a big relief, that if maybe paired with BTC.D moving lower as it is also near very strong resistance a bull market for alts will begin.
Keep an eye on this descending triangle breakdown.
Trade thirsty, my friends!

BTC / USDT - Look Closely!!!Good evening fellas,
Take a very close look and buy bitcoin.
Trade thirsty, my friends.

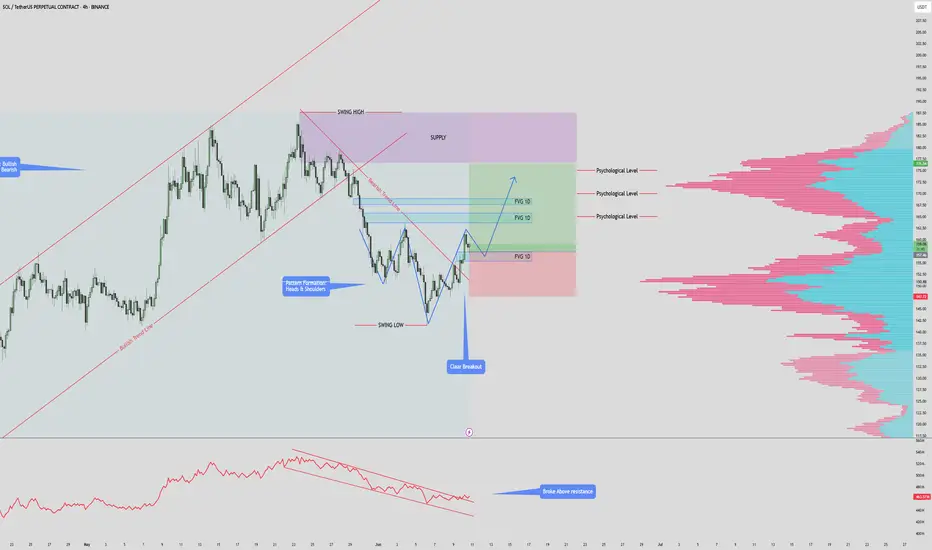
$SOLANA $180 PUMP INCOMINSOL/USDT – 4H Chart Summary
Market Structure:
HTF: Bullish trend remains intact.
LTF: Previously bearish, now showing early signs of a bullish reversal.
Pattern Formation:
Potential Inverse Head & Shoulders forming.
Neckline at $157 — must hold for pattern to complete.
Break above previous high will invalidate Inverse Head & Shoulders.
Trendline & Breakout:
Price has broken above the descending bearish trendline.
Indicates a momentum shift from bearish to bullish.
Fair Value Gaps (FVG):
1D FVG below current price – potential retest & long entry zone.
2x 1D FVG above price – act as targets or supply areas.
Psychological Levels & Volume:
Key levels at $165, $170, $175.
Volume profile shows high liquidity at each of these levels – strong TP zones.
OBV Indicator:
OBV has broken above resistance – supports bullish continuation.
Trade Scenarios:
Bullish Setup:
Long on retest of lower FVG zone ($142–$145).
Target TPs: $165 → $170 → $175 (align with psychological & high-volume areas).
Invalidation:
Break below FVG support or failure to hold above $142.
$ETH / USDT – 4H Time Frame Analysis 3,000 INCOMING?? CRYPTOCAP:ETH / USDT – 4H Time Frame Analysis
Structure: Bullish Flag | Outlook: Neutral-Bullish | Target: $3000?
🔹 Chart Overview
-Pattern: Bullish Flag (continuation structure)
Current Range:
- Supply Zone: $2,680.00 – $2,786.21
- Demand Zone: $2,319.79 – $2,417.61
Price Action:
- Tight consolidation between higher lows and lower highs, forming a symmetrical triangle within a flag structure.
Trend:
- Consolidation, but within a macro uptrend (prior strong rally).
Volume Profile:
- Anchored Volume shows high participation around $2,540–$2,600.
OBV:
- Flattening, signaling indecision and potential energy buildup.
Key Psychological Levels:
$2,860: Minor resistance from past S/R flips.
$3,000: Major round-number psychological resistance.
📐 Technical Confluences
Fibonacci Retracement:
- The 0.618 golden pocket aligns with the support trendline, reinforcing this as a critical zone.
Fair Value Gaps (FVG):
- Above Price: Acts as a magnet in bullish continuation.
- Below Price: Risk zone if price drops; aligns with liquidity and trendline support.
- Liquidity Zone: Aligned with 0.5–0.618 retracement; strong reaction expected.
📈 Bullish Scenari o
Breakout of Pennant Resistance:
- A clean break above $2,786 (supply zone & swing high) with volume.
Close above Upper FVG and Liquidity Zone:
- Confirms bullish intent. Targets psychological level at $2,860, then $3,000.
Volume Confirmation:
- OBV uptick and high breakout volume would validate the move.
Bullish Target Zones:
TP1: $2,860 (psych level + previous resistance)
TP2: $3,000 (major psychological level)
TP3: $3,120–$3,180 (1.618 Fib extension)
📉 Bearish Scenario
Rejection from Current Supply or Liquidity Zone:
- Fails to break above supply; rolls over from the upper pennant line.
Break Below Support Trendline:
- Break below golden pocket and $2,417.61 demand zone.
Invalidation of Bullish Flag:
- A breakdown below $2,319.79 (swing low) invalidates the bullish flag and may signal a trend reversal.
Bearish Target Zones:
TP1: $2,200 (local volume gap + structure support)
TP2: $2,060–$2,120 (previous accumulation zone)
TP3: $1,950 (macro support & last strong demand)
✅ Summary
Structure:
- Price is compressing within a bullish continuation pattern, awaiting breakout confirmation.
Bias: Slightly bullish unless the swing low at $2,319 is broken.
Confirmation Needed:
- Break above or below pennant boundaries with volume.

OP / USDT 4hr PUMP INCOMING? OP/USDT – 4H Chart Summary
Market Structure:
4H Timeframe:
- Price consolidating within a descending triangle/wedge pattern, indicating potential buildup before a breakout.
- Lower Timeframes (1H and below): Bearish trend structure with lower highs and lows.
- OBV (On-Balance Volume): Forming a wedge—suggesting accumulation or distribution phase nearing a breakout.
Key Zones:
Demand Zone (Support):
- 0.5483 – 0.6351
This area has provided strong support historically. A clean break below could signal continuation of the larger downtrend.
Supply Zone (Resistance):
- 0.9068 – 1.0414
-Historically rejected price; high probability of reversal or consolidation if revisited.
Fair Value Gaps (FVG):
- FVG 1: 0.6659 – 0.6838
- FVG 2: 0.7024 – 0.7308
These inefficiency zones are likely to attract price if bullish momentum builds. Watch for potential short-term rejection or continuation setups here.
Volume Profile:
Strongest volume node (high liquidity zone) sits between 0.7470 – 0.8000
Suggests this area has been heavily traded and may act as magnet/resistance if approached again.
Fibonacci Confluence:
Previous swing high at 0.8232 aligns with the 0.618–0.65 golden pocket
A critical zone for potential take-profit or trend reversal on a breakout.
Scenarios:
Bullish Case:
If price holds above 0.6351 and bounces, look for:
- Retest of FVG 1, followed by FVG 2.
- Breakthrough of 0.7308 could target the golden pocket and swing high at 0.8232.
- Sustained bullish move may reach the supply zone above 0.9068.
Bearish Case:
- Breakdown below 0.6351 and especially below 0.5483 would:
- Invalidate the wedge support.
- Confirm continuation of the macro downtrend.
-Open room for new lows and bearish expansion.
Conclusion:
Price is at a key decision point inside a wedge.
Reaction at 0.6351 is critical—support bounce targets higher inefficiencies; breakdown signals deeper bearish continuation.
OBV and volume structure suggest an imminent volatility spike—prepare for a breakout.

HYPE/USDT – 4H Chart Analysis PUMP TO $50??HYPE/USDT – 4H Chart Analysis
Volume (OBV Indicator):
The On-Balance Volume (OBV) has broken above its local resistance level, indicating a notable increase in bullish volume inflow. This supports the current upward momentum.
Market Structure:
High Time Frame (HTF): Still bullish.
Lower Time Frame (LTF): Currently consolidating within a bullish pennant pattern.
Price has recently closed just above the pennant’s resistance line, suggesting a potential breakout and continuation of the bullish trend.
Key Zones & Levels:
Supply Zone: Price is currently testing this zone. A successful hold and breakout above the previous swing high would confirm bullish continuation.
Fair Value Gaps (FVGs):
A small FVG exists just beneath current price between key support/resistance levels. This may act as a short-term magnet for price (potential retracement).
Two larger FVGs on the 1D time frame lie below the current support and prior swing low. If price moves into these levels, it would likely be a liquidity sweep, trap, or fakeout scenario.
Psychological Levels: $40.00 and $45.00 are the next logical upside targets if bullish momentum continues beyond the swing high.
Trade Setup:
Entry: At the 0.28 Fibonacci retracement level.
Stop Loss: Just below the 0.5 Fibonacci level.
Take Profit (Partial): At the 0.618 Fibonacci extension, aligning with a psychological resistance zone.
Summary:
The breakout from the bullish pennant, combined with increasing volume (OBV breakout), suggests strong bullish momentum. As long as price holds above the pennant and key support, continuation toward $40–$45 remains the probable scenario. Any dip into the lower FVGs would likely be a liquidity event rather than a trend reversal.
(NOTE: This is not financial advice, it is recommended to always (DYOR) (Do Your Own Research)

$BTC/USDT MAJOR PUMP? or MAJOR DUMP?BTC, the worlds biggest and fastest growing coin. With a market cap in the Trillions, we are facing a major moment.
Will price dump? or will it pump and go above and beyond.
Lets find out in this analysis!
1. Trend Overview
HTF Bullish:
Price remains above the long-term bullish trendline, showing strong macro support.
Recent price action is consolidating within a major supply zone and liquidity cluster — signaling indecision before a breakout or breakdown.
📈 2. OBV (On-Balance Volume) Analysis
OBV is coiling in a symmetrical triangle, indicating a volume squeeze.
This tightening range typically precedes a major breakout or breakdown, matching the price consolidation near resistance.
🔄 Market Structure
Price has formed a potential top just under the supply/liquidity zone (~$110,000–$112,000).
Swing High is defined just below $112K.
Key structure zones are:
Resistance zone at current levels.
Support zones:
1D FVG ($97K) and Weekly FVG ($87K–$93K)
🟪 Supply & Demand Zones
Supply Zone: $100k - $112k — multiple rejections here indicate this is a key short-term ceiling.
Demand Zone: Deep support between $50-$57K, aligns with trendline and historical value area.
🔵 Fair Value Gaps (FVGs)
1D FVG: $97K area — may act as magnet if price breaks below resistance.
1W FVG: $87K–$93K — stronger structural level to watch.
If both are filled, price may meet the bullish trendline around $90K.
🧠 Liquidity Zones
Above current price: ~$112K is marked as a liquidity grab area — stop hunts may occur before major reversal.
Below: FVG zones could trigger a liquidity sweep downwards before reversal.
🔴 Volume Profile
Strong high-volume node (HVN) around $80K–$97K: acceptance zone, likely to act as magnetic support.
Above $110K is a low-volume node (LVN): if broken cleanly, price may accelerate quickly toward $120K+.
✅ Bullish Scenario
Break above $112K → sweep liquidity → continuation toward $120K–$125K. (Price Discovery)
OBV breakout upwards would confirm.
Hold above FVG 1D if retested = healthy bullish continuation structure.
❌ Bearish Scenario
Rejection at supply → drop to FVG 1D ($97K), then potentially Weekly FVG (~$93K).
If OBV breaks downward, it confirms bearish volume divergence.
Breakdown below trendline could target deeper into demand zone (~$70K+).
📌 Summary
Bias: Neutral-bullish short term, bullish macro (above trendline).
Key Breakout Level: $112K.
Critical Support: $91K–$97K (FVG cluster).
Confirmation: OBV breakout + clean structure break.
Invalidation: Weekly close below long-term trendline and FVG zones.

Maker (MKR)MKR usdt Daily analysis
Time frame 4hours
Risk rewards ratio =2 👈👌
Target 2400$
Now is a good opportunity to break the 1930$ resistance and reach to the next resistance area in 2400$
But if mkr can't break this resistance, will fall down to 1600$

BTC / USD 1hr 110K INC!BTC/USD – 1H Chart Analysis
📝 Trend Overview:
BTC is showing signs of a bullish reversal, forming higher highs and higher lows, supported by the broadening bottom pattern. This formation often signals accumulation and precedes breakout moves. The market has now bounced three times from the demand zone, reinforcing its validity as a strong support.
📍 Key Technical Zones:
Demand Zone:
103,201.46 – 104,197.07
Price has tested this zone multiple times and bounced, indicating strong buying interest.
☑️ Supply Zone:
110,098.80 – 111,330.54
Significant historical resistance. If BTC reaches this zone, expect strong selling pressure.
📥 Fair Value Gaps (FVGs):
1H FVG: 105,746.93 – 106,157.49
Aligned with the Fibonacci Golden Pocket (0.618–0.786) retracement, increasing confluence.
4H FVG: 107,337.85 – 107,738.15
Key level for potential breakout or rejection.
✅ Targets:
TP1: 1H FVG zone (~106k)
TP2: 4H FVG zone (~107.5k)
TP3: Supply zone (~110k–111k)
❌ Invalidation:
Break and close below the demand zone would invalidate the bullish bias short term.
📊 Volume Profile & OBV:
Volume Profile (Right Side):
High activity zones between 105k–107k show areas of interest for both bulls and bears.
📊 OBV (On-Balance Volume):
Currently consolidating, which suggests accumulation and potential for a breakout once volume picks up.
🧠 Summary:
BTC has regained bullish momentum following multiple rejections from the demand zone and the formation of a broadening bottom. If the price confirms a higher low at or above 104,925, expect a move towards the 106k and possibly the 110k region. Monitor price action at the FVGs for reactions and profit-taking opportunities.
(NOTE: This is a spot trade - Leverage at your own risk and research)

$FET Ascending Triangle Incoming PUMP? 1 Hour Time FraNYSE:FET 1Hr Time Frame
📝 Technical Analysis:
FET is currently forming an ascending triangle pattern, a typically bullish continuation structure. This pattern is developing after a clear retest of the demand zone between $0.7038 and $0.7390, which previously acted as a strong support area.
✅ Key confirmations:
- Two clear rejections from the lower boundary of the ascending triangle, suggesting strong buying interest.
-A break of the previous bearish trendline, shifting market sentiment from bearish to neutral/bullish.
-Volume consolidation seen in the lower portion of the chart aligns with the tightening price action – often a precursor to breakout.
📊 Price Action Insights:
- The next potential retracement is expected around the Golden Pocket (0.618–0.65 Fib zone), which aligns with both the ascending triangle support line and demand zone – this confluence adds strength to the level.
- A breakout above the triangle's resistance, with confirmation, would present a long opportunity.
- Fair Value Gaps (FVGs) on the 4H timeframe are visible overhead at:
$0.7873 – $0.8061
$0.8401 – $0.8470
These serve as profit-taking targets for any bullish breakout trades.
📊 Volume Profile:
Using the anchored Volume Profile:
- High volume node is seen around $0.9141–$0.9889 – indicating historical resistance where price may slow down.
- Low volume node (volume gap) exists in the mid-region, implying a potential fast move through this zone if the triangle breaks upward.
❌ Invalidation Criteria:
This bullish setup is invalidated if:
- Price breaks below the ascending triangle support, followed by a loss of the swing low and demand zone below $0.7038.
This would likely lead to a continuation of the prior downtrend.
🧠 Conclusion:
The setup currently favors bulls, provided the ascending triangle holds. A confirmed breakout above resistance opens the path toward the identified FVG zones. However, risk management is crucial around the support area as a breakdown would negate the bullish structure.

Aptus Apt usdt Daily analysis
Time frame daily
Risk rewards ratio >2 👈👌
Target 7.4$
Pattern = two bottom

Pump and Dump🚨 Market Update – AGT Traders Beware 🚨
On May 21, Binance saw $141.14K in short liquidations vs. $90.47K in longs.
Today, just on Gate.io, there were a whopping $609.92K in long liquidations.
Overall volume remains low compared to previous days - signaling weak momentum and increased risk.
📅 On June 1, 82.35M AGT tokens (~$2.57M) will be unlocked.
⚠️ Expect high volatility - potential pump and dump scenarios.
Stay cautious out there.

TronTrx usdt Daily analysis
Time frame hourly
Short time Target 0.278 $
Risk rewards ratio >3.5 👈👌
This short time analysis is in the big Daily analysis that you can see in my forecasts before

BTCBtc usdt Daily analysis
Time frame hourly
Risk rewards ratio =2
Target 107.000$
LS is very tightly so I have no problem with stop hunters
Btc is charging its energy to pump and reach the new high

BTC: Next Big Move is Brewing – $116K Target Locked!🚀 Hey Traders! 👋
If you’re finding value in this analysis, smash that 👍 and hit Follow for high-accuracy trade setups that actually deliver! 💹🔥
Bitcoin has been following a highly consistent rally-consolidation-breakout pattern over the last few weeks — each time breaking out with nearly +10% upside moves after forming solid accumulation zones. 📈
📊 Observational Pattern:
Let’s break it down:
Phase 1 (April 19–21)
Accumulation range: GETTEX:82K –$84K
Breakout: ~11% gain to ~$93K
Phase 2 (April 25–May 7)
Range: ~$91K–$94K
Breakout: ~10% rally to ~$103.5K
Phase 3 (Current Zone: May 9–Now)
Range: ~$101K–$104K
Price is consolidating, showing signs of continuation.
🧠 What the Chart is Telling Us:
Bitcoin is forming a bullish continuation structure (like a stepping staircase) — a pattern often seen in strong trending markets.
Each green box (marked in chart) represents a clear demand zone followed by a breakout.
If this pattern repeats, we can expect a move towards $114K–$116K.
Invalidation Level: A daily close below $101K would break the rising support and flip sentiment short-term bearish.
✅ Summary:
Target: $114K–$116K
Invalidation: Daily close < $101K
⚠️ Trade with discipline. Let the chart confirm before aping in.
We’ll keep updating as the setup evolves — pin this for reference. 🧠

Wyckoff Cycle - Practical Example (SUI)Dear TradingView community and fellow traders,
I am Richard, also known as theSignalyst.
I find the SUI daily chart to be intriguing as it appears to be following the famous Wyckoff Cycle.
I would like to apply Richard Wyckoff's four market stages/phases to this chart for analysis as a practical example.
1️⃣ Accumulation
SUI rejected the $0.50 round number and entered an accumulation phase, consolidating for several months.
2️⃣ MarkUp
After breaking above the accumulation range at $1, SUI kicked off the markup phase.
3️⃣ Distribution
SUI found resistance at the $5.50 round number, with the lower bound of its range near $4—forming a wide distribution phase.
4️⃣ MarkDown
Once SUI broke below the $4 major low and exited the distribution zone, it transitioned into the markdown phase.
🔄🔄🔄🔄🔄⬇️
1️⃣ Accumulation
After finding support around the $2 round number, SUI hovered within a range, forming another accumulation phase.
2️⃣ MarkUp
We're here 🙂 This week, SUI broke above the $2.80 major high and the accumulation range—signaling the beginning of a new markup phase.
❓ What's next?
Will SUI continue to trade higher from here, or will this cycle play out differently?
I hope you find this post useful, and I would appreciate your likes and support.
Which scenario do you think is more likely to happen first? and why?
📚 Always follow your trading plan regarding entry, risk management, and trade management.
Good luck!
All Strategies Are Good; If Managed Properly!
~Richard

Injective | INJ & AvalonThe price of Injective 8 dollar today with a 24hour trading volume of 69 million dollar. This represents a 13% price increase in the last 24 hours and a 29% price increase in the past 7 days. With a circulating supply of 80 Million INJ, Injective is valued at a market cap of 640 million dollar.
Injective is a blockchain built for finance. It is an open, interoperable layer1 blockchain powering next gen DeFi applications, including decentralized spot and derivatives exchanges, prediction markets, lending protocols..
Injective is upgrading its Avalon mainnet with overwhelming community support. The upgrade aims to enhance L1 scalability, achieve sub-second block generation time, and implement PoS delegation transformation.the upgrade will optimize transaction processing speed, network efficiency, and security within the Injective ecosystem
Inj price is up 400% since we posted the first analysis on January and it tries to recover as fast as possible. most indicators sending a buy signal and the volume looks strong too

Where Should We Rebuy The PUMP? (8H)With the large bearish master candle formed at the top, the structure has turned bearish.
The green zone is the best and lowest-risk area for long positions or rebuys.
Reaching this zone may take some time, but you can already add this symbol to your watchlist and wait for it to reach the area before entering a position.
A 25%–45% return can be expected from this zone.
A daily candle closing below the invalidation level will invalidate this analysis.
For risk management, please don't forget stop loss and capital management
Comment if you have any questions
Thank You

ME Likely to Revisit 1.415 ZoneBased on the MissedPrice concept, rapid price moves often skip levels that price later revisits. The 1.415 level shows an Open Interest leap, suggesting missed positions.
