Xrp (Ripple)Ripple
Xrp usdt Daily analysis
Time frame daily
Risk rewards ratio >3.2 👈👌
Target 3.2$
Ripple technical analysis ✅️
My last short position reached the target.
Head and shoulders pattern completed.
Now it is a good time to start
My critical area is red box that you see on the chart. It is very important area .
If Ripple can reach and break this resistance, we will have a good pump
But now 3 _3.2$ is a good target
Pump

BnbBnb usdt Daily analysis
Time frame daily
Risk rewards ratio >2.3
Target 843$
Bnb move up and down between two Grey line that you can see on the chart
3 times it dropped but couldn't break the support line and now it is a good time to reach the target ( upper side of grey tunnel )

LTO - Its Logo Says It All...Hello TradingView Family / Fellow Traders. This is Richard, also known as theSignalyst.
📚 After breaking above the $0.03 structure marked in blue, GETTEX:LTO has shifted its momentum from bearish to bullish.
It is currently in a correction phase, but as long as the $0.03 support holds, we’ll be eyeing trend-following long setups to catch the next impulsive wave upward.📈
🎯 Short-term target: $0.05
🎯 Mid-term target: $0.10
🎯 Long-term target: $0.50
📚 Always follow your trading plan regarding entry, risk management, and trade management.
Good luck!
All Strategies Are Good; If Managed Properly!
~Rich

I'm Bullish, but... CHR / USDTEvening fellas,
My latest posts are bullish, and I did long some coins during the blood we had a couple of days ago.
But one must always be ready and I am seeing something interesting in a couple of coins, showing me that there's a hidden bearish scenario behind all the hype.
CHR is one of those coins, it's got good news, hype, etc, but I think MM'rs want to destroy some lives.
Keep an eye on it.
Trade thirsty, my friends!

Conspicuous - MANA / USDTEvening fellow traders,
Every now and then I ride waves on MANA.
This time it won't be different, as I am already in it.
But I'm looking for an extra touch, that outta the box type thing and buying an extra chunk between the prices shown in the chart.
Please take advantage of this if you get the chance, and let's make a big chunk of money together!
Trade thirsty, my friends!

#BTC #BTCUSD #BTCUSDT #BITCOIN #LONG #SWING #Analysis #Eddy#BTC #BTCUSD #BTCUSDT #BITCOIN #LONG #SWING #Analysis #Eddy
BTCUSDT.P Swing Long Analysis With Entry Points.
This is my possible Scenarios 1&2 analysis of Bitcoin's future trend.
This Analysis is based on a combination of different styles, including the volume,ict & Price Action Classic.
Based on your strategy and style, get the necessary confirmations for this Swing long to enter the trade.
Don't forget risk and capital management.
First Entry point of Scenario 1 already touched.
The responsibility for the transaction is yours and I have no responsibility for not observing your risk and capital management.
🗒 Note: The price can go much higher than the first target, and there is a possibility of a 500% pump on this currency. By observing risk and capital management, obtaining the necessary approvals, and saving profits in the targets, you can keep it for the pump.
Spot Investing : ((long 'buy' position)) :
🟢 Entry 1 : 79285.50 (( Scenario 1 Entry point ))
🟢 Entry 2 : 61845.77 (( Scenario 2 Entry point ))
⚪️ SL : Behind the last shadow created.
⚫️ TP1 : 250000
⚫️ TP2 : 500000
⚫️ TP3 : 999000
‼️ Futures Trading Suggested Leverages : 3-5-7
The World Let it be Remembered...
Dr. #Eddy Sunshine
4/4/2025
Be successful and profitable.
My previous analysis of Bitcoin (a view of one of the reasons for my first scenario):
Do you remember my first Bitcoin swing long signal entry & targets?
My first swing long signal was provided on BTC, which was spot pumped by more than 150% and was profitable :

Another market manipulation. It is spiraling out of control!I’m not here to express political opinions, but let’s be real—the Trump family launching meme coins, rugging retail investors, and manipulating markets is spiraling out of control.
💥 $TRUMP and $MELANIA were just the beginning.
Today, we witnessed what could be the biggest market manipulation in history, and it was executed with textbook precision:
Step one: float a fake news headline to test the market reaction.
Step two: publish a deliberately confusing statement where Trump says everything and its opposite.
Many misunderstood it as a “90-day tariff pause.”
🕛 The timing?
The announcement dropped at 12:30 PM EST—midnight in Asia, and 7 PM in Europe, when banks and institutions were closed.
🎯 Only the U.S. was awake and able to buy the pump.
Everyone else? Left sidelined.
No politician in modern history has manipulated global markets to this extent.
It’s turning Wall Street into a Las Vegas casino for the elite.
To make matters worse, Trump even tweeted a sarcastic:
“It’s a great day to buy stocks.”
🧨 Reality check:
He lowered current tariffs by just 10%
Hit China with a massive 125% tariff
Recession risk? Still on the table
Economic uncertainty? Worse than ever
You think China will just let this slide? Retaliation is coming.
What we're seeing is a nation burning its credibility while recklessly using financial power to create chaos.
🚨 If you think your money is safe in markets run by these people, think again.
This isn't trading anymore—it's Russian Roulette. Markets needs stability.
DYOR

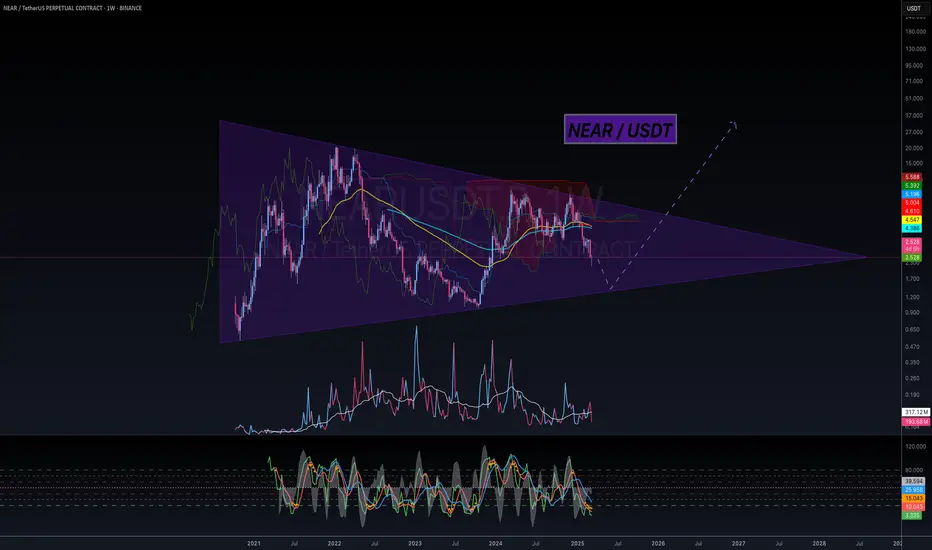
I'm Bullish, but... NEAR / USDTHello again my brothers and sisters,
3 Drive Structure, do I need to say anything else?
I mean, look at this symmetrical triangle, when this blows, in the past, did it only touch base twice? I dont think so, 3 drive structure is needed for this and then we can be extremely bullish!
I'll be loading my boat down there.
If this helped you out, let me know!
Trade thirsty!
I'm Bullish, but... BTC / USDHello my friends,
At a minimum we're looking at 30 days inside this wedge before breaking out and testing the $96k range once again. Trust me, Bitcoin must form a bullish structure before doing anything interesting.
It could wick to FWB:73K but I'm thinking the heavy orders around $75k might hold and we range instead of dumping more.
Keep an eye on this wedge.
Trade thirsty, my friends!

I'm Bullish, but... MANA / USDTHi friends,
My latest post about MANA was bullish, and I did buy some of the blood we just had.
But this would be another coin that could drop 25% - 30% giving a great opportunity.
Keep an eye on BTC cause if it dumps, this will happen.
Trade thirsty!

#BTC #BTCUSD #BTCUSDT #BITCOIN #LONG #SWING #Analysis #Eddy#BTC #BTCUSD #BTCUSDT #BITCOIN #LONG #SWING #Analysis #Eddy
BTCUSDT.P Swing Long Analysis With Entry Point
This is my first possible scenario and analysis of Bitcoin's future trend.
This Analysis is based on a combination of different styles, including the volume,ict & Price Action Classic. (( Head & Shoulder Pattern ))
Based on your strategy and style, get the necessary confirmations for this Swing long to enter the trade.
Don't forget risk and capital management.
Entry point already touched : 🟢 79285.50
The responsibility for the transaction is yours and I have no responsibility for not observing your risk and capital management.
🗒 Note: The price can go much higher than the first target, and there is a possibility of a 500% pump on this currency. By observing risk and capital management, obtaining the necessary approvals, and saving profits in the targets, you can keep it for the pump.
Spot Investing : ((long 'buy' position)) :
🟢 Entry 1 : 79285.50
🟢 Entry 2 : 61845.77 (( This Entry is for secound scenario ))
First entry point calculations :
⚪️ SL : Behind the last shadow created.
⚫️ TP1 : 250000 ((215.32%))
⚫️ TP2 : 500000 ((530.63%))
⚫️ TP3 : 999000 ((1160.00%))
‼️ Futures Trading Suggested Leverages : 3-5-7
The World Let it be Remembered...
Dr. #Eddy Sunshine
4/4/2025
Be successful and profitable.
Do you remember my first Bitcoin swing long signal entry & targets?
My first swing long signal was provided on BTC, which was spot pumped by more than 150% and was profitable :

#ETH #ETHUSDT #ETHEREUM #LONG #SWING #Analysis #Setup #Eddy#ETH #ETHUSDT #ETHEREUM #LONG #SWING #Analysis #Setup #Eddy
ETHUSDT.P Swing Long Analysis & Setup
Important area of the upper time frame for swing are identified and named.
This setup is based on a combination of different styles, including the volume style with the ict style.
Based on your strategy and style, get the necessary confirmations for this Swing Setup to enter the trade.
Don't forget risk and capital management.
The entry point, take profit point, and stop loss point are indicated on the chart along with their amounts.
The responsibility for the transaction is yours and I have no responsibility for not observing your risk and capital management.
🗒 Note: The price can go much higher than the second target, and there is a possibility of a 500% pump on this currency. By observing risk and capital management, obtaining the necessary approvals, and saving profits in the targets, you can keep it for the pump.
⚠️ Warning : The stop loss is dramatic and large. Place the stop loss based on your strategy and after getting entry and confirmation on the entry point behind the last shadow that will be created. (( This is just my opinion and is not meant to be 100% correct, so be careful with your capital. ))
Spot Investing : ((long 'buy' position)) :
🟢 Entry 1 : 1800
🟢 Entry 2 : 1500
First entry point calculations :
⚪️ SL : 1370 ((23.89%))
⚫️ TP1 : 4500 ((150%))
⚫️ TP2 : 5000 ((177.78%))
⚫️ TP3 : 8000 ((344.44%))
⚫️ TP4 : 10000 ((455.56%))
‼️ Futures Trading Suggested Leverages : 3-5-7
The World Let it be Remembered...
Dr. #Eddy Sunshine
4/4/2025
Be successful and profitable.
Do you remember my first Ethereum swing long signal?
My first swing long signal was provided on Ethereum, which was spot pumped by more than 100% and was profitable :

#X #XUSDT #XEMPIRE #LONG #Setup #Eddy#X #XUSDT #XEMPIRE #LONG #Setup #Eddy
XUSDT.P Long Setup
Important areas of the upper time frame for scalping are identified and named.
This setup is based on a combination of different styles, including the volume style with the ict style.
Based on your strategy and style, get the necessary confirmations for this setup to enter the trade.
Don't forget risk and capital management.
The entry point, take profit point, and stop loss point are indicated on the chart along with their amounts.
The responsibility for the transaction is yours and I have no responsibility for not observing your risk and capital management.
Note : The price can go much higher than the second target, and there is a possibility of a 100% pump on this currency. By observing risk and capital management, obtaining the necessary approvals, and saving profits in the targets, you can keep it for the pump.
Warning : The stop loss is dramatic and large. Place the stop loss based on your strategy and after getting entry and confirmation on the entry point behind the last shadow that will be created.
Be successful and profitable.
I hope you enjoyed the previous analysis and signal of this currency.
Previous analysis and signal Of X Empire :

GOLD Market Update: Pullback in Progress BUY DIPS TP 3200 USD🏆 Gold Market Update (April 1st, 2025)
📊 Technical Outlook Update
▪️Bullish OUTLOOK
▪️Broke out and set new ATH
▪️Strong UPTREND: Sequence of Higher Lows
▪️Recommend to BUY DIPS at $3,050 USD
▪️Price Target BULLS: $3,150 USD - $3,200 USD
📈 Market Performance & Price Action
🚀 Gold Hits All-Time High: Surpassed $3,100 per ounce
📊 Driven by: Geopolitical tensions and economic uncertainty
🏦 Federal Reserve Impact
🛑 Fed Keeps Interest Rates Steady: Maintained at 4.25%–4.50%
🔮 Signals: 2 rate cuts likely in 2025 due to slowing growth
📉 Lower rate outlook supports bullish gold sentiment
💹 Gold Investment Trends
📈 Gold ETFs Outperform Physical Gold
GDX (Gold Miners ETF): ↑ 32%
GLD (SPDR Gold Shares): ↑ 15.5%
📊 Investors leaning toward mining stocks & ETF exposure for higher returns

XRPUSDT.P — Is This the Beginning of the Next Pump?
BINANCE:XRPUSDT.P is bouncing back with style — and this long setup is giving off real “king of the charts” vibes. Look at that clean risk-to-reward!
Entry: 2.0905 USDT
Stop-loss: 2.0574 USDT
Take-Profit: 2.2238 USDT
R:R Ratio: 3.28
Why this setup matters:
Confirmed bounce off intraday support
Momentum shift with bullish engulfing candle
Targeting a clean resistance level for optimal exit
Tight stop, juicy upside — exactly what scalpers and day traders crave. Add to watchlist and get ready to trail that stop if momentum holds.

Tesla PushI see a valid break and retest forming with nice volume
the trade is simple
Im buying the retest of the break and im taking my trade to the breakout high
most likely im going to get 50% of the move back to the high either way im going to make cash

ALGO / USDT - Big Move AheadEvening fellas,
I got an order ready near the gap I believe its at $0.1844, it would require coming back down to the purple between both trendiness, one placed at the wick low, and the other at the body.
Maybe it moves up to resistance once again before a final shakeout.
It'll be a nice long.
Trade thirsty.

BNB/USDTBNB$ pascal hard fork today and holding well above the 200-day EMA.
_ Expect a 10%-20% pump from here.

Big pump incoming for XRPI send a signal for all to buy XRP as i said big changes is coming and the end of lawsuit with SEC had came to an end !!
XRP will hit over 3$ then passed over 5$ qnd its possible possible will hit 10$ worth of XRP.
Keep holding and dont sell

The Next Leg nas100To me this is very bullish (break and retest on lower time frames and even the 6month chart is showing a retest to the last candle close) Im looking for a 50 percent push back up on the bearish candle on the 6month chart and if we continue i will continue to hold and close partials

DOT 10x Possibility Very SoonHello once again friends,
Here's a coin that I'll long for a nice 10X from the lows.
Make sure to scoop some out, because its a solid project.
Trade thirsty!

Last Leg of The Bull RunBased on historical patterns, I believe we are in the final phase of the current bull run. Analyzing previous market cycles, the peak of the 2013 bull run to the 2017 peak had a 49-month bar separation, while the 2017 to 2021 cycle exhibited a 47-month separation. Following this established “-2” pattern, the next peak is likely to occur with a 45-month separation.
Additionally, we are currently positioned within a monthly fair value gap, which could drive the market to new highs. However, I remain skeptical about the sustainability of this rally due to the impact of the U.S. crypto reserve. Institutional investors may perceive this as an opportunity for exit liquidity, aligning with the well-known market principle: "Buy the hype, sell the news."
- Gavin
do your own research
not financial advice just a speculation

Crypto.com (CRO)Cro usdt Daily analysis
Time frame daily
Risk rewards ratio >5.3 👈👌
Nothing to say
Chart is clear
Red line is historical support line
