PUNDIXUSDT | Early Buyers Showing UpBuyers might be waking up on PUNDIXUSDT, it’s not confirmed strength yet, but the signs are there.
Those looking for a tight-stop trade can wait for lower levels and attempt a quick long.
But for spot entries, waiting may not be necessary. Current price isn't ideal, but it’s not unreasonable either if momentum builds.
Be early, not reckless.
📌I keep my charts clean and simple because I believe clarity leads to better decisions.
📌My approach is built on years of experience and a solid track record. I don’t claim to know it all but I’m confident in my ability to spot high-probability setups.
📌If you would like to learn how to use the heatmap, cumulative volume delta and volume footprint techniques that I use below to determine very accurate demand regions, you can send me a private message. I help anyone who wants it completely free of charge.
🔑I have a long list of my proven technique below:
🎯 ZENUSDT.P: Patience & Profitability | %230 Reaction from the Sniper Entry
🐶 DOGEUSDT.P: Next Move
🎨 RENDERUSDT.P: Opportunity of the Month
💎 ETHUSDT.P: Where to Retrace
🟢 BNBUSDT.P: Potential Surge
📊 BTC Dominance: Reaction Zone
🌊 WAVESUSDT.P: Demand Zone Potential
🟣 UNIUSDT.P: Long-Term Trade
🔵 XRPUSDT.P: Entry Zones
🔗 LINKUSDT.P: Follow The River
📈 BTCUSDT.P: Two Key Demand Zones
🟩 POLUSDT: Bullish Momentum
🌟 PENDLEUSDT.P: Where Opportunity Meets Precision
🔥 BTCUSDT.P: Liquidation of Highly Leveraged Longs
🌊 SOLUSDT.P: SOL's Dip - Your Opportunity
🐸 1000PEPEUSDT.P: Prime Bounce Zone Unlocked
🚀 ETHUSDT.P: Set to Explode - Don't Miss This Game Changer
🤖 IQUSDT: Smart Plan
⚡️ PONDUSDT: A Trade Not Taken Is Better Than a Losing One
💼 STMXUSDT: 2 Buying Areas
🐢 TURBOUSDT: Buy Zones and Buyer Presence
🌍 ICPUSDT.P: Massive Upside Potential | Check the Trade Update For Seeing Results
🟠 IDEXUSDT: Spot Buy Area | %26 Profit if You Trade with MSB
📌 USUALUSDT: Buyers Are Active + %70 Profit in Total
🌟 FORTHUSDT: Sniper Entry +%26 Reaction
🐳 QKCUSDT: Sniper Entry +%57 Reaction
📊 BTC.D: Retest of Key Area Highly Likely
📊 XNOUSDT %80 Reaction with a Simple Blue Box!
📊 BELUSDT Amazing %120 Reaction!
📊 Simple Red Box, Extraordinary Results
📊 TIAUSDT | Still No Buyers—Maintaining a Bearish Outlook
📊 OGNUSDT | One of Today’s Highest Volume Gainers – +32.44%
I stopped adding to the list because it's kinda tiring to add 5-10 charts in every move but you can check my profile and see that it goes on..
Pundixlong
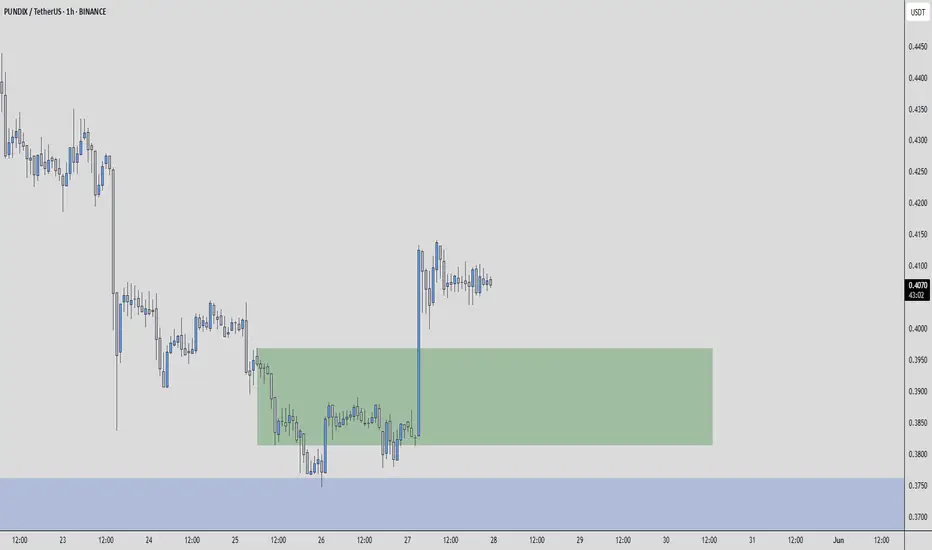
PUNDIXUSDT - Not Looking BadPUNDIXUSDT – While many coins are showing instability, PUNDIX is quietly maintaining its ground. This kind of silence often precedes sharp movement. We’ve identified the blue box as the first significant support area, and if you’ve been following my work, you already know that I always recommend waiting for confirmation before acting.
We’ve seen this pattern many times — a coin that looks quiet, ignored by the crowd, suddenly attracts volume and explodes. I don’t insist on my long idea blindly. If the levels break downward and fail to give confirmation on low timeframes, I’ll pass. But if the support holds and we regain with solid candles and volume, this could be a high-risk/high-reward opportunity.
It’s also worth noting that I only select coins that show significant relative volume spikes, and PUNDIX made it to that list today — which is not something you can ignore.
📌 Remember: Most people don't understand these deeper orderflow and volume strategies. That’s why you’re here. You don’t have to trade blindly anymore. My methods, which are visible in my profile with a proven win rate, are built to protect you and help you grow.
So, keep your eyes on the blue box. This might be the moment everyone else misses.
📌I keep my charts clean and simple because I believe clarity leads to better decisions.
📌My approach is built on years of experience and a solid track record. I don’t claim to know it all but I’m confident in my ability to spot high-probability setups.
📌If you would like to learn how to use the heatmap, cumulative volume delta and volume footprint techniques that I use below to determine very accurate demand regions, you can send me a private message. I help anyone who wants it completely free of charge.
🔑I have a long list of my proven technique below:
🎯 ZENUSDT.P: Patience & Profitability | %230 Reaction from the Sniper Entry
🐶 DOGEUSDT.P: Next Move
🎨 RENDERUSDT.P: Opportunity of the Month
💎 ETHUSDT.P: Where to Retrace
🟢 BNBUSDT.P: Potential Surge
📊 BTC Dominance: Reaction Zone
🌊 WAVESUSDT.P: Demand Zone Potential
🟣 UNIUSDT.P: Long-Term Trade
🔵 XRPUSDT.P: Entry Zones
🔗 LINKUSDT.P: Follow The River
📈 BTCUSDT.P: Two Key Demand Zones
🟩 POLUSDT: Bullish Momentum
🌟 PENDLEUSDT.P: Where Opportunity Meets Precision
🔥 BTCUSDT.P: Liquidation of Highly Leveraged Longs
🌊 SOLUSDT.P: SOL's Dip - Your Opportunity
🐸 1000PEPEUSDT.P: Prime Bounce Zone Unlocked
🚀 ETHUSDT.P: Set to Explode - Don't Miss This Game Changer
🤖 IQUSDT: Smart Plan
⚡️ PONDUSDT: A Trade Not Taken Is Better Than a Losing One
💼 STMXUSDT: 2 Buying Areas
🐢 TURBOUSDT: Buy Zones and Buyer Presence
🌍 ICPUSDT.P: Massive Upside Potential | Check the Trade Update For Seeing Results
🟠 IDEXUSDT: Spot Buy Area | %26 Profit if You Trade with MSB
📌 USUALUSDT: Buyers Are Active + %70 Profit in Total
🌟 FORTHUSDT: Sniper Entry +%26 Reaction
🐳 QKCUSDT: Sniper Entry +%57 Reaction
📊 BTC.D: Retest of Key Area Highly Likely
📊 XNOUSDT %80 Reaction with a Simple Blue Box!
📊 BELUSDT Amazing %120 Reaction!
📊 Simple Red Box, Extraordinary Results
I stopped adding to the list because it's kinda tiring to add 5-10 charts in every move but you can check my profile and see that it goes on..

PUNDIXUSDT 1DPUNDIX ~ 1D Analysis
#PUNDIX Buy after successfully penetrating the resistant line of this pattern with a short -term target of at least 10%+.

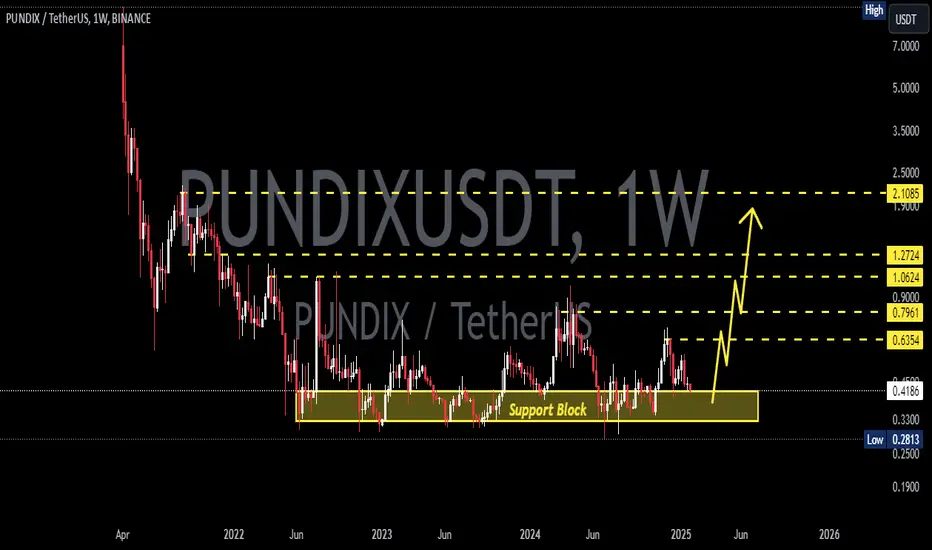
PUNDIXUSDT 1WPUNDIX ~ 1W Analysis
#PUNDIX This is the lowest support block for now. Buy from here if you still have a Conviction on Coin. with a minimum target of 20%+.

PUNDIXUSDT 1WPUNDIX ~ 1W Analysis
#PUNDIX So far it still maintains this support block. Buy from here if you still have a Conviction on this coin with a minimum target of 20%+
PUNDIXUSDT IDEA WEEKLY TIMEFRAMEBINANCE:PUNDIXUSDT
Pundix Usdt weekly time frame bullish bottom out.
I think it will blast upto 150% 200%.
NOT A FINANCIAL ADVISE DYOR

#PUNDIX/USDT#PUNDIX
The price is moving in a downward channel and sticking to its limits well
It was penetrated upwards forcefully and was stabilized above it
We have a higher stability Moving Average 100 in red
We have an uptrend on the RSI that the price is following well
Entry price is 0.4734
The first target is 0.5022
The second target is 0.5352
The third goal is 0.5748

Pundix begins it's move!As you can see from this setup, Pundix has converged perfectly to make a huge rebound to the upsides. The charts have shown us straight to our face. A clear signal point for the reversal. Expect big moves coming soon because things are getting extremely bullish for the whole altcoin markets!

A huge breakout for Pundi X!!Will we see all time highs coming in this breakout!? We'll have to wait and see. It looks like it's definitely pushed through and doesn't seem like it's slowing down as of yet.

PUNDIX formed big bullish Gartley for upto 15% pumpHey dear friends, hope you are well and welcome to the new trade setup of PUNDIX with BTC pair.
On a daily time frame, PUNDIX has formed a bullish Gartley setup
Note: Above idea is for educational purpose only. It is advised to diversify and strictly follow the stop loss, and don't get stuck with trade

PUNDIX formed big bullish Gartley for upto 89.50% pumpHi friends, hope you are well and welcome to the new trade setup of PUNDIX with US Dollar pair.
On a 4-hour time frame, PUNDIX has formed a bullish Gartley pattern.
Note: Above idea is for educational purpose only. It is advised to diversify and strictly follow the stop loss, and don't get stuck with trade


PUNDIXUSDT potential coin to jump in??PUNDIXUSDT trade is potential trade and is running in the area of buy supply zone. It will recover 61% Fib level which will be 6X growth if you enter in the supply zone area. Trade boosting session will be strong as it crosses triangle.

for education purpose Not Fınancıal AdviseThe given chart shows that 1.210 important resistance if it breaks, we may see;
TP1:1.263
TP2: 1.330
TP3:1.416
Btw, Pundıx has some good news this week as you know (burn).

PUNDIX HODL ! Hello there ;
PundiX The former NPXS could not collect volume after the split. The reason for this was that swap transactions did not occur in all exchanges during the transition period, and 2 coins and investors were formed in the market as both NPXS and PundiX. Recently, they have been trying to support the transitions in other exchanges and this process will necessarily increase the demands for PundiX. HODL can be added to the list of coins we will be adding, and many different figures may be encountered in the future.
We created a channel between 3.60 and 2.70. If there can be an exit from the channel, the rise can accelerate.
Reg.
Merhaba ;
PundiX Eski NPXS bölünme sonrası hacim toplayamadı . Bunun sebebi geçiş sürecinde bütün borsalarda swap işlemi gerçekleşmemesiydi piyasada hem NPXS olarak Hem PundiX olarak 2 coin ve yatırımcısı oluştu. Yakın tarihlerde geçişleri diğer borsalarda da desteklemeye çalışıyorlar ve bu süreç PundiX e olan talepleri zorunlu olarak arttıracaktır. HODL edeceğimiz coin listesine eklenebilir ileride çok farklı rakamlar ile karşılaşılabilir.
3,60 ile 2,70 arasında bir kanal oluşturduk. Kanaldan yukarıya çıkış olabilir ise yükseliş hızlanabilir.
YTD.
Syg.

PUNDIX Playout 2Things are turning around, lets pray and hope it stays that way. We all know this is crypto anything can happen.
All my thoughts and analysis based on past price movements. *An attempt to predict future price movements*
I try my best to be as insightful as possible but I'm not a financial advisor and in no way claim to be. Crypto can be an unforgiving place with the prices movements, so please trade wisely and do your research and analysis then compare with mine and others if you wish.
I'm still bullish and I believe in the project

Pundi X Moving average kissThis is what I would call a MA kiss,
as the moving averages slightly meet parallel to each other then eventually diverge
I have plotted the divergence on the chart
Also a cup and handle pattern
Inverted in this example

Pundi X seems to be good to be purchased and HODLed 18/02/2021NPX (Pundi X) seems to be at the price which we can purchase it as the underlying and keep it for long,
there are total of 3 TPs that we can sell it of if we needed to capitalize on it or else it seems to be worth of holding for a while

NPXSUSDT reached at resistance of big pennantHi friends, hope you are well and welcome to new update on Pundi x (NPXS) token.
Breaking down the channel’s support:
The price action of NPXS has broken down the support of channel but still has good supports of 50,100 and 200 simple moving averages. The 50 SMA has also formed golden cross with 200 SMA.
Resistance of Cup & Handle pattern:
On small time period 4-hour chart the price action has formed a resistance of Cup at $0.00021 after the formation of Cup & Handle.
Bullish pennant and long-term resistance:
On weekly chart, the priceline of Pundi X has formed a bullish pennant and trying to breakout the resistance. There is a strong price level resistance at $ 0.0002350 as well.
Harmonic BAT move:
On daily time period chart, the priceline of Pundi x is completing final leg of bullish reversal BAT pattern.
Ichimoku and Chop zone:
On long-term weekly chart, the price action has entered in Ichimoku bearish cloud and chop zone indicator is also turned strong bullish.
Conclusion:
On short term a bullish reversal is possible, but if this bullish move will be continued then it can be also helpful to breakout the bullish pennant on weekly chart and completely breaking out the Ichimoku bearish cloud as well.

NPXSUSDT another bullish reversal pattern is formedOn daily time period chart, the price action of Pundi X (NPXS) is completing final leg of bullish BAT and soon it will be reached in potential reversal zone.
Buying And Sell Targets:
The buying and sell targets as per Fibonacci sequence of BAT pattern should be as below:
Potential reversal or buying zone: $0.0001734 to $0.0001676
Sell or Fibonacci projection zone: $0.0001870 to $0.0002078
Stop Loss:
The potential reversal zone area that is up to $0.0001676 can be used as stop loss in case of complete candlestick closes below this level.
Possible profit and loss ratio:
As per above targets this trade has a profit possibility of 23.9% and as per the above-mentioned stop loss, the loss possibility is 3.4%.
Note: Above idea is for educational purpose only. It is advised to diversify and strictly follow the stop loss, and don't get stuck with trade.

NPXSUSDT Cn Be One Of The Top 200 Alts To Join Bitcoin RallyHey friends, hope you are well and welcome to the new update on Pundi X.
The price action of NPXS is forming different harmonic moves with continuity. 1st it formed a bullish Shark on 2 day chart and produced more than 60% profit rally.
Then on daily chart it formed a BAT move that I also showed in my previous post. And so far it has produced more than 17% move.
At this time on daily chart the priceline is breaking out the 200 SMA resistance. And after this breakout we can expect a golden cross between 50 simple moving average and 200 SMA.
In the meanwhile the price action of NPXS token is also breaking out the resistance of an up channel on the daily time frame chart. The volume profile of complete channel is showing less interest of the traders below half of this channel and from the upside it is showing interest of the traders even above the resistance. This is very strong signal indicating for break out soon.
At the same time if we switch on the smaller time period chart with 4 hour then a price level resistance can be found at $0.0001700.
Conclusion:
At the same time the priceline of Pundi X is breaking out the 200 SMA and the resistance of the channel on daily chart. And almost broke out the price level resistance at $0.0001700. Once these breakouts will be finalized we may see that the NPXS join the BTC rally as well. And it can become one of the top alts among 200 cryptocurrencies and tokens to join this rally.

NPXSUSDT forming bullish BAT | Upto 41% move aheadOn a daily chart, the price action of Pundi X is completing the final leg of bullish harmonic BAT pattern and soon it will be entered in a potential reversal zone.
Buying And Sell Targets:
The buying and sell targets according to harmonic BAT pattern should be:
Buy between: $0.0001460 to $0.0001379
Sell between: $0.0001654 to $0.0001948
Stop Loss:
The potential reversal zone area that is up to $0.0001379 can be used as stop loss in case of complete candlestick closes below this level.
Possible profit and loss ratio:
As per above targets this trade has the profit possibility of 41% and as per above-mentioned stop loss, the loss possibility is 5.6%.

NPXSUSDT formed two bullish reversal movesHey, friends hope you are well and welcome to the new update on Pundi X. Previously we have seen that this token had formed a Cup and Handle formation and the price action was just completing the handle of this cup. Therefore I was expecting that the price action will try to breakout the resistance of the Cup that was at $0.0002400. Finally the price action started the bullish move and hit the resistance of the cup but unfortunately the priceline of NPXS token failed to breakout and dropped down again.
The support of the channel is broken down:
During this drop the price action also broke down the support of the up channel where it was moving since mid of March 2020.
www.tradingview.com
The priceline is breaking out 200 SMA:
The price action of Pundi X token also broke down the 50, 100 and 200 simple moving averages on the daily chart. Then the priceline started consolidating just underneath 200 simple moving average. Now the price action of NPXS token is likely to breakout the 200 SMA again. Once the priceline will have strong support of 200 simple moving average then we can expect that it will also break out the 50 and 100 simple moving averages as well.
Hrmonic bullish Shark move:
Now if we switch back to the 2 day chart again then it can be easily observed that the cup and handle pattern is still not invalidated because the price action has retraced up to 0.618 Fibonacci level. This is the Fibonacci level from the bottom of the cup to the resistance. Now if we take more closer look at the chart then it can be easily seen that the price action has also completed the bullish Shark pattern on this 2 day chart and just entered in the potential reversal zone. After initial X to A leg the price action is retraced between 0.382 to 0.618 Fibonacci retracement level. Then B to C leg is projected between 1.13 upto 1.618 Fibonacci projection. There is a minor difference to reach up to 1.13 Fibonacci projection but all other legs are driven perfectly as required for the bullish Shark pattern, Therefore I have ignored this minor difference. The final leg has retraced between 0.886 to 1.13 Fibonacci level and from here the potential reversal zone of bullish shark starts. Now we can expect that from this PRZ level the price action can start the bullish move at any time.
Conclusion:
Even though the price action of NPXS token has formed two bullish reversal patterns therefore we can expect that the priceline will start the movement to the upside very soon. However, we should set the maximum extent of the potential reversal zone of bullish shark pattern as stop loss. Because if this support will be broken down then more powerful rally to the downside can be started.
