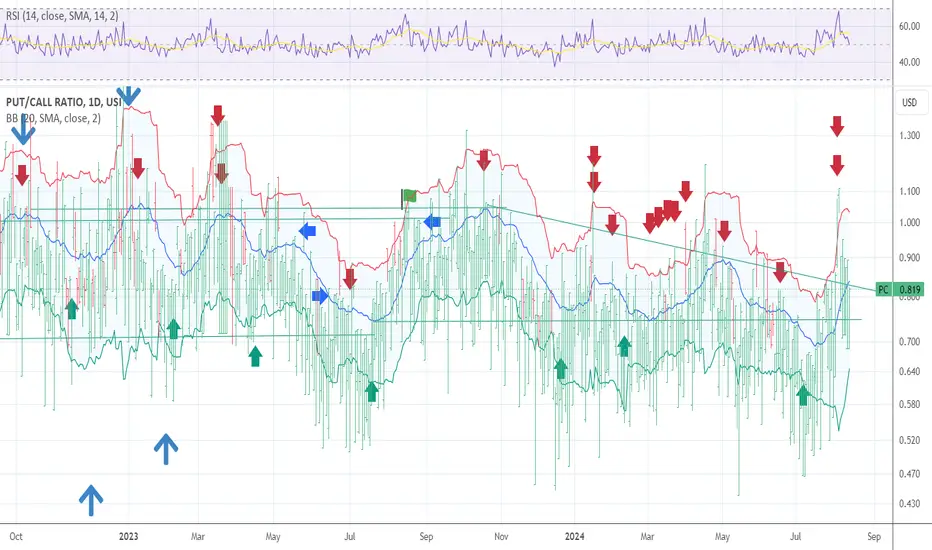
QQQ NOTICE TREND LINE SUPPORT I have now started to position for the transition in the markets I have moved out of all calls again for the 4 time in 4 days each of the trades made $$ . but today is day 39 TD of the rally . And I am looking for a TOP in day 40 TD I have now moved to 40 today then 75% MOC in spy and qqq 5550 555 560 QQQ puts 2026 time zone and 650 in spy . The trendline has held rather nice to help make some nice $$ and we if bullish should now be in early wave 3 of 5 of 5 of 5 .So why buy puts NOW simple answer is It could still be wave c up for wave B or wave D. and That today is day TD39 I have posted a possible Major top due on td 40 and The spiral hold up into june 6th to 9th .I know my risks and am willing to start taking the same stand and positions as I did 11/29 12/6 and feb 18th based on the wave structure and PUT /CALL model . I am willing to This is not for all traders . But I am turning down in NYSI and the NYMO is showing buying is running out but bullish call buying is nearing the two last TOPS . I have 25 % cash and will wait for two things One put call drops to 60 on 5 day or 10 day at 65 second daily RSI is no confirmation . 3rd the qqq reaches 531/534 knowing it could extend to 541/555 and similar in sp cash or the DJI prints a .786 this is a lot but it is part of the game plan best of trades WAVETIMER
Put-call-ratio

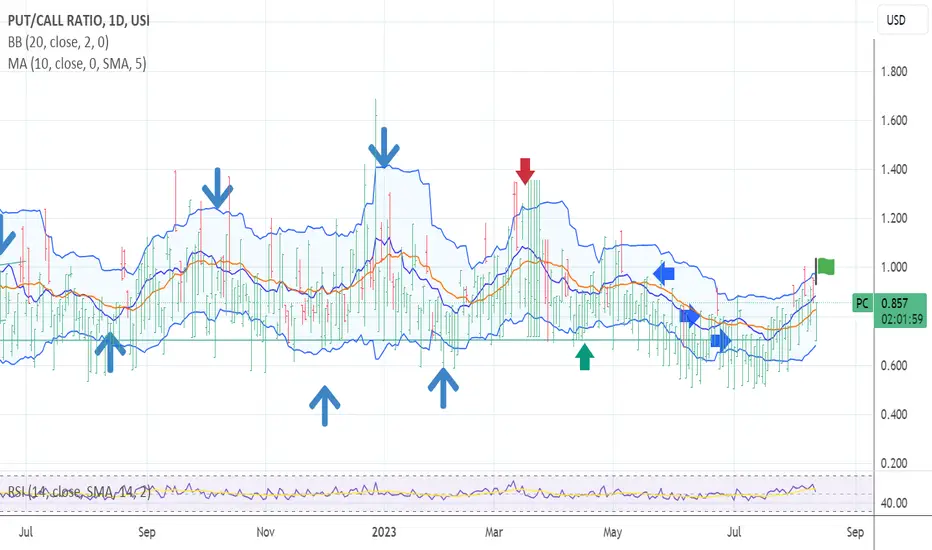
PUT CALL MODEL SELL SIGNAL is Been given The chart is my own model Take notice of the green arrows and that trend line Notice anything ??? I do hope so . The trend is your friend till the End Time to hold my Beer ! best of trades WAVETIMER 85 % long puts waiting and hoping for a final POP .

PUT CALL SELL SIGNAL IS NOW IN PLACE I am 100% short The chart posted is the put/call model We popped thru the bb bands I have now moved to a 100 % puts in the money dec 26 on qqq and spy I will add if the qqq can print 494 or the Spy can print and new high The cycle top was due 5/12 is a minor n MAJOR Best of trades Wavetimer

PUT CALL BUY SIGNAL MAJOR SP 5760/5880 The chart posted is my 20 day put/call . We have now reach a .50 % of the drop in QQQ and we have broke above .618 and 50 % of the drop in the sp 500 cash . We are alos forming clean 5 waves up patterns based on this chart in the put /call alone I must view the correction as OVER I had saw a chance to drop into 8/12 but the structure has turned up . Once we break above todays high n on a closing basis I will look for the min of a .786 to re think . Wavetimer
PUTWRITING DATA One would think this is a think to watch ! And everyone is moving long Calls in the data and now leveraged in 3 x times ETF that it would be the greatest way to profit from a sure thing RIGHT ???

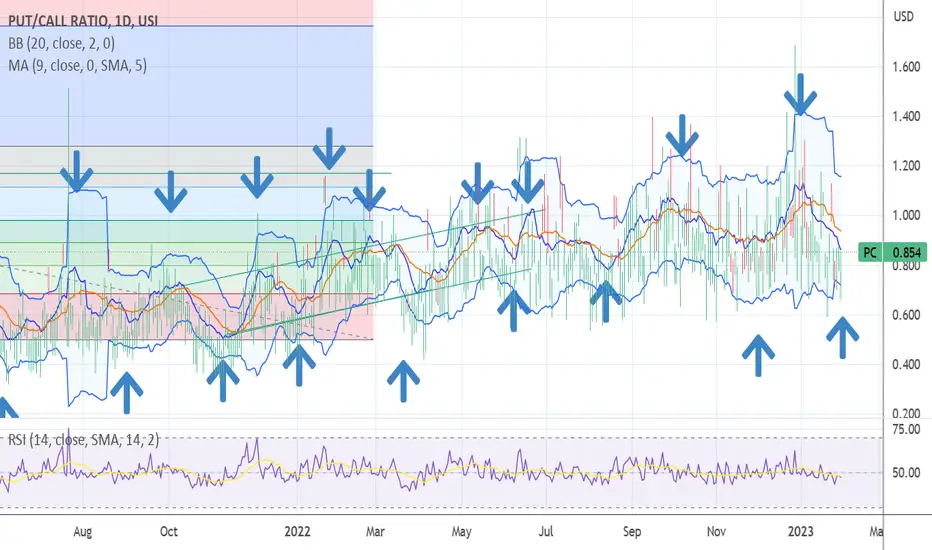
I.T. Put/call BUY in place The chart posted is that of my Put/Call model today is the second time we saw this happen in 2024 the last time was JAN /!7 th Low. . Risk now is being SHORT or in PUTS . Next turn date is 4/8/2024 best of trades WAVETIMER !


PUT CALL BUY SIGNAL is been given The chart posted is the 5 ,10 and 20 day p/c model The green flag is up this should lead to the final rally of 2023 to peak on or about sept 10 th target is 4666 ideal but from 4631 to 4731 will be there I will exit ALL LONGS THIS IS THE LAST WAVE UP . I then see the break down which should be rather steep and prolonged in a very deep recession as the deflationary cycle is and will be clear based on my work in money velocity . The consumer will be contracting and spending habits will drop very fast due to the paying back of student debt and housing deflation in the rent markets .
I now have a PUT/CALL SELLThe chart posted is that of the p/c model last week I said I had a BUY signal and to which I was given so much grief from traders It was spot on and all alt targets met and the 17 day shift from 2018 called for the peak on or about july 17 .I now have moved to a net short looking for a very sharp drop or worst into aug 25th I am net long march and feb in the money puts in QQQ and SMH . best of trades WAVETIMER

PUT CALL SIGNALS 20DAY/10DAY Chart posted is that of the 20 day and 10 day put call signal we are reaching a level to be net long PUTS and SHORTING
PCC - Options Volumes 71% DeclineLiquidity within Leveraged products was used to provide
a bid for the Underlying on Gamma/Delta.
With the overall decline in participation, we are seeing
Micro Range Squeezes develop when it is "Time".
Friday's trade was a run to Square, and with the Retail
Options players levered up in 420 Spy Calls... there was no
chance they would be paid.
The PCC remains useful although in a tighter range from .86
to 1.12.
Looking over the June 17s - "an Entity is looking for a deep correction of 20%+"
maximum-pain.com
