Market Alpha - EMBNASDAQ:EMB
As a way to get exposure to the China housing debacle.... I go over my chart on a new position I opened that has relatively low volatility considering the weight of exposure it may have to the chinese housing collapse.
Put

$ARKK Consolidation StraddleArk is strongly respecting these lines looking to see if it wants to break down or consolidate further.

$LCID - Call Put SpreadWill be interesting, LCID has a history of filling the gap, something we could see happening, but is also forming a bullish consolidation. If it doesn't break out/down before theta is priced in from this weekend, it could be a great spread.

$NVDA - Call Put Spread Waiting to see which colour line it respects the most before entering a play (to determine expiry).

AAPL Long Straddle Strike price: $149
Call Entry @ $3.12
Put Entry @ $3.43
Expiring October 1st
This is not financial advicr, just a description of the plays we are in!

$PLTR Cal Heavy Call Put SpreadThis chart and play was entered during that circle, however we did not publish it in time.

SLQT Long PutGap was filled. Plan to buy a $15 October Put in anticipation of the retest back down. Absolute zero trade...

Sold $SPX put verticalRelatively speaking, $SPX is till kind of weak, but I'm slightly bullish towards the end of Thursday. I sold Sept. 15th $4435/$4440 put vertical for $1.1 credit.

$TTD Bull Flag (Weekly)Weekly time frame
TTD - Labeled retracement levels. 69p is a solid swing play (exit 9/14 or 9/15)
Labeled extension levels
Like if you agree!

MARKET ALPHA WATCHLIST - INTCHey Everyone!
I hope everyone is having a blessed day. Today I'm posting a symbol from our watchlist. Spotted in the options market. We are watching INTC to see more strength and break above this trendline and possible downward trend. These are the levels to watch over the next few weeks whether long or or short.
NASDAQ:INTC

Rising Wedge Breakdown with Bearish Divergence.Gonna be looking for a quick 10-20 percent pullback from here.

Weekend BTC Hedge - use PUT spread!Trend reversal or correction? Over time, the situation in the bitcoin market should become more clear-cut. However, it is now possible to buy a hedge against a price decline with the PUT SPREAD.
Flash Idea:
To reduce the amount of risk, we choose the nearest expiration date of September 3. After that, we buy a 47 000 PUT option (we have to pay an estimated premium of $19 for a minimum transaction fee of 0.01BTC), and to finance this trade, we might sell two PUT 44 000 options (each with an estimated premium of $9).
This would hedge our last flush idea of BTC rising to September 24 for a week.
Risks: As the idea is to sell two PUT options at 44 000, after the price crosses 41 100 marks, the possibility of a loss arises.

Nifty Possible BreakdownYou can clearly see a divergence in RSI and Nifty chart. So anytime selling can come, I advice that to be on the safer side, the moment a 15 min candle closes below the ORB range a put option can be considered to buy or an call option can be considered to sell. But for more aggressive traders if nifty breaks the yellow trend line you can initiate a trade and we can see the levels of 16575 to 16600. But keep i min that the resistance on 1664 is very strong and market has previously seen reversal from this level and it can again show a reversal so let this level pass.
.
.
.
.
.
.
.
.
.
.
.
.
*Disclaimer*- This is just an analysis of the data on the basis of technical factors such as chart patterns, candlestick patterns, trend line , option chain data, etc,. Stock Market or Trading in any type of market is subject to high financial risk. You should see this idea as just an analysis. You are not obliged to follow my instructions. You will be responsible for all types gains or loses in the market.


When the Fed speaks buy SPY putsThe fed has meetings throughout the year and one couldn't help but notice that whenever Powell speaks the markets pull back. The yellow ranges are the actual meetings and the purple ranges are when the minutes from the previous meetings were released.

MRNA Low Risk Short PositionMRNA is hillariously overbought, with stochastics, EMA's, bollingerbands, MACD, and RSI on the daily chart all showing prime conditions for a short position.
Here's the chart showing those indicators:
I am going to be watching this on Monday and throughout the week, looking for a short position entrance. I played it on Tuesday for a nice $50/ share short with similar technical indicators. Hoping to duplicate that again this week. Might go debit, might go credit, not entirely sure how I'll play this yet. IVR is somewhat high for a credit trade, and since they have earnings coming up, I imagine that will continue to increase. For that reason, a debit trade might be the winner here. That said, if IVR collapses, that will hurt my trade.
Still formulating the exact plan, but I am going to play MRNA short in some capacity.
I am anticipating a retracement to the $300.00 / level in the short term at $250.00 in the next few months.

NVDA Crash Coming? Big Sell Opportunity? 600 incoming??Ive been looking into two stocks recently, NVDA and SPY, and they both look extremely overbought. I mention SPY only because NVDA is apart of the S & P 500, Ill upload my SPY short analysis soon.
However if you look into the weekly chart on the left it has broken out of an of what appears to be an already overbought channel. This channel dates back to 2018, where the MFI indicated overbought before a major dip under the 200 MA. Looking at where its at now, its above the channel where it was deemed to be oversold in 2018.
Looking at the daily chart on the right NVDA has been riding up the Bollinger Bands for the past month at an almost unsustainable rate causing the bands to have a range from $610 to $770. This is dangerous for the stock so all traders should trade with caution.
the MFI has just flipped downward which shows the money flow is starting to decrease, as well as the stoch RSI. The stock is also getting far from its 50 MA which is at $635 at the time of writing. Lastly looking at the fib retracement have broken past the 1.618 level. From 540 in May it has went straight up breaking threw 7 levels only retesting the .786 level at $625. Not to mention its up over 100% over the past year and even more since the corona crash.
I predict the 1.618 level wont hold for long and we should see a $650 NVDA in the near future, that is where we topped on April 15th, the 1 level on the fib retreacement, and around where the 50 MA should be soon. If it doesnt hold strong on that level we should be retesting the .786 level where it showed strong support flipped resistance before breaking through. If it doesnt hold around the 625 area then it appears the strongest level of support is the .5 level around 593. This could take a few weeks to develop. Trade with caution!

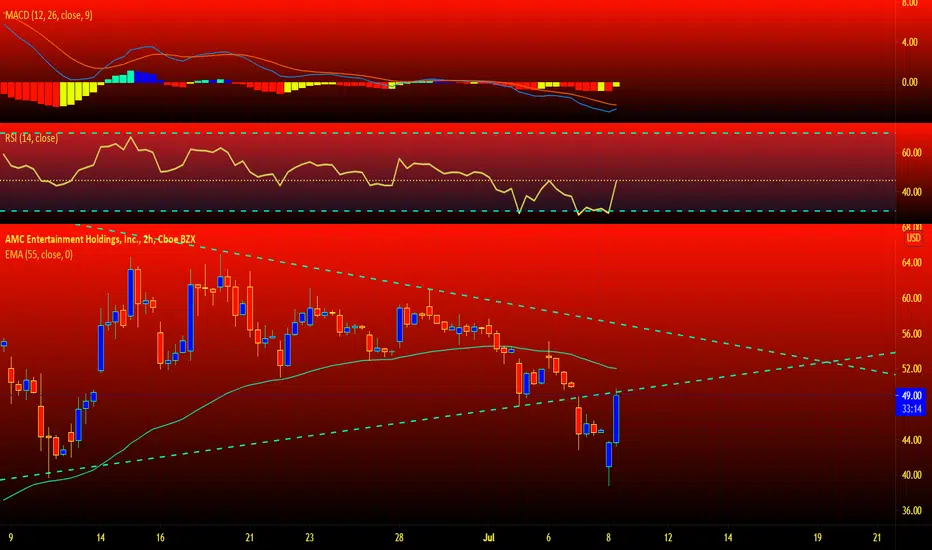
Market Alpha Technical Analysis - AMCSymbol: NYSE:AMC
Indicators
Laguerre RSI
Multi-Time Frame EMA
Comments: Looks like a lot more downside opportunity here for this stock.

AMC Resistance Battle!!Hello Community!
When looking at the 2hr TF, AMC has made a very strong bullish move since today's open. It is currently at a major resistance which can be seen in the chart. We need to end the day above this line to continue the bullish momentum. Typically once S/R is broken decisively the market will usually retest the S/R zone before continuing in the direction of the breakout. Let's see if this plays out to be a massive fake-out or if this is the prime area to short.
Don't trade with what you're not willing to lose.
Love it or hate it, hit that thumbs up and comment. It'll be greatly appreciated!
This is not financial advice.
Safe Trading Calculate Your Risk/Reward & Collect!
Simplicity Wins
Prepared for S&P500 correction with Buying PUT optionI've closed every other position, staying in cash and
playing for SPX correction because:
1/ SP500 RSI falling down
2/ Strong trendline broken
3/ Selling Volume increased
My strategy is simple:
BUY SPY Jun30' 415 PUT for 3.85db, because VIX is realive low
SIZING: only a little of my CAP is used for this binary play.
Stop/my risk management : Closing immediately if daily candle is closing ABOVE the box, max loss in my calculations in this case could be 50% of position.
Take profit strategy: selling about ~38cr (x10).
Of course I'll not wait until expiry...!
If you liked this article, check my other ideas.
Anyway: HIT THE LIKE BUTTON BELOW , and for fresh option ideas FOLLOW ME( @mrAnonymCrypto ) on tradingview !

A Closer Look at AMC's Tight RangeSymbol: NYSE:AMC
Indicators
Upper: Delta Volume
On Chart: ALMA x2
Lower: Laguerre RSI
Comments: I can't believe I'm going to say it... I don't know how but AMC is still showing bullish and could blow up a lot of added shorts at the top... What in the world am I even looking at even more.
Always stay on the right side of the trade.

LFMD - WAVE C CORRECTION - LOOKING FOR $11-$10 RANGE MAX All, if this breaks below I expect to see around $11-10 range would not get too greedy. Last financial quarter was a blockbuster/shift in the company.
Let me know your thoughts

LESLIE'S Puts and Sales Leslie's is a retail company who has recently been abused with an overload of puts and insider selling.
Insiders have sold an estimated $425840216 of shares with some key individuals such as the CEO selling 20% and 24% of his shares. Common theme is most insiders sold 20-24% of there holdings.
There as been decreases in calls and major increases in put options. Marketbeat states that Traders acquired 12,669 put options which is a 6500% increase.
The company has recently beaten some earnings forecasts such as its EPS and revenue.
Note. Leslies is currently in a channel between 50 day SMA and support level and the stock is dominated by Institutions ownership with very little retail ownership.
