NVDA NVIDIA Corporation Options Ahead of EarningsIn case you haven`t bought the dip:
Then you should know that looking at the NVDA NVIDIA Corporation options chain ahead of earnings , I would buy the $210 strike price Puts with
2023-7-21 expiration date for about
$24.25 premium.
If the options turn out to be profitable Before the earnings release, I would sell at least 50%.
I have chosen that expiration date to allow me to be wrong and not close the position and to have a bigger gain by the expiration date, if NVDA keeps going lower.
Looking forward to read your opinion about it.
Putoption

DKNG DraftKings Options Ahead of EarningsLooking at the DKNG DraftKings options chain ahead of earnings , I would buy the $17.5 strike price Calls with
2023-6-16 expiration date for about
$2.04 premium.
If the options turn out to be profitable Before the earnings release, I would sell at least 50%.
The longer expiration date will give me some room in case I'm wrong.
Looking forward to read your opinion about it.

AN AutoNation Options Ahead of EarningsI`m targeting a Double Bottom this year!
Looking at the AN AutoNation options chain ahead of earnings , I would buy the $95 strike price Puts with
2023-7-21 expiration date for about
$2.50 premium.
If the options turn out to be profitable Before the earnings release, I would sell at least 50%.
Looking forward to read your opinion about it.

VRM Vroom Options Ahead of EarningsLooking at the VRM Vroom options chain, i would buy the $1 strike price Calls with
2022-11-18 expiration date for about
$0.10 premium.
If the options turn out to be profitable Before the earnings release, i would sell at least 50%.
Looking forward to read your opinion about it.

PANW Palo Alto Networks Options Ahead of EarningsLooking at the PANW Palo Alto Networks options chain ahead of earnings , i would buy the $160 strike price in the money Calls with
2022-11-18 expiration date for about
$7.70 premium.
If the options turn out to be profitable Before the earnings release, i would sell at least 50%.
Looking forward to read your opinion about it.

Z Zillow Group Options Ahead of EarningsLooking at the Z Zillow Group options chain, i would buy the $17.5 strike price Puts with
2023-5-19 expiration date for about
$1.11 premium.
Looking forward to read your opinion about it.

THO Thor Industries Options Ahead Of EarningsLooking at the THO Thor Industries options chain, i would buy the $60 strike price Puts with
2023-3-17 expiration date for about
$5.70 premium.
Looking forward to read your opinion about it.

How do crypto options contracts affect the market?Hi Friends
Today we will explain the option contracts affect on crypto and other markets.
First lets see whats an option contract?
Options are derivative contracts that entitle the purchaser to buy or sell the connected asset at a predetermined price before the contract expires.
There are two types of options , call and put. The right to buy is known as a ‘call’ option, whereas the right to sell the underlying asset is called a ‘put’ option.
Every options contract comes with a specified expiry date which is the last date for settling the contract.
The price at which the options contract is settled is called the strike price .
This is the price at which the options contract owner is allowed to buy/sell the underlying cryptocurrency.
The price at which an options contract is bought is called the premium .
Now, when would you buy a cryptocurrency? Obviously when it is trading at a price that is lower than it should be,right?
This means that you find it to be undervalued and you expect its price to rise in the future so you can sell higher and make money.
But what if the crypto price fell instead? Wouldn’t it be nice if somebody would still buy the cryptocurrency from you at a higher price?
For that you would require selling rights of the cryptocurrency and you will buy a put option.
Now on the flip side when would you sell a cryptocurrency? Of course, when you think that it is trading at a price higher than it should be.
This means that you find it to be overvalued and expect it to fall from here.
But what if the price of the cryptocurrency rose instead?
You would then want to add more crypto at a lower price and sit on assets that are valued higher than your purchase price.
For this you would need buying rights or a call option.
Since options allow traders the right to buy/sell assets at a predetermined price they shield them from the volatility of the crypto markets.
Moreover the volume of the call or put options in the market signals the direction in which investors expect the markets to move.
More put options indicate that investors expect the markets to fall whereas more call options indicate that investors expect the market to rally.
Now when the option contracts are near their expiration date, large players try to drive the underlying crypto price into a favourable range depending on the option contracts they have purchased. This is done so that the deal can become profitable.
In summary:
Buying a Call (Long) = Bullish -----> you think the crypto will be worth more later so you want to lock in todays price to buy later at a profit.
Selling a Call (Short) = Bearish -----> you think the crypto will be worth less later so you want to lock in todays price to sell later at a profit.
Buying a Put (Short) = Bearish ------> you think the crypto will be worth less later so you want to lock in todays price to sell later at a profit.
Selling a Put (Long) = Bullish --------> you think the crypto will be worth more later so you want to lock in todays price to buy later at a profit.
I hope you enjoy this education please share me your opinions in comments.
thank you all specially @TradingView team

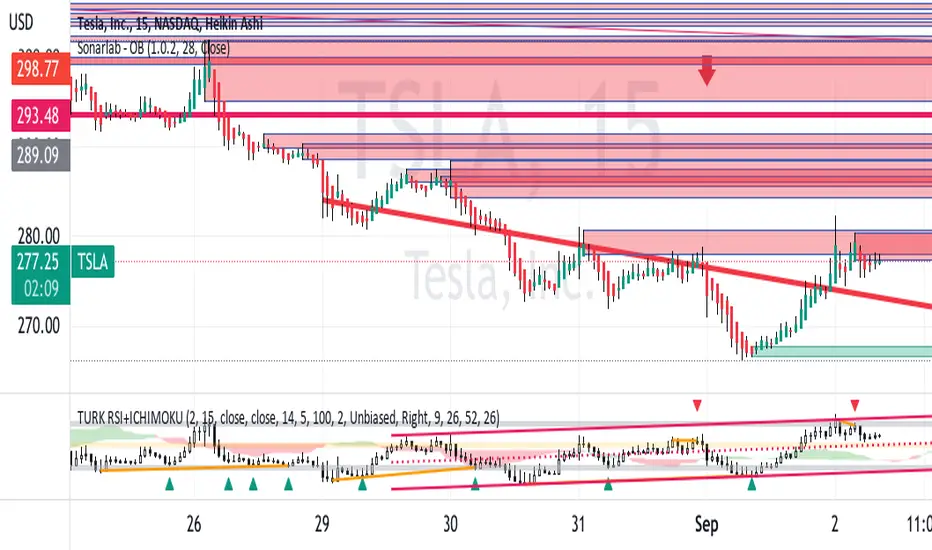
TSLA SHORTAs on the chart, TSLA is hitting heavy resistance and appears
to be setup to short. The whole China economic meltdown
and the NVDA issue with regard to China is weighing heavily.
Thus, TSLA has technical and fundamental headwinds.
Accordingly, this may be a good entry to short or get some
put options.
As an asidem the inverse ETF for TSLA, TSLQ is sitting
on horixontal support and looks ready to head upward
making it a low cost TLSA play.
CRWD CrowdStrike Holdings Options Ahead Of EarningsLooking at the CRWD CrowdStrike Holdings options chain, i would buy the $290 strike price Calls with
2023-3-17 expiration date for about
$7.56 premium.
Looking forward to read your opinion about it.

AMD Calls/Puts: Levels to watch this weekAMD
TLDR:
Calls above 151.84
SL @ 150.16
Scale out 153.29-156.25
Puts below 139.87
SL @ 141.37
Scale out 136.34 -130.53
Mon Jan 03 2022
Currently above its 12 and 26 EMA
Today it recaptured the 12 EMA
the 12 EMA just crossed over the 26 EMA
Currently Above its 20 MA
MACD strengthening
SO is not too hot: <80 and K% just crossed D%
Latest news:
Goldman Sachs analyst Toshiya Hari has a price target of 170(updated)
Samsung teases the Galaxy S22’s AMD GPU as renders leak: arstechnica.com
AMD CEO Teases Rembrandt 6nm APU Ahead of CES 2022 www.tomshardware.com
Options chain activity:
Mon Jan 03 2022
AMD open/close - $145.14 / $150.24 3.52%
Call VOL - 390,469
Put VOL - 168,670
Call VOL% - 69.83%
Call Prem % - 76.29%
Bullish Prem % - 58.24%
Put/Call Ratio - 0.43
AVG 30D PUT VOLUME
MON JAN 03 2022
190.6K
AVG 30D CALL VOLUME
MON JAN 03 2022
374.4K
TOTAL OI
MON JAN 03 2022
3.5M - Call
1.7M Put 1.8M
Highest OI Increase
Option Prev day Vol Prev day OI Curr OI Change
AMD 2022-1-21 C $125.00 5,163 14,194 18,906 4,712 (33.20%)
AMD 2022-1-7 C $150.00 17,449 8,140 11,159 3,019 (37.09%)
AMD 2022-1-14 C $160.00 3,581 2,433 4,884 2,451 (100.74%)
AMD 2022-1-7 C $144.00 3,442 456 2,731 2,275 (498.90%)
AMD 2022-1-7 C $170.00 3,401 4,280 6,521 2,241 (52.36%)
Most active chains
Chain Bid-Ask Low-High Volume OI
AMD 2022-01-07 C $150.00 $3.55-$3.65 $1.72-$4.48 49,396 11,159
AMD 2022-01-07 C $155.00 $1.83-$1.85 $0.82-$2.37 35,928 13,364
AMD 2022-01-07 C $152.50 $2.59-$2.62 $1.20-$3.30 25,857 6,158
AMD 2022-01-07 C $160.00 $0.87-$0.91 $0.42-$1.21 17,579 11,704
AMD 2022-01-21 C $155.00 $4.55-$4.65 $2.93-$5.40 13,710 35,837
AMD 2022-01-07 C $148.00 $4.55-$4.75 $2.31-$5.63 12,984 3,971
AMD 2022-01-21 C $175.00 $0.96-$0.99 $0.64-$1.23 12,244 17,862
AMD 2022-01-21 C $200.00 $0.19-$0.22 $0.15-$0.27 12,161 20,252
AMD 2022-01-07 P $145.00 $1.29-$1.33 $1.15-$3.18 12,051 5,219
AMD 2022-03-18 C $135.00 $22.20-$22.70 $19.45-$23.45 10,140 2,422
AMD 2022-01-07 C $157.50 $1.24-$1.30 $0.58-$1.70 9,205 4,431
AMD 2022-01-07 C $149.00 $4.05-$4.15 $2.01-$5.05 9,034 2,194
AMD 2022-01-21 C $165.00 $2.09-$2.15 $1.32-$2.56 9,013 23,327
AMD 2022-01-21 C $150.00 $6.60-$6.70 $4.40-$7.60 8,930 46,924
AMD 2022-01-07 P $150.00 $3.25-$3.40 $2.88-$6.10 8,795 3,513
Biggest option trades
Ticker Side Strike C/P Expiry Bid-Ask- Spot Size Prem OI Vol
AMD BUY 135 call 2022-03-18 $23.25 - $23.50, $23.45 10,000 $23.5M 2.4K 10K
AMD BUY 170 put 2022-03-18 $26.30 - $26.45, $26.40 468 $1.2M 913 503
AMD BUY 180 put 2022-02-18 $34.20 - $35.20, $34.76 325 $1.1M 701 325
AMD SELL 175 put 2022-02-18 $30.40 - $30.60, $30.46 325 $990K 1.6K 325
AMD SELL 175 call 2022-01-21 $1.06 - $1.09, $1.06 8,558 $907K 17.9K 10.6k

DKNG Neckline BreakDescription
DKNG appears to have made a break in the neckline as well as a back test, and I will be entering a starter Long Put position.
For the larger time frame, refer to the idea I published here:
Technical Indicators:
Break in the neckline
Death Cross on 29OCT
Neckline rejection today
Good volume on the breakout
Using Long Puts
Long Put
Levels on Chart
SL is set as a break and hold above the ascending neckline.
Our eventual price target, as measured by the height of the "head", has us retracing the entire move that was made in 2020.
For an intermediate target, we will go with the support set in August of 20.
*Stops based off underlying stock price, not mark to market loss
The Trade
BUY
11/26 42P
R/R & Break-evens vary on fill.
Manage Risk
Only invest what you are willing to lose

PUTS ON LOCK for #BABASo as we have seen this week with the delisthing of DIDI i would encourage any trader looking to jump into Chinese stocks to proceed with caution or tread water very carefully as this seems to be exactly what Winnie the XI wants at this point the best plays we can do to make money on CCP plays is PUTS or at least for me that is how i will be proceeding i know it's hard to resist trying to time the bottom of a play but no one likes being a bag holder or get cut by a falling knife either.

Bearish Gartley with Bearish Divergence on the BLOK ETFThis ETF holds a lot of crypto related stocks that i am not very optimistic on and it's at the PCZ of a Bearish Gartley i'd say it's perfect for buying some monthly EOY expiry puts on tomorrow.

TWTR Weekly Options PlayDescription
TWTR remains in extended downtrend that began in FEB of this year. Began broadening formation in August that ended in a breakout to the downside of both the broadening formation and the major trendline that began in MAR of 20'
Long Put
Levels on Chart
SL on a daily close over the lower trendline in the broadening formation. This can happen and a short is still valid, but due to the nature of options this position will be a close-out and search for new entry.
*Stops based off underlying stock price, not mark to market loss
The Trade
BUY
11/12 53P
R/R & Breakevens vary on fill.
Manage Risk
Only invest what you are willing to lose

HEAR - repeated pattern in the chartsSo i legit stubbled on this one i have done no research or dug into it but i noticed something that right away caught my attention first i was on Unusual Whales FLOW page and i noticed 309 THOUSAND dollars on 2 option trades one being an Opening Position trade and smaller secondary one ( go check it out if you have whales ) one was placed same day mins before the market closed the smaller one and the larger one was for 274K. Now after seeing that and pulling up the chart i right away noticed the pattern it is now is repeated ( a large spike in price action followed by consolidation before a dip in price ) the most recent time taking the price from 14 to 4. if you go back further in the chart you will see another example of this as well. I'll be watching the flow closely to see if i enter a PUT option to enjoy some of that run down as they seem to take time so maybe a Dec 17th experation @ the $22 strike seems to be interesting lol.

Huge Bearish Harami at a Shark PCZ if the Daily closes like thisNow may be a good time to buy some December puts near the $90 range.
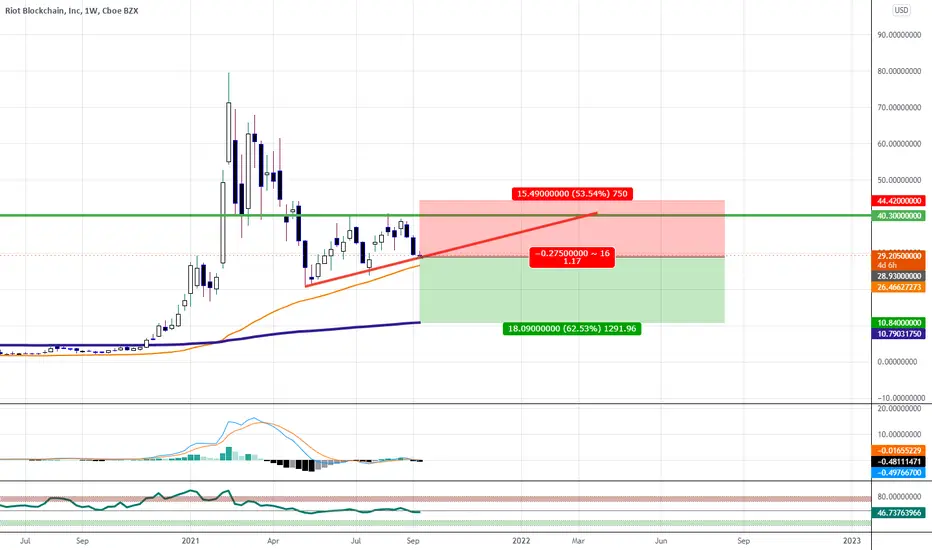
October and November OTM Put Options Looking Pretty Good HereI will be getting the monthly put options at strike 24 dollars from here in anticipation of a bearflag breakout as i think btc and riot will see the 200 week moving average again.
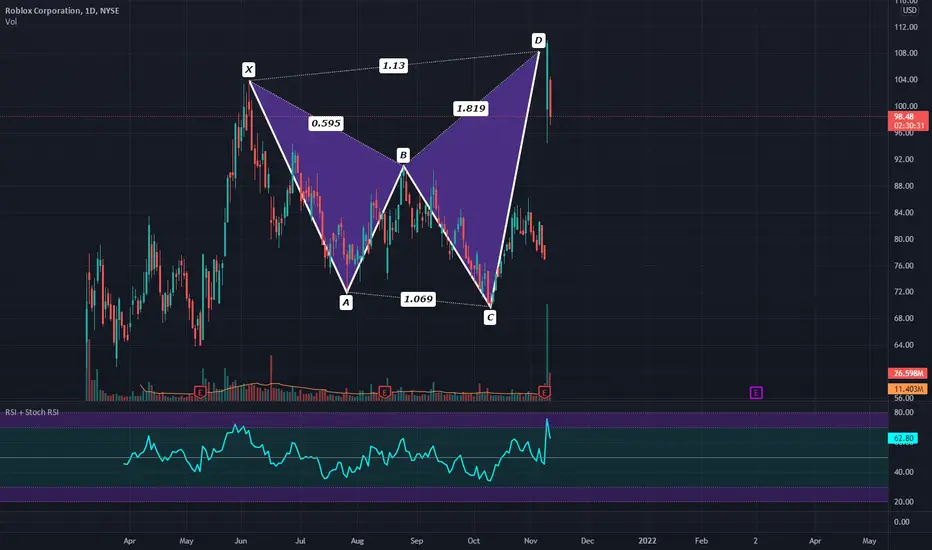
Potential Head and Shoulders Put Options PlayI originally entered this at the 88.6% Retrace with the thought that it could be a bullish bat with divergence and while it did pump 32 percent from the PCZ it did not come close to my normal Bat target yet. But while holding my position on this stock i noticed that the price action actually looked a little like a Head and Shoulders so i decided to take profit and buy some puts.
So the next step for us after entering these puts would be to wait and see if the macd crosses bearish again and invalidates our bullish divergence then we may see lower lows to fib extensions like the 1.618.
I would not recommend shorting this stock as that is dangerous but instead buying some puts that are a couple months from expiration would be the safer route.

Prepared for S&P500 correction with Buying PUT optionI've closed every other position, staying in cash and
playing for SPX correction because:
1/ SP500 RSI falling down
2/ Strong trendline broken
3/ Selling Volume increased
My strategy is simple:
BUY SPY Jun30' 415 PUT for 3.85db, because VIX is realive low
SIZING: only a little of my CAP is used for this binary play.
Stop/my risk management : Closing immediately if daily candle is closing ABOVE the box, max loss in my calculations in this case could be 50% of position.
Take profit strategy: selling about ~38cr (x10).
Of course I'll not wait until expiry...!
If you liked this article, check my other ideas.
Anyway: HIT THE LIKE BUTTON BELOW , and for fresh option ideas FOLLOW ME( @mrAnonymCrypto ) on tradingview !

AR put option using RSI, Support, And resistanceIf AR stays below $11.47 tomorrow at 10:30am EST I will be placing a put option
the price target is shown on the chart where it says take profits here.
please dont forget, I am not your financial advisor, nor am I a professional trader.
enjoy and lets print.
This is on the 1HR time frame

JNJ- POSSIBLE PUT OPTIONS - MAY 21ST 0.84 CONTRACTS $150All,
In semi recent news it's very possible JNJ loses the COVID contracts or at least long enough to take a solid tumble. IF it breaks into the red zone it should trigger a loss of a high and break trend downwards again to $145-$132 level. As always wait for conformation of breaking under first level and watch options volume/contracts for changes in price and news. JNJ in a prime spot to be shorted.
Also you can always cover with calls.

Bitcoin indecision candle The Doji Star has been printed on the CME daily close for the week, interesting fact when you look back on historical charts CME opened trading on BTC futures December 18th 2017 and the real downward pressure of Put options began.... have we reached the top or are we going to get a blow off top formation
