IWM trade update, and more swing putsIn my previous chart (linked) I gave notice of IWM breaking down from its range. The upper gray line marks the lowest close of the sideways range, and the lower line marks the dip last January. There is a lot of air underneath.
I took profits on the dip to 205 yesterday. Today I bought 18Feb puts again at the 208-209 resistance. Now looking at 198 break, then 193, 185.
fyi - My option swing trades usually last 1 day to 2 weeks. I only use long calls or puts, single leg.
Puts

PTON - levels to watch 1/10/22$PTON
Support 36.84
Resistance 30.25
Consider calls above 36.84 or late at 40.80
Consider Puts below 32.16
Lots of activity on the 40/50/60 calls in February
>50k, OTM only, <30 DTE = bullish flow

NKE in a downtrend and possibly going to the gap fillLooking at NKE and seeing all kinds of bearish signs for the short term. It is currently under its 200MA and 50 MA, also below the 12 and 26 EMA (DAILY CHART)
Bearish case (short term)
This one is simple: A break below $144 could give sellers the chance to fill the gap created back on June 24th 2021
Below $144 I can see $138 being a real possibility if not the full gap to $134.82. Puts below $144 could work and be considered.
Volume is light. Less shares traded on 1/18 than compared to average volume of 5,815,975 shares
NKE has the demand on its product, but supply chain issues make it where they cant meet that demand. Earnings in March will paint a bigger picture as far as revenue and EPS
Bullish outlook (long term)
That said, I am short term bearish but long term bullish: "Guggenheim's Robert Drbul dubbed the athletic-apparel retailer his "best idea" for 2022 in a December 31 note, saying Nike "is rapidly embarking on the next era of its company history," which he expects to be "digitally led." "Drbul maintained a buy rating and a price target of $195 on Nike stock, which was down 1.8% Monday after gaining 18% in 2021." "Insider reported previously that Nike has been pushing into the future internet, called both Web 3.0 and the metaverse. Its push has included video games, the creation of a metaverse studio, and even a promised line of digital sneakers called CryptoKicks." I really like their effort to step into a newer market and expand. Nike is a staple brand that is not going anywhere. At 145 this stock is underweight.

A Rare Sight for this Indicator on SPYMany times this indicator has signaled exceptional buying opportunities. However, a cross below can bring much pain to those unaware.
Is the market ready to finally roll over or are we going to see the FED back off? In my opinion, the latter is extremely unlikely.
AMEX:SPY

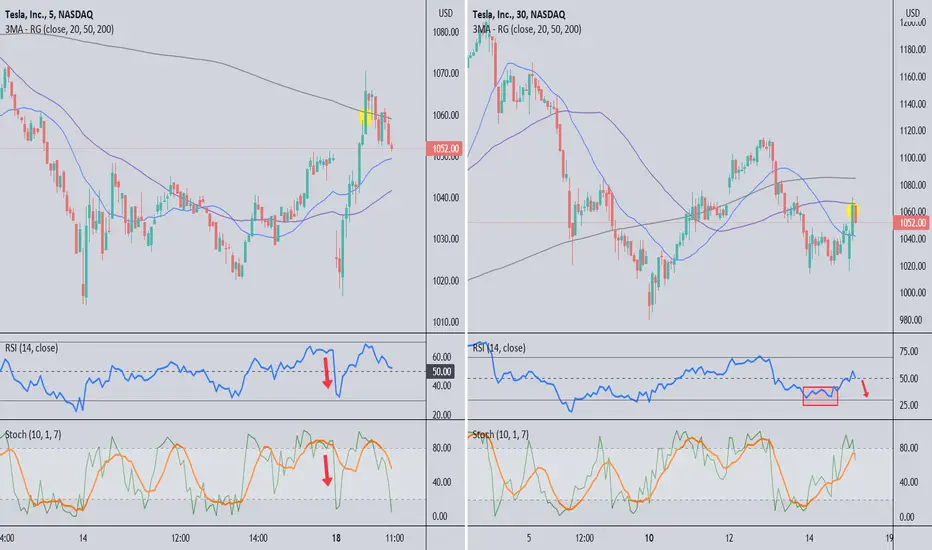
Example of put entry in a downtrendThis is another day trade made in context of the daily chart I posted recently (linked). TSLA daily chart is neutral but the markets are bearish, and so are the 5 and 30 minute TSLA charts, shown here. On the 30m chart, the 20MA is under the 50MA and 200MA. Red markers shows RSI and Stochastic gave bearish warnings and there resistance is around 1060 on both timeframes. This makes for a stronger trade setup.
The yellow circles mark put entry (where and when I bought puts). In this example I bought weekly 960 puts and did not expect price to push as high as 1068. However with only a few contracts I was willing to hold for a reversal, or I will take a loss. When volatile stocks like TSLA see rapid price movement the IV rises also, so my put prices did not drop too much.
As I publish this, price fought at resistance and looks like it may move lower. So I will give this a little more time and see if the trade starts working. If Nasdaq starts losing more then TSLA should start dropping with it.
Will rising rates cause this range to finally break down ?!This is an update to my previous chart, linked here.

Options day trade example. Swing trade entry.When the $DJI was up 200pts this afternoon, I was skeptical it could stay that high so I started looking at DIA. I also have a bearish bias right now on the markets. I prefer options on DIA vs SPY because SPY options are wilder and more volatile. People using gamma and delta strategies make it harder for "simple" long option traders like me. I only trade this index when I have a strong setup.
DIA was around 365 and I saw this as a resistance area. I bought weekly 364 puts for a day trade and as I started creating this chart the index dropped fast. I have exited most of my puts and will close the rest today.
In general, you should have a consistent set of indicators/signs that you use with success. Then you can spot a good setup quickly. The charts show you what I saw. I am leaning bearish on the daily chart, and RSI supports my idea (reversal under 65 after dip below 33.33).
Daily stochastic gave a warning sign (red arrow), so after the strong reversal rally I am looking for price to move below the channel, back to 355. If you use 365 for a swing trade entry and the index continues up to the top of the channel, the stop losses would be between 365.20 and 366, so this is a low-risk options trade.
For today's trade I used the 30m and 5m charts. Many traders (me too) get stuck watching price action and forget to sell at identified targets. 362.80-362.50 was my range to exit puts, and I held some for more downside or to exit green before end of day.
*** As I post this, 363.50 is also a good swing put entry on 30m chart, but I would use a smaller position and hold through price swings.

Example of strong trade setup using multiple timeframesThis is as good as it gets when it comes to a high probability trade setup with low risk. FB is one of my "basket stocks" that I watch regularly for good option trades. Using the daily and 30min charts, there was strong reason to buy puts today.
This was a nice day trade if you use the 30m chart (with 5m) and take profits as price comes down from 334 to lower moving averages. Note that price came down to 50ma and bounced. So you set your exit to OCO - either at stop loss or at target price. RSI supported the bearish outlook because it dipped below 33.33 and as price bounced RSI stalled under 66.66. Usually 65 is a bear resistance unless there is a sharp rally or higher volatility.
On the daily chart, today's open provided a low-risk entry for swing puts. If you miss the setup near open, there is another entry as price bounces from the first drop. Yesterday RSI moved up to test 50 as price went up. So swing puts will give you time for this price to turn down below 330 again, and RSI should close be lower today or tomorrow.

Buying puts at price against 20sma, very low riskHigh price near open was right at 20sma. So puts bought near 219 will have close stops. Suggestions are 219.21, 219.39, and 219.51. I am using 21Jan and 18Feb expiry dates.

$COIN: Bearish ABCD BAMM Triggered From the looks of it Coinbase may be getting ready to make a reciprocal ABCD movement downward as it's threatening to break through the B level and beginning to enter a CD leg that would take us down to the 1.414 Fibonacci Extension.
In an effort to trade this movement I will be buying 7 of the (18 FEB 22 $200 PUTS) that are currently trading at a premium of $8.70 a piece.

SPY-day trade for 1/12/2002I have mentioned SPY trades. I don't analyze future ,I play accordingly. I can play both sides but just letting you know I see a lot of resistances on the the up side. If you are in a call exit where I have mentioned and If your a Bear tomorrow exit at PT 1. I am still bearish as a lot of resistances on upside and a lot of reward for bears. Do your DD.
"A quality of a day trader is to trade on both sides".

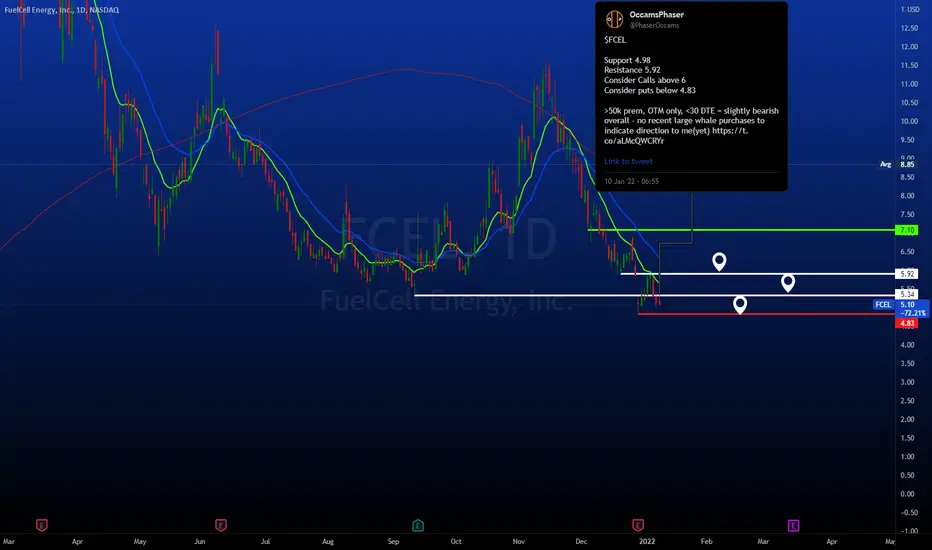
FCEL - levels to watch 1/10/22$FCEL
Support 4.98
Resistance 5.92
Consider Calls above 6
Consider puts below 4.83
>50k prem, OTM only, <30 DTE = slightly bearish overall - no recent large whale purchases to indicate direction to me(yet)
Ford - levels to consider 1/10/22$F
Support 24.06
Resistance 24.95
Consider Calls above 24.95
Consider Puts below 23.66
After 2 months of consolidation between 19-21 Ford has recently broke out to levels not seen for 20 years. Can't find a bad article on $F right now. Although Im bullish, consider a pullback

NVDA - levels to watch 1/10/22 $NVDA
Support 271.45
Resistance 284
Consider calls above 278
Consider puts below 269.5
Dark Pool activity up as of recent.
P/C RATIO on 1/7/2022 - 0.86
Bullish premium and bullish volume on 1/07/22 with <30 DTE and >50k, OTM only

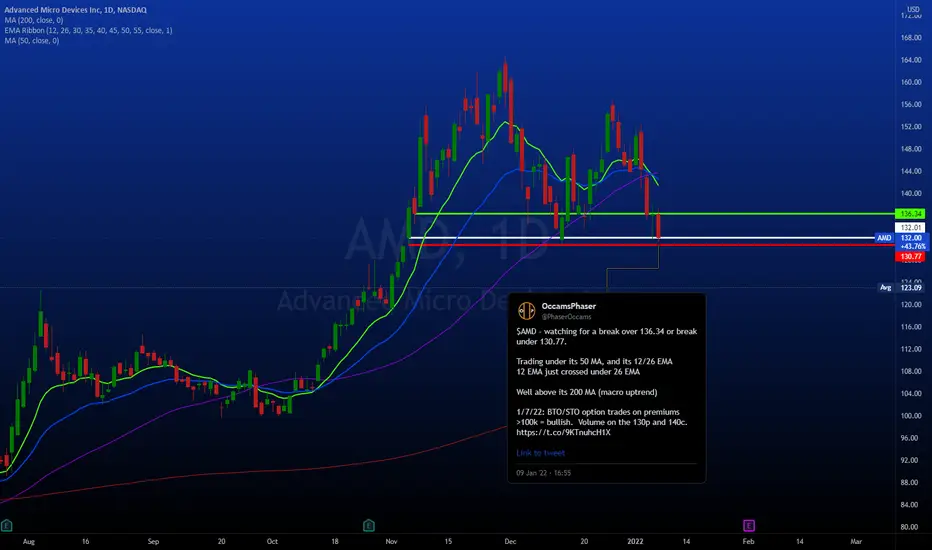
AMD - levels to watch 1/10/22$AMD - watching for a break over 136.34 or break under 130.77.
Trading under its 50 MA, and its 12/26 EMA
12 EMA just crossed under 26 EMA
Well above its 200 MA (macro uptrend)
1/7/22: BTO/STO option trades on premiums >100k = bullish. Volume on the 130p and 140c.

Zillow - levels to watch NASDAQ:Z
Support 58.28
Resistance 65.61
Consider Calls above 66
Consider Puts below 56.63

AMD levels to watch going in to 1/10/22NASDAQ:AMD
$AMD - watching for a break over 136.34 or break under 130.77.
Trading under its 50 MA, and its 12/26 EMA
12 EMA just crossed under 26 EMA
Well above its 200 MA (macro uptrend)
1/7/22: BTO/STO option trades on premiums >100k = bullish. Volume on the 130p and 140c.
Lots of OI on the 150c\1 35p - watch for changes in these
Local support at 132.01 - created on Nov 4, tested on Dec 14, confirmed on Jan 7
AMD closed on 1/7 at 132.00
If AMD breaks below 130.77 = consider bearish trades
If AMD breaks above 136.34 = consider bullish trades

Z calls and puts: levels to look out for & considerZ
Price - 63.44
Support - 58.28
Resistance - 65.61
Consider***
Calls Above - 70.09
Puts Below - 56.63

$WMT Bearish FOMC Setup 1/6/2022$WMT had a parabolic run up on 1/4/2022 with little to no consolidation. Elevator up means elevator down. It is also about to break back into the triangle trend it was forming. Also Dec 16-17 $WMT fell almost $8 and can also be considered a gap fill for $WMT coming back into trend, as shown by the green boxes. This play is puts under 143.60 (risky) or 143.00 (safe) for confirmation of downtrend break. Sell would be when $WMT touches support lines with only runners after that. $SPY confirmation is encouraged but not necessary because $WMT tends to move on its own.

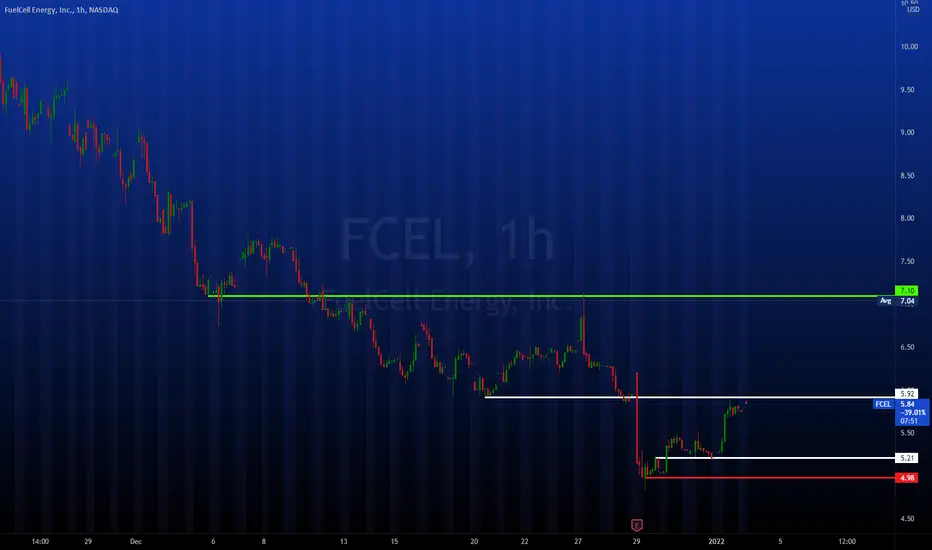
FCEL calls and puts: levels to look for and considerFCEL
Price - 5.78
Support - 5.21
Resistance - 5.92
Consider***
Calls above - 7.1
Puts below - 4.98
TSM calls and puts: levels to look out for and consider TSM
Price - 128.8
Support - 117.59
Resistance - 131.83
Consider***
Calls above - 135.4
Puts below - 124.01

NVDA calls and puts: Levels to look out for and considerNASDAQ:NVDA
Price - 301.21
Support - 294.54
Resistance - 300.08
Consider***
Calls above- 306
Puts below - 288.14
