BAC short positionBAC has one of the best options change and a go to for contracts for me. Were in a confirmed short term bearish trend. Broke below 34 day ema on friday. This might get back to our demand "zone" below with possible stall or bounce from 13d ema. Another one to watch with SPY.
Puts

TGT shorts could pay offTarget had big earnings boost with big gap up play. RSI getting way over extended, and its pulled away from the EMA's a good deal. I like this as a short position as well. Also looking for entry confirmation off 30m chart for a short swing as well as walmart. Keep on eye on what SPY is doing for these two.

Gold holding Trend. Up then down againGC still holding the trendline pretty well with a "zone" to match. Could be an easy entry. Loking for this to rise maybe overnight up into the trendline/zone with a drop to follow. Could see good prices on PUTs if this happens and catch it off the rise. Any positions held nust be patient. Trend is your friend "until the end"

Apple to fall despite tuesday release?Apple jumped into a "zone" last week. Last two times we seen a pretty good drop from this area. We also have a "gap fill" possibility below. I like bearish positions on this with break out the bottom of the zone, played back to the EMAs and possible further. With NQ looking bearish just adds a bit more confirmation.


BA 350 Oct 18 2019 Puts30 Week MA is heading downwards with a declining trendline after a H&S formation.

Short the $HYG Rejected Top of Previous Support Now (Resistance)Rejected past support now serving as new resistance level two days ago. See below. Do not trade based on my opinion. I am short HYG with puts.

Put Spread NVDANVDA seems to be sinking slowly and its new earnings could be a flop, or I might be wrong but lets take a gamble on this.
$645 USD max loss.
145/120 Max gain is if earnings are a flop. We'll see the news has been pretty bearish entirely if they don't hit a home run it'll flop.
AMD has been running it good, and I don't think RTX has been a big hit.

Spy put playShorting trumps Powell jebait
Trump is upping the anti on China and Powell
By increasing tariffs on the remaining 10% goods trump is putting more pressure on the market and powell. He was looking for a bigger rate cut and didn't happen however now that he is set to tariff china we'll see how this plays out.
5 spy puts exp September 20
$4 each max loss is 200
296/280

Put Spread XLNXPut Spread $4.16 entry max loss is $3.12
Max gain is the spread which is 15 points
120/105 Put Spread Expiring September 20th
Target is $105 which is close to support.
ER sell off its going to inhibit some price movement.
I may take a gain at $6 - 8 depending on the trend
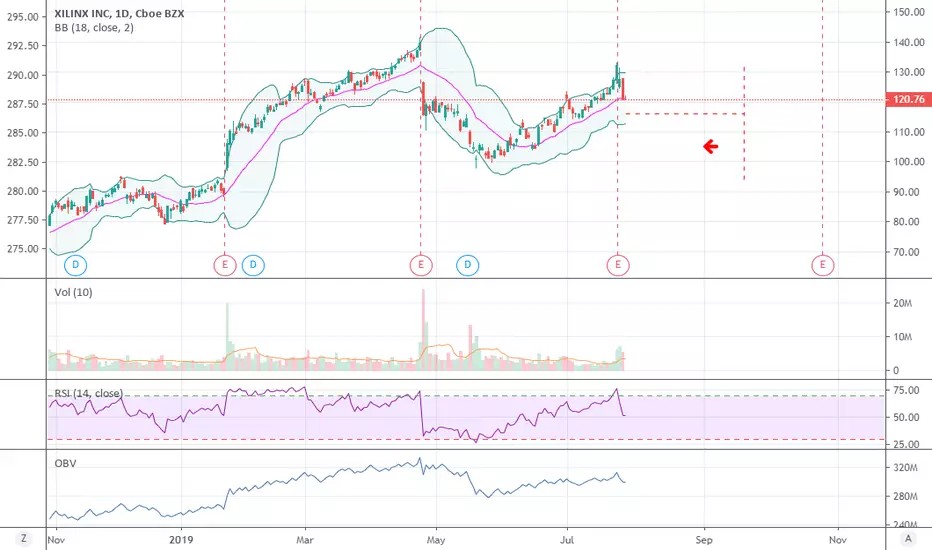
Going Short on XLNX Ahead of Earnings
Texas Instruments comes out after close today. I'm playing XLNX puts since it will react based on commentary of Texas Instruments tonight. Small Put position. Good luck.

Short IBM Overhead resistance $151 back to $144IBM - In my opinion this doesn't have the fire power to stay above the fibonacci level $148 or break the $151 trend resistance level. Should pull back to $144-$145.

SHOP Short SHOP - Shopify has become a little ridiculous. Pick your spots where it seems overly exuberant like yesterday. I purchased put options. Good luck.

Five9 Sales Execs Leaving in Droves, Will Miss Next Earnings?Yesterday the stock fell because the company's EVP of Global Sales left the company. This follows 5-6 (yes 5 to 6!) other senior enterprise sales executives and that have left in the last six months.
No company loses this many sales executives and hits their numbers. I anticipate that Five9 is going to miss next earnings pretty badly. Next earnings are on July 31st (in 14 days)

Adobe touching the top of the channel. I'm initiating PutSpreadADBE
Touching the top of my channel, on low volume. Move today isn't valid IMO. Opened short term putspread.

$BYND Bottom to Fall Out This Summer - Fad = FadeNASDAQ:BYND
Broke $152 on Friday - likely headed down to $120-$115 level and then next level will likely be $95. I currently own puts in this name.
A little summer projection for the beyond meat craze. "Hexane" carcinogen news will likely only gain traction in the media surrounding the fake meat industry with controversy, leading to shorts to pick up speed and longs to begin to doubt the recent optimism surrounding. Fad = Fade
Russel re-balance at the end of the month that will be including BYND will likely push this down further prior to insure the stability of the index in my opinion.

SHOP - Mean Reversion in Short Order?Monthly looking parabolic. Check out the last two candles on the daily. Shooting star indicates possible trend reversal.

How to Trade the Uber slump, with a hedge in case it rallies NYSE:UBER Technically speaking UBER has been trading with a more positive than negative bias since its inception.
There are many risks for this company going forward and for that reason we would like to explore options trades that benefit in prices dropping. (or even rising)
I have designed this trade to benefit more from a plunge (40% or more) in UBER's underlying stock through the use of options.
There is one segment on the right side of the chart that shows a hypothetical gain if uber should drop roughly 41% from its IPO open price.
The strike prices are laid out in terms of other long put option targets as well as their intended time frame.
For the sake of this exercise we won't be quoting the exact figure because the fast changes in the options premiums, but if all of the targets are hit before or around the time of its earnings call we could see appreciation in the underlying option from 100 - 300% (estimation)
Granted this trade is slightly neutral because we are paying for any loss in the call options value if the stock does drop but what we suggest is pyramiding the position where more put options are accumulated as time passes and the earnings date approaches..
The put dates are set for July, August and September where we are getting long puts for these periods in weighted sizes:
We would keep buying 10 puts , 7 puts , 5 puts , 2 puts , 1 put at these strike prices : 40, 35, 30, 25 and when the strike prices are hit we would roll forward the put options into lower strikes with a heavier quantity- if successful a portion of the 10 puts at the 40 strike price would be liquidated and a remainder would be rolled into 35 and 30 strike prices for the following month thereby synthetically being short 1000 shares of UBER .... the more momentum in the decline would results in a greater velocity of leverage we'd have on the position (A MUCH BIGGER SHORT)
Profiting along the way
When such huge drops occur it leads to a lot of competition among buyers, and our concern is that there will be institutions buying up UBER along the way down and for that reason when the goals are met (40, 37, 35) we would cautiously liquidate those puts just to raise cash and protect the overall short position
So that being said if there are any comments about why the stock should go up we would like to continue writing about this as it progresses, there are still another 2-3 months for the plan to work, and even though this is a bearish trade we would still be open to protecting against all losses, and even ride the stock to maybe even a $100 valuation in the future.
It is early to tell, but from what I have heard, the company is not growing and they have been losing money for 9 years, any price shock would put pressure on management to change vital aspects of the business model and improve performance...
best,
Damian Richardson

A Short-Side Maxar Options PlaySince TradingView made it so you can't remove posts, my first (test) post will unfortunately remain, but since it's actually getting a few views (in all its glorious mediocrity) I figured I would at least share the full trade.
On May 23rd, NASA announced its selection of Maxar for the construction of the first part of their upcoming Lunar Gateway, slated to support future manned missions to the moon in 2024. Maxar has been struggling for a while for a number of reasons, including a slump in geostationary satellite sales affecting revenue among other factors including negative analyst ratings stemming from over-leveraging including debt rating of B1/B, ‘sub-investment grade’ from the ratings agencies. On another note, insiders only own 1.2% of outstanding shares. Doesn't show a lot of confidence, at least in terms of expectations for stock value. Share prices have reflected this ongoing difficulty (glance at a long term chart and it's extremely apparent what I'm talking about), and this news about the Lunar Gateway project, announced both through Maxar's investor relations page as well as being mentioned in a YouTube video announcement on NASA's channel, was seen as a much needed positive signal for the company, and became a catalyst for a move to the upside. Due to Maxar's being small-cap as well as their low share price I also suspect that retail intraday traders saw this catalyst as a potential to make a quick trade, further propelling the stock to the upside, reaching around 20% at its peak.
Throughout the day I will often scan for the biggest movers throughout any given trading day to look for potential options plays, and I will often take the cynical side and enter put positions on companies that have risen sharply on minimal information despite an obvious bearish trend long term. Maxar met my criteria, and after analyzing MAXR's past movements and long term decline I came to the conclusion that this 20% was far from sustainable as the movement was based on little more than an announcement and success was far from guaranteed in this new venture (even though I as much as anyone would like to see this Lunar Gateway happen in the very near future). I entered into a Put position 2 minutes before EOD on the 23rd of May, starting with in-the-money contracts with a $10 strike price (for risk management reasons), and with a much longer timeframe than many of my trades (in this case, Expiry of July 19th) because I wanted to allocate some extra time to let this play out, knowing that MAXR wouldn't be dropping 20% the next day, that I would likely be waiting for negative PR relating to the Lunar Gateway venture for a more significant gain, and that the bagholders from trading would take a bit of time to come to the conclusion that ultimately they would have to sell, take the loss and move on. Since I entered my position the share price has, on average, continued to fall - and is still dropping as I write this.
To conclude, let me share a paragraph from Rich Smith writing for The Motley Fool that I think sums up my sentiment on MAXR - "I personally would love to see the company succeed on its Lunar Gateway project -- and rethink the satellite servicing contract, too! But with $3.3 billion in net debt on its books, and no free cash flow coming in to service that debt, I don't see Maxar's problems as over just yet, and even this week's positive NASA news may be too little, too late to save the company."
Thanks for reading, please like the post if you enjoyed it and give a follow if you'd like to see more of my options trades explained in the future.

Going Short SHOP This one has had a good run. It looks like it has rolled over. I have my money on a pullback to $253-$255 (20 Day SMA) level at the very least.
Happy hunting. SHOP

GOOGL lotto puts for 5/17NASDAQ:GOOGL had a nice past couple of days and it should be due for a drop tomorrow if we have a red market day

Sell ECA NowECA keeps getting a new support level lower and lower each time, since it never breaks the resistance level we can determine that ECA will keep going down in the long run. May be try buying some puts?

ROKU Short Opportunity to $73 and Below?Roku peaked this morning at $86 and fizzled throughout the morning. I'm seeing a potential Shooting Star Bearish reversal formation. I believe we continue to drop back down today and next week close or to the $70 level, potentially to bounce off of the $73 fibonacci level. ROKU
