PayPal (PYPL) | Possible Short-term Rejection AreaHi,
Why short-term? Yes, after you have made your analysis, you can start loading your long-term positions also from the shown area but to me, it looks like it stays there for a while. Despite that, possibly we can catch the first movements upwards.
Atm my scenario would be: bounce from the shown area to around +20 to +50% then back to around $100. For me, it isn't very logical that if we get a bounce then it would be the bottom. After such a huge slump the price needs to rest a bit but still, I would like to share this area for short-term investors.
Do your own analysis and invest cautiously!
Regards,
Vaido
PYPL

PYPL LONG STOCK ENTRY SOON...PYPL has had a significant decline from its highs last summer. The weekly RSI is in the teens. I believe we touch 108-112 for a great initial entry & then a possible retest of 100 for an average down opportunity. However, beware we do have a gap to fill from COVID levels. Careful as this is much lower, but as long as 100 holds, we should be okay!

PAYPAL CORRECTION 2022Keeping the analysis that the correction of the companies had to come back to the original value (channel 2018-2019)
Here is PAYPAL CORRECTION

PayPal outlook starts to flag!PayPal - Short Term - We look to Sell a break of 179.11 (stop at 201.11)
Posted a bearish Flag formation. A break of 180.00 is needed to confirm the outlook. Closed below the 20-day EMA. There is no indication that the selloff is coming to an end. This move is expected to continue and we look to set shorts at good risk/reward levels.
Our profit targets will be 129.11 and 118.00
Resistance: 190.00 / 200.00 / 225.00
Support: 180.00 / 150.00 / 130.00
Disclaimer – Saxo Bank Group. Please be reminded – you alone are responsible for your trading – both gains and losses. There is a very high degree of risk involved in trading. The technical analysis, like any and all indicators, strategies, columns, articles and other features accessible on/though this site (including those from Signal Centre) are for informational purposes only and should not be construed as investment advice by you. Such technical analysis are believed to be obtained from sources believed to be reliable, but not warrant their respective completeness or accuracy, or warrant any results from the use of the information. Your use of the technical analysis, as would also your use of any and all mentioned indicators, strategies, columns, articles and all other features, is entirely at your own risk and it is your sole responsibility to evaluate the accuracy, completeness and usefulness (including suitability) of the information. You should assess the risk of any trade with your financial adviser and make your own independent decision(s) regarding any tradable products which may be the subject matter of the technical analysis or any of the said indicators, strategies, columns, articles and all other features.
Please also be reminded that if despite the above, any of the said technical analysis (or any of the said indicators, strategies, columns, articles and other features accessible on/through this site) is found to be advisory or a recommendation; and not merely informational in nature, the same is in any event provided with the intention of being for general circulation and availability only. As such it is not intended to and does not form part of any offer or recommendation directed at you specifically, or have any regard to the investment objectives, financial situation or needs of yourself or any other specific person. Before committing to a trade or investment therefore, please seek advice from a financial or other professional adviser regarding the suitability of the product for you and (where available) read the relevant product offer/description documents, including the risk disclosures. If you do not wish to seek such financial advice, please still exercise your mind and consider carefully whether the product is suitable for you because you alone remain responsible for your trading – both gains and losses.


$PINS buy the dip and wait for a buyout*This is not financial advice, so trade at your own risks*
*My team digs deep and finds stocks that are expected to perform well based off multiple confluences*
*Experienced traders understand the uphill battle in timing the market, so instead my team focuses mainly on risk management*
Popular online product and idea discovery platform Pinterest $PINS has seen better days. After correcting from its 2021 all-time-high of $89.90 the share price now sits at $24.55.
The company derives the majority of its revenue from selling digital ads. My teams main concern is new user growth. This could potentially scare away more investors if these numbers haven't shown much improvement in Q4. $PINS uses 1st party data to target its audience, which is substantially better than Meta Platforms $FB third party data system. If $PINS can prove that its system still works in face of new emerging marketing trends, then it could potentially be bought out by another company if they are willing to sell.
Multinational online payment company PayPal $PYPL recently dropped in share price following their Q4 earnings from a decrease in lower income customers due to the inflation surge. $PYPL was previously sought to buyout $PINS in the past. The opportunity was lost, but this digital finance company may just actually go through with it in order to revive itself to its previous lost glory.
$FB is also in deep red this morning following an earnings plunge, and because of its large market capitalization the market is being temporarily dragged down with it. Despite the noise my team has taken this golden opportunity and entered $PINS this morning at $24.55 per share. Our stop loss is reasonably set at $22. There is no take profit currently in sight.
Earnings are expected to be released today 2/3/2022 after the market closes.
OUR ENTRY: $24.55
STOP LOSS: $22
If you want to see more, please like and follow us @SimplyShowMeTheMoney

Paypal Analysis 07.02.2022Hello Traders,
welcome to this free and educational analysis.
I am going to explain where I think this asset is going to go over the next few days and weeks and where I would look for trading opportunities.
If you have any questions or suggestions which asset I should analyse tomorrow, please leave a comment below.
I will personally reply to every single comment!
If you enjoyed this analysis, I would definitely appreciate it, if you smash that like button and maybe consider following my channel.
Thank you for watching and I will see you tomorrow!

PayPal - 58% Gains To ComeTwice Paypal tested the $309-310 region which was rejected with support around the $190-210 level (also the .382 fib retracement level), then at and around the $180 (also the .236 fib ret. level),
There is a larger descending wedge that had formed and the price has broken through the bottom trendline of the wedge and landed at the bottom of the fib retracement level subsequently a support line from previous trading activity.
I feel that this support line will be tested, held and price will extend back to the .236 Fib level, subsequently the bottom of the larger wedge. Providing a 33% Gain at the current level. This can be supported by the fact the stock is currently oversold.
Provided this holds and the resistance level is broken a surge to the top of the wedge will be tested again, subsequently, it also falls in line with the .382 fib level. This target will provide a 58% overall gain.
From here, pricing will bounce within the wedge to complete the pattern.
Could be a choppy but very lucrative opportunity to capitalise on a number of aligning patterns/indicators especially given its oversold territory.
Conversely, if the above is not true then we'll look for a drop to $100.
Upsize significantly outweighs downside in my opinion. 10% drop to potential 58% gain.
Love to hear your thoughts
N.B This is not investment advice and is my personal view and interpretation of the data with a view to provide my ideas and understanding of the patterns and tools for an open forum to have others provide their input and or knoweldge or alternative views to further enhance my understanding, interpretation and skills.

PYPL - Oversold - PT: $160RSI indicator showing that PYPL is oversold on the 1H chart.
We see a bounce to $160 before making another small correction.
Long term price will recover to $220, this year.

PAYPAL - Discount too good to pass up on EarningI am Willing to take chances on Good Discounts. Anybody else take the Bait?

PYPLSelling 2x units 11FEB22 120-130 area puts and buying x units 11FEB22 140-150 area calls. Will add to both sides on 123 fill (if it comes), but quickly cut if clean break lower. Otherwise, looking for it to levitate above 130 and possibly for near term 150+ print.

Paypal full cycle
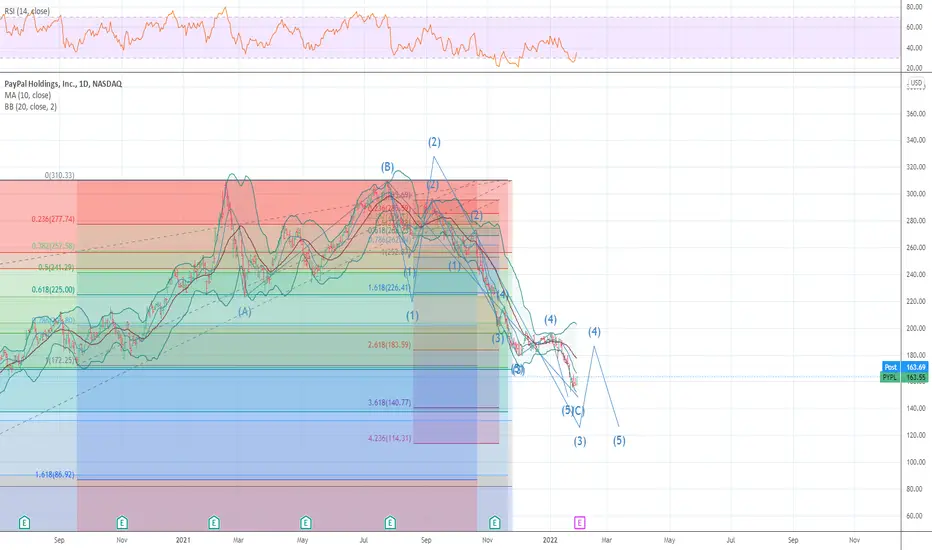
PYPL - Elliott Wave Analysis
From the first day of listing we see a 5 waves up, an impulsive wave up, with something very interesting: Wave 5 is almost a truncation or failure. Which it meant that the fallowing correction will be very dramatic.
That is exactly what it happened.
From the top of wave 5 $309 price we see a big drop the unfolding correction. So far we had wave A subdivided in 5 waves as in the graphic above, Wave B corrective subdivided in a-b-c-d-e traveling sideways.
I see Wave C unfolding in 5 waves down. With the bottom in the region of $68-$83 supported by the guideline of equality between waves A and C and the previous support held by the price.
Disclaimer: This is my analysis and does not constitute financial advice.
If you want more stock analysis like this please send me a message.

HUGE Long-Term BUYING opportunity on PayPal #PYPLWe've just opened a LONG #PYPL (PayPal Holdings) position using 2.50% of our equity as we believe that the current post-earnings sell-off is quite overdone at these levels.
The stock is down over 58% from its all-time highs of $310 that it reached mid-summer last year. Our view is that while there are definitely issues related to the future growth trajectory of the company that investors are rightfully worried about, the current price action is pricing in the worst possible scenario for the company moving forward, which in our opinion has a very low probability of actually materializing. Furthermore, the weak forward guidance and the severely lowered investor expectations will make it that much easier for the company to beat its own forecasts in the coming months, considering its leadership position in its sector, thus surprising the street positively. This will then cause a chain reaction of positive analyst upgrades and price target revisions. Yes, this whole process might take some time to materialize, but if you are looking for a solid growth stock with a remarkable long-term potential to double your money, then #PYPL is a screaming buy anywhere around the $125-130 range.
There is no question about the fact that the miss on the bottom line (EPS) in the most recent earnings report together with the poor forward guidance that the management gave on the earnings call after have been the major drivers for the vicious sell-off that we are seeing today.
For 2022, management expects net revenue to increase about 15% to 17% (19% to 21% ex-eBay), and that’s below the roughly 18% analysts were forecasting. The earnings outlook wasn’t any better, with management forecasting adjusted earnings of $4.60 to $4.75, well below analyst estimates of $5.21.
On the new users front, PayPal expects to add about 15 million to 20 million net new active accounts this year, and analysts were forecasting growth of about 55 million. This was definitely one of the most disappointing components of the report.
However, we believe that the down-beat forward guidance given by the company is hugely blown out of proportions and it seems that investors have been very quick to forget that #PYPL is the leader in the digital payments space and could technically be considered as the largest digital bank in the world with over 300 million clients. Our analysis shows that the eBay transition that the company has been going through has definitely weighted on its financial performance. However, we are in the final stages of it and it will be over and done with by the second half of the year.
What investors need to focus on is the fact that the company’s growth rates excluding eBay have remained above 20%. In addition to that the #AMZN (Amazon) partnership with Venmo hasn’t even started yet, and PayPal is free to explore many new partnerships now that it is no longer constrained by its relationship with #EBAY (eBay) . Also, operating expenditure growth is also expected to moderate down the road, allowing management to flex the leverage in the business model and help expand margins.
Apart from adding the stock to our long-term corporate investment portfolio here, we've also opened few long-term CALL options on $PYPL, which we expect to substantially boost our portfolio returns in 2022.
Follow and copy us for more detailed market analyses, profitable trading ideas and a consistent portfolio performance.
Sincerely,
@DowExperts

PYPL PayPal: 1D Chart ReviewHello friends, today you can review the technical analysis idea on a 1D linear scale chart for PayPal Holdings, Inc. (PYPL).
The chart is self-explanatory. Price dropped significantly and has the possibility for a retracement back up with the RSI in the oversold region. If price drops further, there is a strong support region below. Keep an eye on the 0.618 Fibonacci Retracement area if price moves back up.
Included in the chart: Trend line, Support and Resistance Lines, RSI, MFI, Double Top Pattern, Descending Broadening Wedge, Fibonacci Retracement, Death Cross, Simple Moving Average, Volume.
If you enjoy my ideas, feel free to like it and drop in a comment. I love reading your comments below.
I have additional charts below on cryptocurrencies, stocks and more to review. Check them out!
Disclosure: This is just my opinion and not any type of financial advice. I enjoy charting and discussing technical analysis . Don't trade based on my advice. Do your own research! #cryptopickk

Interpreting the PYPL fallPYPL has fallen ~25%, this provides a great dip buy opportunity. It is barely a dip but a pullback to a major trendline.
The falls can be attributed to each moving average, the first the 50MA (in green), the second the 100MA (in orange), and the third and current, the 200MA (in red)
Great buy

PayPal (NASDAQ: $PYPL) Just Closed Gap @ 0.786 Fib! 💯PayPal Holdings, Inc. operates as a technology platform and digital payments company that enables digital and mobile payments on behalf of consumers and merchants worldwide. Its payment solutions include PayPal, PayPal Credit, Braintree, Venmo, Xoom, Hyperwallet, and iZettle products. The company's payments platform allows consumers to send and receive payments, withdraw funds to their bank accounts, and hold balances in their PayPal accounts in various currencies. It also offers gateway services that enable merchants to accept payments online with credit or debit cards, as well as digital wallets. PayPal Holdings, Inc. was founded in 1998 and is headquartered in San Jose, California.

Possible support areas for PYPLIf 146 doesn't hold, support at 136, 121, 110. Can short under these levels and also look to scalp a potential bounce.

PYPL ARK Invest sold PYPL ahead of EarningsYesterday Ark Invest sold more than 23K shares of PYPL just before the upcoming earnings this week.
Most likely today will do the same, since they tend to continue a buy or a sell trend.
The options are slightly bearish too, with more puts than buys recently.
PayPal (PYPL) is expected to earn $1.12 a share on sales of $6.89 billion.
With the rise of so many payment companies with low fees, and also banks who want to keep up with the new fintech, i wonder how PayPal can still have such a high PE Ratio (TTM) of 41.34!
My day to day experience with PayPal as a merchant makes me consider it an extremely expensive way of payment compared to others.
Considering the chart, fundamentals and current market conditions, my price target is $124.
Looking forward to read your opinion about it.

PYPL HIT THE TARGET 154 I AM LONGWave structure looks to have ended its multi month decline now and I look for a rally back to last support 177/174 if we break above 178 then a run near 190,s
PYPL - Good levels for Bounce to 200+Within our buybox now between 144-154. Nice setup for a wave 4 bounce into 200's before next leg down. Stop loss 133

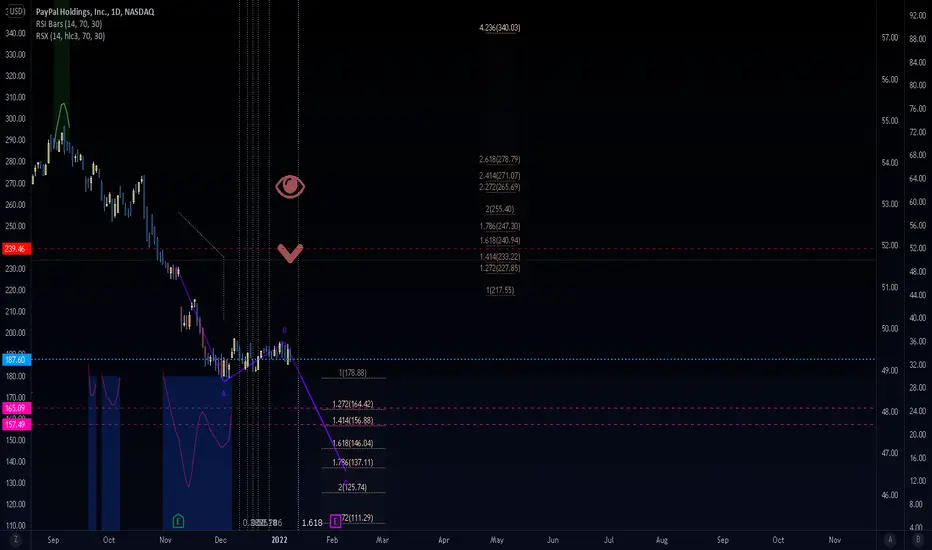
Paypal about to break the floor. PYPLShort term outlook.
Bearish outlook for gains at 165, then 157. Invalidation at 239.
We are not in the business of getting every prediction right, no one ever does and that is not the aim of the game. The Fibonacci targets are highlighted in purple with invalidation in red. Fibonacci goals, it is prudent to suggest, are nothing more than mere fractally evident and therefore statistically likely levels that the market will go to. Having said that, the market will always do what it wants and always has a mind of its own. Therefore, none of this is financial advice, so do your own research and rely only on your own analysis. Trading is a true one man sport. Good luck out there and stay safe!
Paypal vs BlockPYPL and SQ are among the biggest fintech companies!
PYPL P/E: 38
SQ P/E: 109
I think both have the potential to have a P/E ratio below 20..!
If you are looking at price volume it clearly shows in 2021 they had experienced a huge decline of 16% and 46% which means lower ambition to invest in these companies in comparison to 2020!
Soon they will be double digits!
Best,
Moshkelgosha
DISCLAIMER
I’m not a certified financial planner/advisor, a certified financial analyst, an economist, a CPA, an accountant, or a lawyer. I’m not a finance professional through formal education. The contents on this site are for informational purposes only and do not constitute financial, accounting, or legal advice. I can’t promise that the information shared on my posts is appropriate for you or anyone else. By using this site, you agree to hold me harmless from any ramifications, financial or otherwise, that occur to you as a result of acting on information found on this site.

Pypl long positionHello
by wave analysis pypl near important support line at weekly time and we suggest you buy for long Tp
