#PYR/USDT#PYR
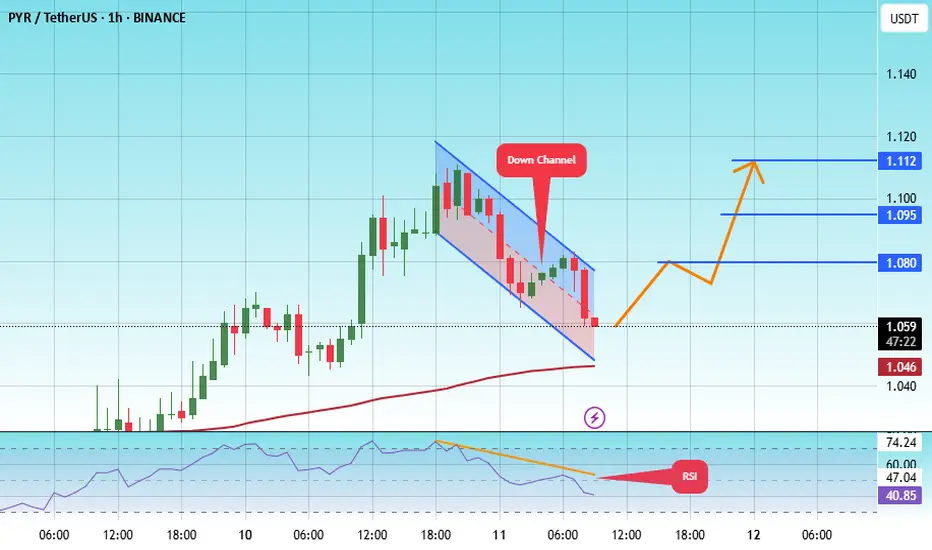
The price is moving within a descending channel on the 1-hour frame, adhering well to it, and is heading towards a strong breakout and retest.
We are experiencing a rebound from the lower boundary of the descending channel, which is support at 1.05.
We are experiencing a downtrend on the RSI indicator that is about to break and retest, supporting the upward trend.
We are heading towards stability above the 100 Moving Average.
Entry price: 1.06
First target: 1.08
Second target: 1.09
Third target: 1.11
Pyramid
#PYR/USDT#PYR
The price is moving within a descending channel on the 1-hour frame, adhering well to it, and is heading for a strong breakout and retest.
We are experiencing a rebound from the lower boundary of the descending channel, which is support at 1.100.
We are experiencing a downtrend on the RSI indicator, which is about to break and retest, supporting the upward trend.
We are looking for stability above the 100 moving average.
Entry price: 1.130
First target: 1.174
Second target: 1.200
Third target: 1.259

#PYR/USDT#PYR
The price is moving within a descending channel on the 1-hour frame, adhering well to it, and is heading towards a strong breakout and retest.
We are seeing a bounce from the lower boundary of the descending channel, which is support at 1.13.
We are seeing a downtrend on the RSI indicator that is about to be broken and retested, supporting the upward trend.
We are looking for stability above the 100 moving average.
Entry price: 1.165
First target: 1.19
Second target: 1.23
Third target: 1.28

#PYR/USDT#PYR
The price is moving within a descending channel on the 1-hour frame, adhering well to it, and is heading for a strong breakout and retest.
We are experiencing a rebound from the lower boundary of the descending channel, which is support at 1.07.
We are experiencing a downtrend on the RSI indicator that is about to break and retest, supporting the upward trend.
We are heading for stability above the 100 Moving Average.
Entry price: 1.08
First target: 1.11
Second target: 1.14
Third target: 1.187

#PYR/USDT#PYR
The price is moving in a descending channel on the 1-hour frame and is adhering to it well and is heading to break it upwards strongly and retest it
We have a bounce from the lower limit of the descending channel, this support is at a price of 1.325
We have a downtrend on the RSI indicator that is about to break and retest, which supports the rise
We have a trend to stabilize above the 100 moving average
Entry price 1.390
First target 1.464
Second target 1.529
Third target 1.615

#PYR/USDT#PYR
The price is moving in a descending channel on the 1-hour frame and is adhering to it well and is heading to break it upwards strongly and retest it
We have a bounce from the lower limit of the descending channel, this support is at a price of 1.72
We have a downtrend on the RSI indicator that is about to be broken and retested, which supports the rise
We have a trend to stabilize above the moving average 100
Entry price 1.73
First target 1.80
Second target 1.85
Third target 1.19
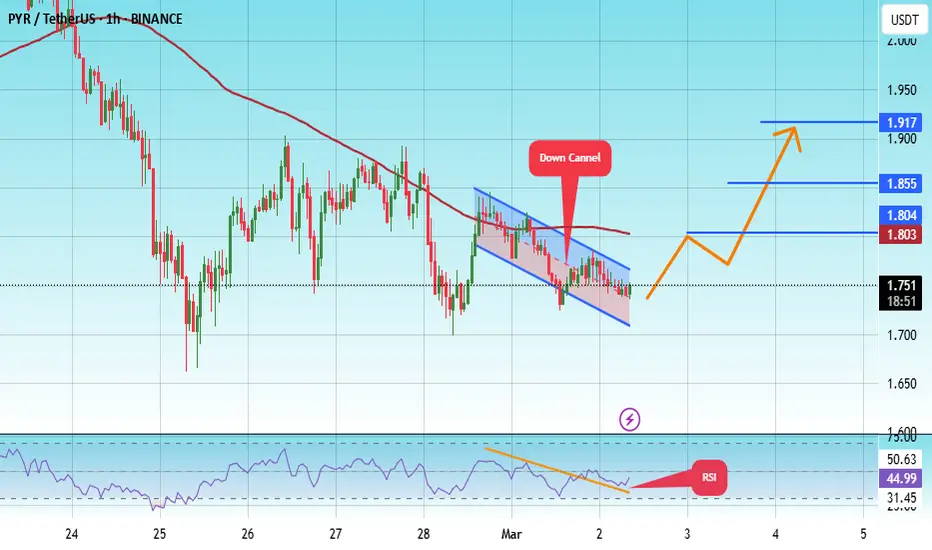
#PYR/USDT#PYR
The price is moving in a descending channel on the 1-hour frame and is adhering to it well and is heading to break it strongly upwards and retest it
We have a bounce from the lower limit of the descending channel, this support is at a price of 1.96
We have a downtrend on the RSI indicator that is about to break and retest, which supports the rise
We have a trend to stabilize above the Moving Average 100
Entry price 2.055
First target 2.16
Second target 2.26
Third target 2.37

Ready to launch upwards#PYR
The price is moving in a descending channel on the 1-hour frame and is adhering to it well and is heading to break it strongly upwards
We have a bounce from the lower limit of the descending channel, this support is at a price of 2.44
We have a downtrend on the RSI indicator that is about to be broken, which supports the rise
We have a trend to stabilize above the moving average 100
Entry price 2.52
First target 2.70
Second target 2.80
Third target 3.03

#PYR/USDR#PYR
The price is moving in a descending channel on the 1-hour frame and is expected to continue upwards
We have a trend to stabilize above the moving average 100 again
We have a descending trend on the RSI indicator that supports the rise by breaking it upwards
We have a support area at the lower limit of the channel at a price of 3.30
Entry price 3.34
First target 3.40
Second target 3.50
Third target 3.60

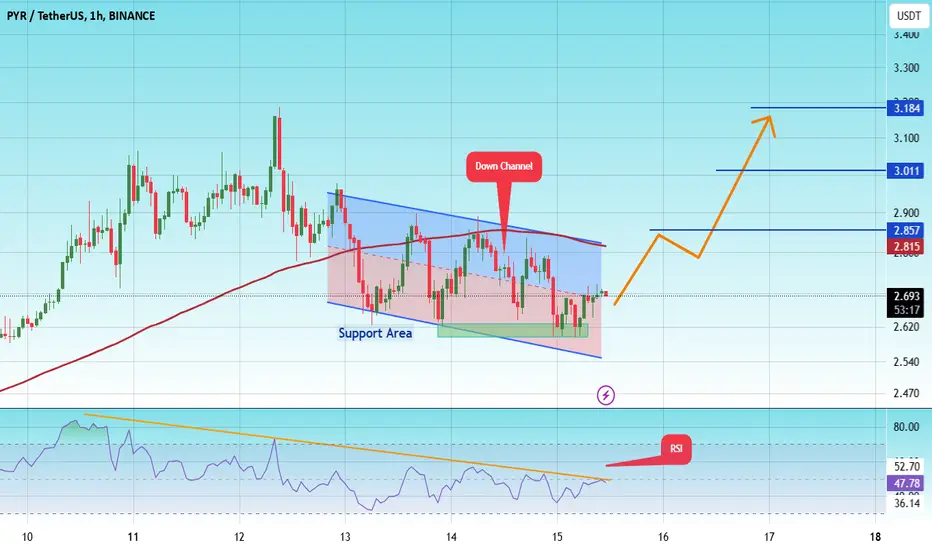
#PYR/USDT#PYR
The price is moving in a descending channel on the 1-hour frame upwards and is expected to continue.
We have a trend to stabilize above the moving average 100 again.
We have a downtrend on the RSI indicator that supports the rise by breaking it upwards.
We have a support area at the lower limit of the channel at a price of
2.70
Entry price 2.70
First target 2.85
Second target 3.01
Third target 3.18
PYRAMID FINANCIAL "website"I randomly came across this brand new token,. The website is fintage meme culture stuff, microsoft like. On CoinGecko the price is said to have started around $50.00 USD. From trading view I see a beginning price that was around $2.00 USD.

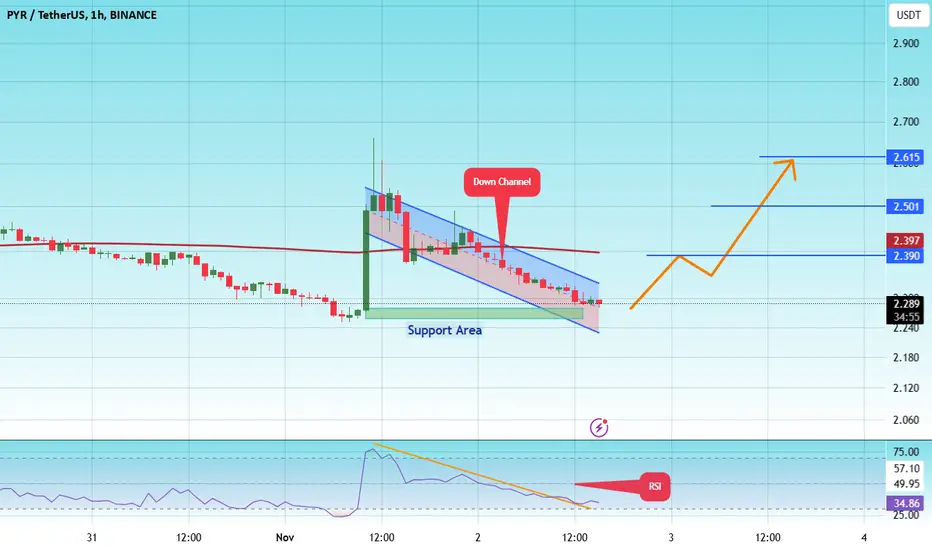
#PYR/USDT#PYR
The price is moving in a descending channel on the 1-hour frame upwards and is expected to continue.
We have a trend to stabilize above the moving average 100 again.
We have a downtrend on the RSI indicator that supports the rise by breaking it upwards.
We have a support area at the lower limit of the channel at a price of
2.28
Entry price 2.28
First target 2.39
Second target 2.50
Third target 2.61
#PYR/USDT#PYR
The price is moving in a bearish channel pattern on the 4-hour frame and sticking to it well
The price rebounded well from the lower border of the channel at the green support level of 3.80
We have a tendency to stabilize above the Moving Average 100
We have oversold resistance on the RSI indicator to support the rise, with a downtrend about to break higher
Entry price is 4.00
The first goal is 4.45
Second goal 4.75
Third goal 5.28

#PYR/USDT#PYR
The price is moving in a triangle on the 12-hour frame and we have a support area in green at the 7.50 level
We have a higher stability moving average of 100
We have a good bounce being prepared from the lower border of the triangle once the downtrend is broken
The RSI indicator has a downtrend that is about to break higher
Entry price 7.93
First goal 9.53
Second goal 11.25
Third goal 13.00

JPY BASKET LONGS📉📉📉📉 Expecting bullish price action on this indx as price is in a bullish market strucutre from a HTF, we are rejecting a bullish orderblock on h4 and confirmed with a bullish momentum candle.
What do you think ? Comment below..

How Do You Build A Position With Pyramiding?As a trader, it’s a general rule of thumb that we should always be looking to maximise potential returns (per unit of risk) with each transaction. We should always be looking to squeeze as much out of the market as we can.
There are times when this can occur by simply letting the trade run its course. However, sometimes market conditions align perfectly for savvy traders to “press the trade” or Pyramiding into the trade.
Don’t press your luck; press the trade instead!
Attempting multiple entries in the direction of a trend is one strategy savvy traders use in an attempt to maximise return (otherwise known as Pyramiding). The problem with this tactic is that while it may increase the potential reward, having a larger position in the market also opens you up to more risk. As a trader, you need to find the perfect balance of pressing the trade while not pressing your luck.
There are a few ways to achieve this:
If the market is moving at a snail’s pace, and not much movement has been made from the initial entry, any additional entry should be minor. If, however, a decent distance has been travelled, a trailing stop will secure more profit, and any additional entry can be larger. In essence, any additional position sizes are partly dependent on the distance between the initial entry position to stop loss.
Ensure you have a strong driver that pushes prices along. Simply pressing trades at random is not good risk management.
Reduce risk on entry by only adding additional positions when the stop loss on the first position can be trailed.
Pick your battles carefully when Pyramiding
You may find that as time wears on, you’re left with a large portion (>2% of total equity) in a single trade. The tactic of adding exposure will generally make for a “short” pyramid, which typically won’t grow over 2.5% of overall equity. This Pyramiding tactic ensures you’re exposed to additional upside while minimising downside to a level with which you’re comfortable.
Here are a few things to be wary of:
Keep an eye out for drivers that influence market psychology: This is when momentum and volatility will be high, allowing you to pyramid into a move more easily. For the technical traders, you may prefer to avoid day-to-day shifts by taking in a broader market view.
Diversify: as with any investment, don’t place all your eggs in one basket. Diversification is key to keeping overall risk low.
Have strict risk limits in place: With 2.5% in one pyramid, another 2.5% in another – next thing you know, your overall portfolio heat is close to 10%. That’s a high amount of risk to carry around with you. Consider minimising position sizes of certain trades to reduce overall risk.
Consistency is key with position sizes: If your initial entry is $100k and your second is $300k, you’re off to a lousy start in building your pyramid.
Final Thoughts on Pyramiding
Remember always to start small and slowly. There’s no need to rush in. Experiment with pyramiding until you’re comfortable with your approach. Always remember the two key elements to consider:
Resist the temptation to take profit early when the opportunity arises. Sometimes it’s best to sit on an existing trade.
Be wary of adding to your trade at “worse” levels. Trends will always end at a certain point, so you don’t want to be pyramiding into an extended, ongoing trend. Look for new trends to pyramid in, which will reduce your overall risk.

Bitcoin breaks the channel and dumps, where to nowSo we have broken the channel and are falling inline with my idea, and look forward to watching this play out. Im looking further ahead with this idea that may see another bull trap after hitting mid-high teens from the previous plan, so the market makers can try for another shot at trapping people in before another further drop to the bottom to extend the market out further

COIN : CLOUDYCOIN is floating around in the clouds right now... halfway between 0 and 600.
Final 15min chart.

COIN : OUTCOIN bounces out of the descending channel that it's been rolling in since the beginning of the week.
Has a base of COIN been established at 300?
Starting with a horizontal ray at 310 (the bottom of the big drop),
I began using rays to connect the higher wicks together, and then the lows together.
After that, I extended some rays to the left and looked at where all the lines intersect.
Using these lines and points, I placed pitchfans, lining the outside edges up to the rays.
Once I established the main placement of the pitchfans,
I removed some unnecessary rays
and then edited the divisions of the pitchfans in the settings, lining up the divisions to wicks of the inner candles
in the most meaningful ways that I could.
If you zoom in you can see that every single line on the chart aligns with atleast 2 wicks or 2 candle bodies,
other lines line up with quite more.
Each line is specifically placed while considering wick importance and # of wicks aligned.
Fib spirals too.
2 triangles were then placed forming a pyramid structure
in order to express the fact that one of the reasons
that I am currently analyzing the trends in COIN price action in this way
is to try to establish a possible price base of COIN after its IPO fallout
to use as justification for a possible and timely buy in.
And here we are, 50 cents above that initial low point after the IPO.
Will COIN continue to roll downhill, or will it start bouncing higher?
I am not completely sure, and tomorrow this chart may look quite different than it does now.
It's fascinating.
Got my eye on COIN...
watching for a "heads bulls win, tails bears lose" scenario.
//Durbtrade

NEOUSD Target Price 63.62Next Target is 63.62. Trail Stop Loss. Look for price action signal Inside Bar on the lower time frame to enter another position.

Investment AdviceAsesoramiento 100% acertado en inversiones. Esquema Ponzi presente. Pyramid scam for idiots.

BTCUSD | PrismaticMeme triangle turned into Geometric Prism. Pattern evolved from laying three pitchforks and tuning the levels to mathematic harmonic ratios. This chart simply highlights the geometry found within.
Not trading advice

