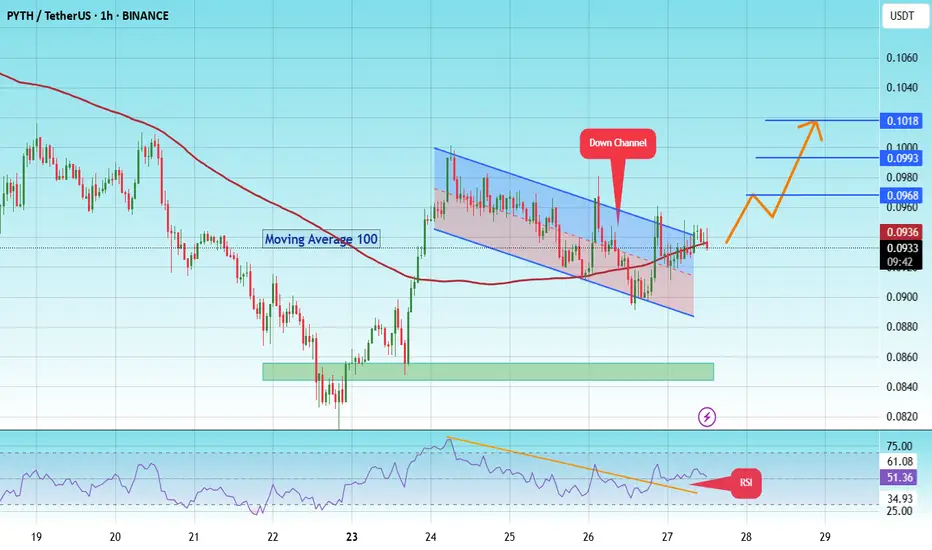
Pyth pump to $0.1018 soon! #PYTH
The price is moving within a descending channel on the 1-hour frame and is expected to break and continue upward.
We have a trend to stabilize above the 100 moving average once again.
We have a downtrend on the RSI indicator that supports the upward break.
We have a support area at the lower boundary of the channel at 0.0895, acting as strong support from which the price can rebound.
We have a major support area in green that pushed the price upward at 0.085.
Entry price: 0.0936
First target: 0.0968
Second target: 0.0993
Third target: 0.1018
To manage risk, don't forget stop loss and capital management.
When you reach the first target, save some profits and then change the stop order to an entry order.
For inquiries, please comment.
Thank you.
Pythbtc
PYTHUSDT Forming Falling WedgePYTHUSDT is setting up for what could be a powerful bullish move, as it has recently formed a classic falling wedge pattern on the chart. This is widely recognized among crypto traders as a strong reversal pattern, often appearing near the end of a downtrend when selling pressure starts to lose momentum. As price action tightens within this wedge, it creates an ideal scenario for a breakout to the upside, especially with good volume providing solid confirmation of buyer interest.
The current volume levels on PYTHUSDT look promising and indicate growing accumulation among investors. When a falling wedge is accompanied by increasing volume near its breakout point, it significantly strengthens the likelihood of a sustained upward trend. Many traders will be looking for a decisive close above the wedge’s resistance line, which could open the door for a rally aiming for gains in the 90% to 100%+ range. This makes PYTHUSDT an attractive option for swing traders and mid-term holders seeking high-potential setups in the crypto market.
What adds to the bullish thesis is the rising interest from investors who are keeping a close eye on PYTHUSDT. As broader market sentiment begins to lean bullish, projects like PYTH that combine a reliable technical structure with growing investor confidence often become top picks. This creates the potential for not just technical buying but also FOMO-driven momentum, which can accelerate price targets once the breakout gains traction.
With all these factors aligning — a well-formed falling wedge pattern, supportive volume, and increased investor attention — PYTHUSDT could be one of the standout altcoins in the coming weeks. Keep watch for confirmation of the breakout and manage your risk wisely to capture the best possible move this pattern has to offer.
✅ Show your support by hitting the like button and
✅ Leaving a comment below! (What is You opinion about this Coin)
Your feedback and engagement keep me inspired to share more insightful market analysis with you!

#PYTH/USDT#PYTH
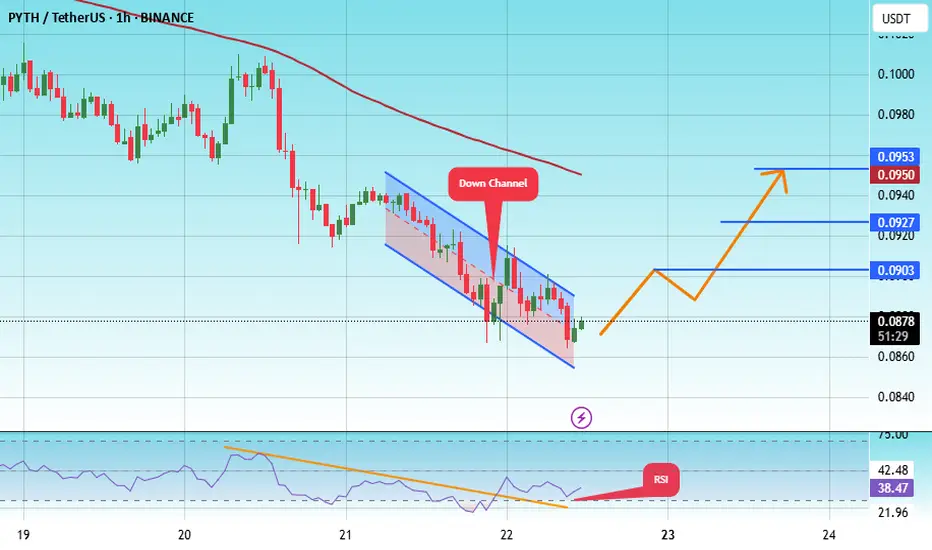
The price is moving within a descending channel on the 1-hour frame, adhering well to it, and is heading for a strong breakout and retest.
We are seeing a bounce from the lower boundary of the descending channel, which is support at 0.0860.
We have a downtrend on the RSI indicator that is about to be broken and retested, supporting the upward trend.
We are looking for stability above the 100 moving average.
Entry price: 0.0880
First target: 0.0903
Second target: 0.0927
Third target: 0.0950
#PYTH/USDT#PYTH
The price is moving within a descending channel on the 1-hour frame, adhering well to it, and is heading toward a strong breakout and retest.
We are experiencing a rebound from the lower boundary of the descending channel. This support is at 0.1030.
We have a downtrend on the RSI indicator that is about to be broken and retested, supporting the upward trend.
We are heading toward stability above the 100 moving average.
Entry price: 0.1080
First target: 0.1111
Second target: 0.1140
Third target: 0.1180

#PYTH/USDT#PYTH
The price is moving within a descending channel on the 1-hour frame, adhering well to it, and is heading for a strong breakout and retest.
We are seeing a bounce from the lower boundary of the descending channel, which is support at 0.1270.
We have a downtrend on the RSI indicator that is about to be broken and retested, supporting the upward trend.
We are looking for stability above the 100 moving average.
Entry price: 0.1280
First target: 0.1322
Second target: 0.1350
Third target: 0.1400

#PYTH/USDT#PYTH
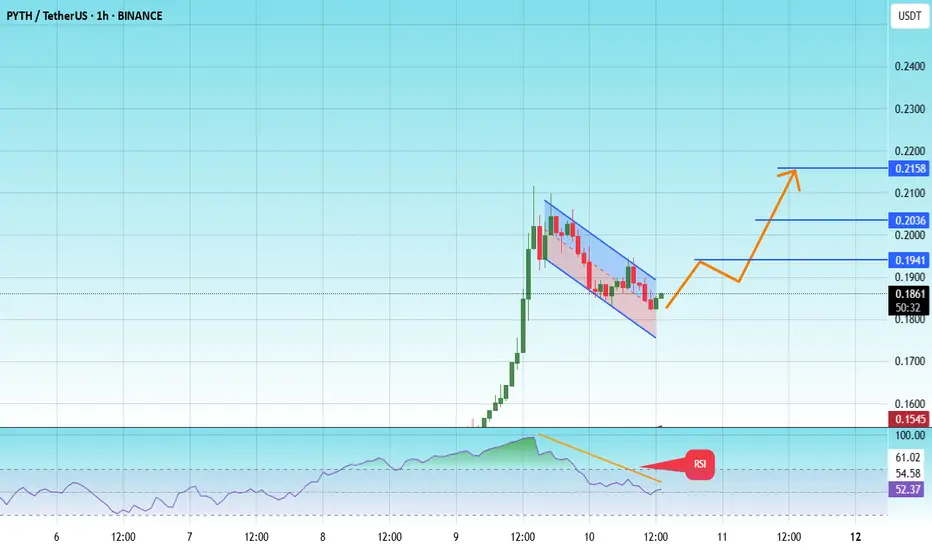
The price is moving within a descending channel on the 1-hour frame and is expected to break and continue upward.
We have a trend to stabilize above the 100 moving average once again.
We have a downtrend on the RSI indicator that supports the upward move with a breakout.
We have a support area at the lower limit of the channel at 0.1800, which acts as strong support from which the price can rebound.
Entry price: 0.1860
First target: 0.1941
Second target: 0.2036
Third target: 0.2160
PYTHUSDT - Rounding bottom patternBINANCE:PYTHUSDT stands out as a strong investment opportunity, often considered an improved version of $LINK.
While sharing similarities with LINK, it surpasses it in certain key areas. Being a new project with low market saturation, it offers significant potential for growth ✅️
The med-term targets are outlined in the chart.
Accumulation is recommended now up to 0.236 fibo level .
Best regards Ceciliones🎯

#PYTH/USDT#PYTH
The price is moving in a bearish channel on a 4-hour frame and is holding it strongly and is about to break it upward
We have a bounce from the green support area at 0.3400
We have a tendency to stabilize above the Moving Average 100
We have a downtrend on the RSI indicator that is about to break higher and supports the rise
Entry price is 0.3500
The first target is 0.3970
The second target is 0.4400
The third goal is 0.4855

PYTH medium term is bearishBy examining the chart data, we found that PYTH has completed a large degree pattern. This pattern is related to wave A. This pattern has lasted for about 250 days.
It is expected that wave B is also a pattern of the same degree as wave A. It means about 200-250 days.
The supply range is the best range for sell/short positions.
Note that in order to take a position, one must have a trading setup and this is only a medium-term view for PYTH.
Closing a daily candle above the invalidation level will violate the analysis
For risk management, please don't forget stop loss and capital management
Comment if you have any questions
Thank You

PYTH NEW UPDATENow that we have more data on the chart, the PYTH scenario is clearer.
It seems to be completing a descending triangle which is now in wave D of this triangle.
Wave D appears to be a diametric.
From the red box, we expect the price to move towards the green range and then react to the green box.
For risk management, please don't forget stop loss and capital management
Comment if you have any questions
Thank You

#PYTH/USDT#PYTH
The price is moving in a bearish channel pattern on the 4-hour frame, and it adheres to it well, and it is expected to break to the upside
The price rebounded well from the lower border of the channel at the green support level of 0.4220, which is a strong level
We have a trend to hold above the Moving Average 100, which is strong support for the rise
We have very strong oversold saturation on the RSI indicator to support the rise, with a downtrend about to break higher
Entry price is 0.4380
The first target is 0.5146
The second target is 0.5747
The third target is 0.6550

#PYTH/USDT#PYTH
The price is moving in a downtrend on a 4-hour frame
After bouncing from a major support area in green at the $0.5000 level
We have a tendency to stabilize above the Moving Average 100
We have a downtrend on the RSI that is about to break higher
Entry price is 0.5700
The first target is 0.6700
The second target is 0.7700
The third goal is 0.9000

PYTH target 1.584h time frame
-
PYTH is consolidating as a triangle pattern, which could be see as a potential continuation. Before completing structure, PYTH just retested 0.618 Fib Projection and got support. Both signal indicate that PYTH is still on an uptrend way.
-
TP: 1.58
SL: 0.781

PYTH - new ATH, can this coin 20x in 2024?Technical analysis
PYTH looks absolutely strong! This coin is listed on all major exchanges and is pretty easy to buy. Why do I think this coin is bullish? We can see that the price is going up after the listing on exchanges, which is a strong sign of interest. It will hit a new all-time high pretty soon, and after that, it can skyrocket. The accumulation phase should be completed, and we are ready for price discovery in 2024. Let me know what you think about my analysis, and please hit boost and follow for more ideas. Trading is not hard if you have a good coach! Thank you, and I wish you successful trades.
About Pyth Network
The Pyth Network is the largest and fastest-growing first-party oracle network. Pyth delivers real-time market data to financial dApps across 40+ blockchains and provides 380+ low-latency price feeds across cryptocurrencies, equities, ETFs, FX pairs, and commodities.
The network comprises some of the world's largest exchanges, market makers, and financial services providers who contribute their own price data for use by smart contracts. Participants in the network include Binance, OKX, Jane Street, Bybit, Cboe Global Markets and more. The Pyth oracle program aggregates their data on-chain to guard against inaccuracies and manipulation. Finally, the protocol allows users to "pull" the latest price onto their blockchain when needed.
In less than a year since the launch of the cross-chain pull oracle, the network has secured over SEED_TVCODER77_ETHBTCDATA:1B in total value. The Pyth Network has been used by over 250 applications to secure $100B in trading volume. Integration with Pyth Price Feeds is permissionless. Let me know what you think about my analysis, and please hit boost and follow for more ideas. Trading is not hard if you have a good coach! Thank you, and I wish you successful trades.

PYTH buy setupOn the PYTH chart, we have a iCH, we have a bullish view on this symbol to supply.We also have a good support area on the chart
The Demand range is the right place to enter a Buy/Long position.
Closing a 4H candle below the invalidation level will invalidate our view and invalidate the analysis
Note that the financial market is risky, so:
Do not enter any position without confirmation and trigger.
Do not enter a position without setting a stop.
Do not enter a position without capital management.
When we reach the first TP, save some profit and try to move the stop continuously in the direction of your profit.
If you have any comments please post them, comments will help us improve our performance
Thanks

PYTH buy/long setupFirst of all, note that this is not a sell/short setup, but a buy/long setup.
If the price reaches the green range, we will enter the buy/long position.
Closing a 4-hour candle below the invalidation level will violate the analysis
For risk management, please don't forget stop loss and capital management
Comment if you have any questions
Thank You

#PYTH/USDT#PYTH
The bearish channel on the 1-hour frame was broken strongly to the upside
It is supported by a rebound from the green support area on the chart
This support area was adhered to well
Entry price is 0.5920
The first target is 0.6000
The second goal is 0.6192
The third goal is 0.6370

PYTH LOOKS BEARISHIt has had a lot of liquidity pools in the upper range that has swept everyone away.
After hitting the main supply and then the mitigated supply, it seems ready to drop.
I specified the targets on the chart. I also specified the invalidation level. Closing a 4-hour candle above this level will violate the analysis
For risk management, please don't forget stop loss and capital management
When we reach the first target, save some profit and then change the stop to entry
Comment if you have any questions
Thank You

Pyth - long - could be early!Pyth looks strong now after the initial airdrop sell off.
I think Pyth are preparing for a big move.
If we got really lucky (and BTC dump) I think we can find a nice entry at around 0.31. In that case we have potential 68% set up with 4.0 risk/reward ratio.
If you think Pyth is the "new Link" - It could also be a good time to DCA into Pyth...we are so early :)

PYTH LOOKS BEARISHIn terms of wave counting, we had a triangle, which is probably the A branch of a larger pattern.
After this branch A, we expect to have a branch B of the same size as branch A. Because we expect this branch to be of the same grade as A, so in terms of time, it can be estimated that this branch will last until January 10th.
We have a support zone, if it is maintained, the price can run towards the pullback FLIP zone, and if it is lost, we will have a further correction.
By January 10th, this view will be violated if the daily candle closes above the red FLIP range
For risk management, please don't forget stop loss and capital management
Comment if you have any questions
Thank You

PYTH ANALYSIS (4H)First of all, as you know, we don't have much data about this symbol. But after checking I found that it is now in the big B wave which is a diametric.
We are now in wave D, which is an ascending wave. It is expected to drop from the red area to the lower areas. This drop will complete wave e of B.
For risk management, please don't forget stop loss and capital management
Comment if you have any questions
Thank You
