GBPCHF short entry 1HPrice is below all my moving averages, signaling price to be in a downtrend. I was awaiting a break below the 50 EMA, signaling weakness in the pullback to the upside.
Price should head to retest the bottom, potentially making a new low. the Daily chart is in a strong downtrend, so a new low is certainly possible. We are also breaking a new Weekly low, which should produce huge momentum lower.
My moving averages are harmonic in nature...
There is confluence on the RSI with the Weekly chart.
The Monthly, however, is showing divergence. Perhaps after next month, we see a bullish move to retest previous Weekly highs.
QING

EURAUD Fibonacci retracement 1Hour setupQuick scalp trade setting up on the 1 hour EURAUD chart. I'll enter at the 50% (GREEN) line, as price falls back to retest the area. I'll enter any bullish candle formation & watch the 15min chart for confirmation. I'll look to take profits on half my position at the 1st PURPLE line, as the pullback may not be over. If price cannot hold above the 1st PURPLE line, I'll await for a drop to the .618 Fibonacci level & reenter, expecting price to move back to the 50% & ultimately back to retest the high, where I'll look to take half profits on whatever is left of my position.

NZDCAD Divergence entry shortNZDCAD is currently retesting the level it broke out from. My indicators are signaling a divergence, which is a sign that the pair will continue its Bearish trend. I'll be using the 15min & 1Hr time frame to enter a SHORT position. This is a position that could be held for 3-5 weeks (3-5 weekly candles) before I even consider taking profits.
This is a simple set up for any beginner trader, with even $25-50 in your account. You could easily double your account with this one trade, if the entry is decent.
My divergence indicator is the On Balance Volume Indicator. Put simply it signals weakness in buying momentum.

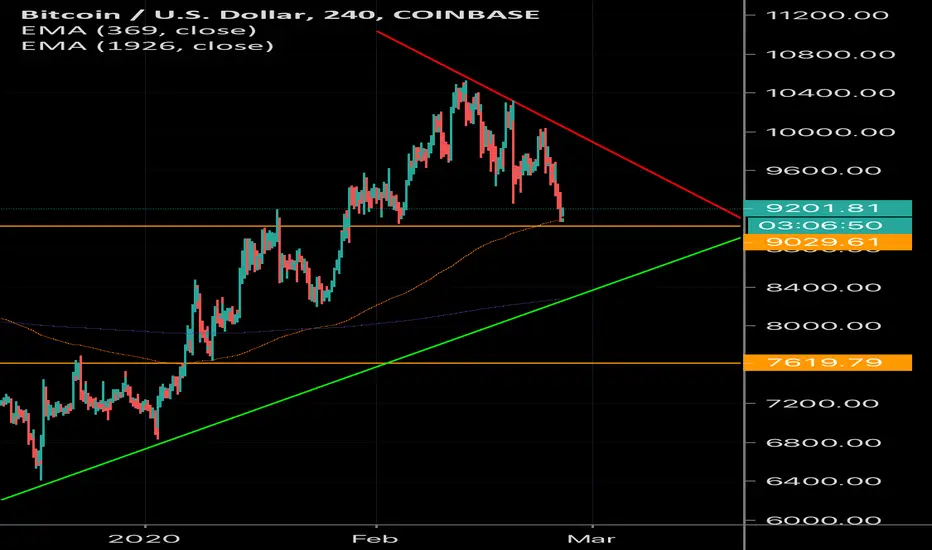
How to trade BTCUSD like a pro1. If you are new to trading, learn how to trade support & resistance of triangles on the Daily & Hourly time frame. The time it will take BTC to retest the BUY zones I've marked, will be more than enough time for you to learn & practice how to be ready for the retest of the areas I've marked.
2. Realize that BTC has retested & held above the green triangular channel. The proper way to enter this trade is to wait for the bottom level of this channel to be retested once more, on a lower time frame. The current pattern on the Daily chart is a bullish candle stick pattern. If you are new to trading, also learn more about common candle stick patterns that occur over & over, giving professional traders signals to enter trades confidently.
3. If you've entered already, be cautious as price rises. Be prepared to take small profits if 4 Hour or 1 Hour charts show huge selling. BTC HAS BEEN & IS STILL IN AN UPTREND, however, any global event could shake the crypto market up, which could result in people mass dumping their BTC holdings.

AUDUSD Bounce off 2008 Monthly lowAUDUSD has just entered a level it hasn’t tested since 2008! A huge move to the upside will come as long as this level holds. This is a strong BUY set up. The 15min chart just showed signs of high volume & decending wedge Roth into the level.
Price may bounce off & go back into the level before it springs to new Daily highs. If you haven’t made any money all year, this is a free throw shot waiting for you!!
As far as stocks, don’t play into the Coronavirus being the cause. Professional traders know this is nonsense. I’ve been shouting short STOCKS since December. The charts tell the story. The news is always the scapegoat.

USDCAD Cup & handle formationI'd be expecting a pullback in USDCAD before a breakout. The cup & handle pattern is a bullish indicator. At this time, USDCAD is up against a heavy Daily resistance area. A short term SHORT play has set up, as the 1Hr chart has formed an ascending, which is a common reversal signal when up against larger time frame resistance.
PURPLE lines notate profit zones in either direction you chose to take. Playing both sides of this move is certainly possible.
CONCLUSION: Short term SHORT play, long term LONG...

2 possible BTCUSD futures to come...I dont care if its BTC or any other stock or currency, 2 things apply. Professional traders are watching the charts, armatures & part time traders are speculating off news & hype. Read what unfolds in the price action & do not get distracted. The truth is, no matter what's in the news, investor's true decisions will show up once positions are executed (whether long or short). I dont care if its crypto miners or banks. Decisions aren't real until they show up on the time & sales tape, aka the candles.
There's no reason to be touching BTCUSD util the uptrend is reclaimed.

1Hr EURUSD to go with my previous Daily analysisEURUSD is falling to retest the shoulder of the Reverse Head & shoulders pattern i analyzed on the daily chart. If price holds above this Right “Shoulder”, we could see the pair rise to new Monthly Chart highs. The monthly chart shows a head & shoulders, indicating Bearish momentum. However, if we break to the downside, we could see the EURUSD at all time lows over the next few years. The number that EURUSD should reclaim to continue Bullish momentum, would be the 1.20697 area.
I’m short term bullish, as price (on the Weekly) is pulling back from a very bearish drop (from the 1.20697 area. I’m long term bearish, awaiting a high enough retracement back to the current high. Once the current highs are retested, I’ll await a bearish signal to enter short on the daily. I wouldn’t expect to be taking profits for at least a year, as this bullish bounce (that created the Right “Shoulder” of the pattern) that’s happing right now, took out more than a years worth of selling (on the weekly).
Ultimately, this move could be a spike into more selling pressure to come, or it could mean there’s reversal is on the way & this current Weekly Reverse Head & Shoulders could see the EURUSD making new highs. The monthly chart is in an uptrend, seeing that the current low is higher than the previous. Those last 2 elements put together would be more powerful than a short set up.
So, if I do end up shorting, as price moves up, it may only be for quick profits. Any sign of bullish momentum on the weekly chart & I will reverse to long term Long.

Possible BULLISH spike, BTC retest demand zoneBTC has pulled back, as my last analysis projected. BTC may find support at these GREEN LINE levels. Short term profit targets are notated by the PURPLE ZONE.
If price cannot hold the top GREEN LINE, price will fall to the next to retest & either continue the uptrend...or fail to new lows for the year.

USDCAD CUP & HANDLEAnalysis for pattern traders. Using chart patterns on larger time frames maximize profits.
Use lower timeframe patterns to hop onto the larger timeframe trend direction.

EURUSD Daily Reverse Head & Shoulders chart pattern forming.
A hold above the Right Shoulder trend line will see price continue a reversal to retest the 1st horizontal resistance (PURPLE LINES). A hold above that neckline will see price try to retest the high.

AUDUSD WEEKLY HEAD & SHOULDERSWe are coming upon an area that may have a small bounce. Lower timeframe day trades on the LONG side are possible in this area, as price retests a previous low. A break & hold below this area will see price fall to retest the all time lows. Long term, I'm expecting every pullback to the upside to be potential SHORT entries.


Btc headed to retest support levels.The next few days even perhaps weeks, we will most likely see BTCUSD fighting to hold on to current levels of support. BTCUSD has failed a 3rd attempt to break higher of th 4 hour chart. This is usually a bearish sign. Not looking to buy at this time.
USDCAD channel break, continuing uptrendPurple lines are profit targets as long as USDCAD holds above this green channel.

Buying Intraday USDJPY pullbacks USDJPY is holding the Daily chart breakout. Intraday pullbacks are buyable...

Still short EURUSDSee my previous post entry in the 1.10800 area for more detail. Playing the tops & bottoms of the blue channel. Short term profits will be taken at bottom blue line. Hoping for failure of that area & long term profits at the retest of the purple line.

USDZAR color coordinating analysis1. I like trading USDZAR because of the large movement potential. Same reason I like trading Bitcoin, not because the currency is realistic as a monetary replacement to the dollar. I am, however, in support of block-chain technology because of its utility in health & data storage. NOWHERE on the stock market will you see regular moves so big for maximizing profit potentials (on a swing or day trade basis). I've been trading 10 years, take my word...
2. I like to color coordinate my charts. The GREEN line lets me know where the most recent long-term support is located. I say long-term because this is a 4 hour chart. Movements between tops & bottoms of channels could take weeks or months. As a day trader, a price move taking weeks is "long-term" for me. Technically, its more like medium-term, as a genuine "long-term" analysis would be based off a weekly or monthly chart time frame. The GOLD line is a "short-term" area of resistance that may present a problem for price to re-test the most recent high (The RED line). The RED line is the most recent resistance area (again, based on this 4 hour chart). The purple line is the 1st place I'd be expecting to take some profits, as the chart's history has made it clear that this is a price level that more traders are willing to sell.
3. MY STRATEGY: In most of my posts, you'll see that I mainly trade from tops to bottoms of channels. Selling the "highs" & buying the "lows". I'm not here to teach you how to trade, I'll make videos after I'm done pursuing some personal goals of mine. However, the more you look at my chart drawings & other traders who use trend lines & trend channels, you'll begin to see the simple trading patterns that emerge on every trading chart in the world. I color coordinate my lines so that every few hours or few days, they can serve as land-markers to remind me of where price is, where its been, & where its potentially going.
Trading is simple, yet being patient for price to test potential reversal zones is what's difficult. Every technical analysis strategy in the world begins with this foundation. A trader's ability to consistently wait patiently for patterns to form, price levels to be tested, & trade what's seen (not assumed) will be the key to long-term success. A lack of discipline will see a trader frustrated & wanting to quit before they can even see their own potential...thanks for checking out my trades!

BTC to retest $13,000BTC has held crucial levels & held above key long term moving averages. After retesting the top of this current channel it has formed, a breakout will see BTC continue its uptrend. Holding above $13,000 will see BTC back up in the $20K range by 2021 without much resistance.
The moving averages I have here are based on harmonic principles of 3, 6, & 9.

Still long GOLD, since 2009 [DETAILED]Gold is still a preferred long term asset for wealthy individuals & governments. I've been long since I got into financial markets back in 2008. A wealthy client of mine (whom I did sports recovery on from a Pro Baseball career) suggested I buy gold back then. I had no idea about it, I just bought it & held on. I sold it around 2011 to start another business & have continued to be an investor/trader since.
Currently awaiting to continue buying pullbacks to the (long term) green line. This is a wealth play that I expect to simply hold long term. I BUY PHYSICAL GOLD & track the price value with the chart. You must understand market economics & the historical valuation of GOLD to understand why I approach it this way. GOLD IS NOT A "SAVE THE DAY" ASSET. It is simply a part of a long term asset building strategy to add to a balanced portfolio.

Beware BTCI took some profits from the recent entry a few days ago. If we cant get above 8840, we will retest the lows & ultimately, if they fail, BTC wont stop until the $3000 area. Don't fight the trend, be disciplined about seeing what the chart is really saying. Continuing to fail previous highs are warning signs that investors are selling their positions. Be patient for price to retest previous buy/support/demand zones. BTC is just one of those over-rated assets that can become a falling knife really fast. Don't keep trying to catch it, just wait to see how price reacts to buy/support/demand zones.

Short USDCAD, MY MOST DETAILED ANALYSISI've been in a short position in USDCAD for a few days now. This entry was based on my analysis of the failure In price from the DAILY HIGH price level of 1.46853 back on January 20th 2016 (top WHITE LINE). A price range/channel was formed when this price level failure hit a low of 1.20620 (bottom WHITE LINE), giving us a potential area that price is seeking to retest. AKA, whoever was buying there has either already been selling & taking profits OR they are waiting for price to return to that level so they can buy more at the original price they felt the USDCAD is worth. Since this move in price took about a year or so to form, it will most likely take a year or so to return to the level. This could potentially happen faster in the event of some catastrophic world event in which investors engage in extreme selling of the currency pair.
LONGER TERM, the GREEN line marks the next major support level that price will seek to retest if the white line at 1.20620 cant be held. This will simply be a signal that the majority of traders don't think the USDCAD is worth buying at that level. Price will continue to fall until the majority of buyers agree on a fair price that the USDCAD is worth.
ADDITIONAL LINES I'VE DRAWN:
The GOLD line identifies the support level that formed the most recent high (top WHITE LINE) of 1.46853. In my analysis style, this tells me that 1.28301 (GOLD line) was an area in the past where a lot of buying took place, moving price to new highs. This level could be retested & hold, signaling a move back up to retest that high (top WHITE line). However, a failure of this level will more than likely see price fall at least back to the bottom WHITE line in efforts to retest 1.20620 to see if the majority of traders think the USDCAD is worth buying at that price.
The BLUE lines are just drawn to show you guys the diagonal channel within this parallel WHITE channel. Breaks & holds of diagonal channels inside of parallel channels are just helpful indicators of price reversing.
I also have a 50EMA simply because I know a lot of traders use it. Also, it helps for intra day trades if I just want to make a quick trade for some income. Simple rule, price above the 50 means price is bullish, & below means I should be shorting. I plot the 639SEMA simply because of harmonics & price's natural tendency to gravitate to & from this long term moving average. Nothing special, just a harmonic of nature.
CONCLUSION
Buying at the bottom of channels & taking profits at the top is the most simplified way of trading. The larger the channel, the more profit potential. For example, I could short 2 positions to enter the trade. I could sell 1 position at the bottom white line just to take the money & go on a nice vacation, while I wait for other trades to show potential for entry. Because I took 2 positions, I'm still able to remain profitable in the trade in case the bottom WHITE line fails & price moves lower to retest even more historical lows (i.e. the GREEN line). Buy the lows sell the highs is really all it takes to make a decent living or some extra money.

BTC Price channels & profit targetsGreen lines are support, red lines are potential resistance. Purple line is 1st profit target.
BTC is holding a parallel channel inside a descending channel. Price continuing to hold above the green line will signal a potential channel break of the upper Red line, marking the supply zone of the descending channel. Break & hold of this descending channel will have BTC primed to retest the purple line, as previous supply. Price remains above the 50SMA signaling the bulls still have momentum.
