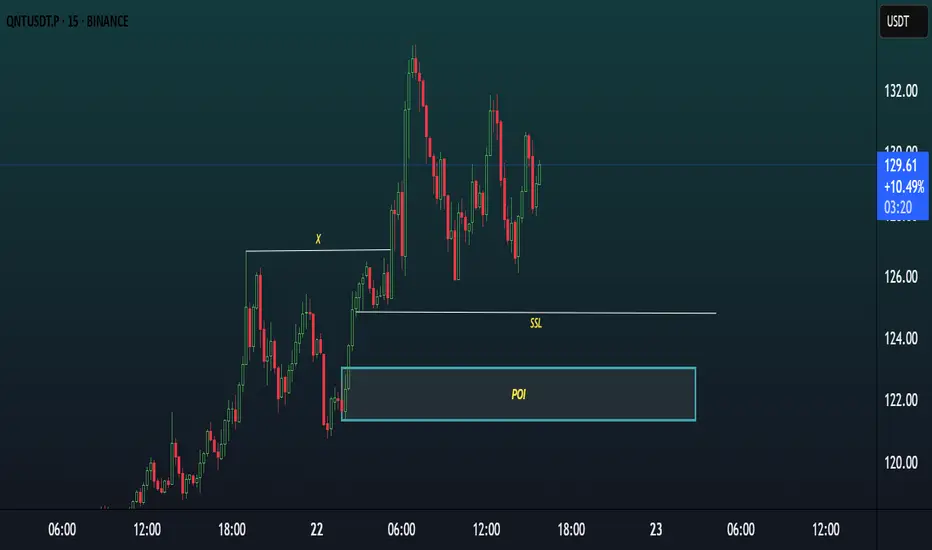
QNT TRADE IDEA.Market Structure: The market broke previous highs, showing bullish intent. A temporary pullback is underway, forming a higher low structure.
Liquidity Setup: There is a clear Sell-Side Liquidity (SSL) resting below recent lows around $124, acting as a liquidity magnet. Price may move down to collect that liquidity before continuing upward.
Point of Interest (POI): A strong POI zone is marked between $121–$123, which aligns with previous consolidation and demand imbalance, likely to trigger buy orders or institutional interest.
Expectation: Ideal setup is a liquidity sweep into POI, followed by bullish price action like a bullish engulfing or break of minor structure for confirmation.
Bias: Bullish, targeting a continuation toward the $134–$136 zone after a clean tap into POI and SSL sweep.
✅ Summary: Waiting for a pullback into POI and SSL zone to enter long with confirmation. This setup aligns with smart money concepts and demand zone trading.
Qntusdt
$QNTUSDT Breakout – 120% Move Ahead?GETTEX:QNT just broke out of a major triangle pattern that’s been building for months.
With this breakout above $121, the chart hints at a strong move ahead, possibly up to $260.
If it holds above the $108 zone, this could be the start of a big rally. One to watch closely.
DYOR, NFA

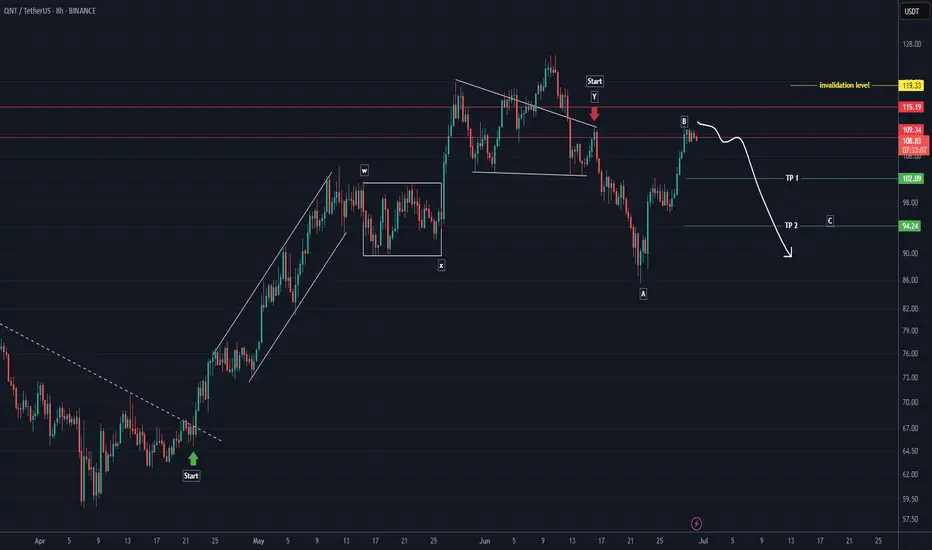
QNT Analysis (8H)From the point where we placed the red arrow on the chart, it seems that NEIRO’s correction has begun.
This correction appears to be a diagonal (diametric) pattern, and we are currently at the end of wave F.
Wave G could complete within the green zone, where we can look for a Rebuy setup.
The targets are marked on the chart.
If a daily candle closes below the invalidation level, this analysis will be invalidated.
For risk management, please don't forget stop loss and capital management
When we reach the first target, save some profit and then change the stop to entry
Comment if you have any questions
Thank You
#QNTUSDT #4h (Bitget Futures) Bull flag near breakoutQuant regained 50MA support after breaking out of the falling wedge, bullish continuation seems likely.
⚡️⚡️ #QNT/USDT ⚡️⚡️
Exchanges: Bitget Futures
Signal Type: Regular (Long)
Leverage: Isolated (6.0X)
Amount: 4.6%
Current Price:
100.30
Entry Zone:
99.22 - 96.92
Take-Profit Targets:
1) 106.59
2) 112.99
3) 120.11
Stop Targets:
1) 90.95
Published By: @Zblaba
GETTEX:QNT BITGET:QNTUSDT.P #4h #Quant #RWA quant.network
Risk/Reward= 1:1.2 | 1:2.1 | 1:3.1
Expected Profit= +52.1% | +91.3% | +134.8%
Possible Loss= -43.6%
Estimated Gaintime= 1-2 weeks

QNTUSDT | Attractive Zone, But Buyer Strength Still LackingQNTUSDT left behind a clean demand zone on its way up, and that area could offer a decent long opportunity with the right confirmation.
However, if you ask for my broader view, I’m still cautious. Buyers haven’t proven enough strength yet. CDV isn’t convincing, and order flow lacks aggression.
That said, this week started with noticeable buyer presence across the board. If that momentum spills into QNTUSDT, this zone might hold and push price higher.
It’s early for full conviction, but not a bad place for a calculated entry — as long as risk is controlled.
📌I keep my charts clean and simple because I believe clarity leads to better decisions.
📌My approach is built on years of experience and a solid track record. I don’t claim to know it all but I’m confident in my ability to spot high-probability setups.
📌If you would like to learn how to use the heatmap, cumulative volume delta and volume footprint techniques that I use below to determine very accurate demand regions, you can send me a private message. I help anyone who wants it completely free of charge.
🔑I have a long list of my proven technique below:
🎯 ZENUSDT.P: Patience & Profitability | %230 Reaction from the Sniper Entry
🐶 DOGEUSDT.P: Next Move
🎨 RENDERUSDT.P: Opportunity of the Month
💎 ETHUSDT.P: Where to Retrace
🟢 BNBUSDT.P: Potential Surge
📊 BTC Dominance: Reaction Zone
🌊 WAVESUSDT.P: Demand Zone Potential
🟣 UNIUSDT.P: Long-Term Trade
🔵 XRPUSDT.P: Entry Zones
🔗 LINKUSDT.P: Follow The River
📈 BTCUSDT.P: Two Key Demand Zones
🟩 POLUSDT: Bullish Momentum
🌟 PENDLEUSDT.P: Where Opportunity Meets Precision
🔥 BTCUSDT.P: Liquidation of Highly Leveraged Longs
🌊 SOLUSDT.P: SOL's Dip - Your Opportunity
🐸 1000PEPEUSDT.P: Prime Bounce Zone Unlocked
🚀 ETHUSDT.P: Set to Explode - Don't Miss This Game Changer
🤖 IQUSDT: Smart Plan
⚡️ PONDUSDT: A Trade Not Taken Is Better Than a Losing One
💼 STMXUSDT: 2 Buying Areas
🐢 TURBOUSDT: Buy Zones and Buyer Presence
🌍 ICPUSDT.P: Massive Upside Potential | Check the Trade Update For Seeing Results
🟠 IDEXUSDT: Spot Buy Area | %26 Profit if You Trade with MSB
📌 USUALUSDT: Buyers Are Active + %70 Profit in Total
🌟 FORTHUSDT: Sniper Entry +%26 Reaction
🐳 QKCUSDT: Sniper Entry +%57 Reaction
📊 BTC.D: Retest of Key Area Highly Likely
📊 XNOUSDT %80 Reaction with a Simple Blue Box!
📊 BELUSDT Amazing %120 Reaction!
📊 Simple Red Box, Extraordinary Results
📊 TIAUSDT | Still No Buyers—Maintaining a Bearish Outlook
📊 OGNUSDT | One of Today’s Highest Volume Gainers – +32.44%
I stopped adding to the list because it's kinda tiring to add 5-10 charts in every move but you can check my profile and see that it goes on..

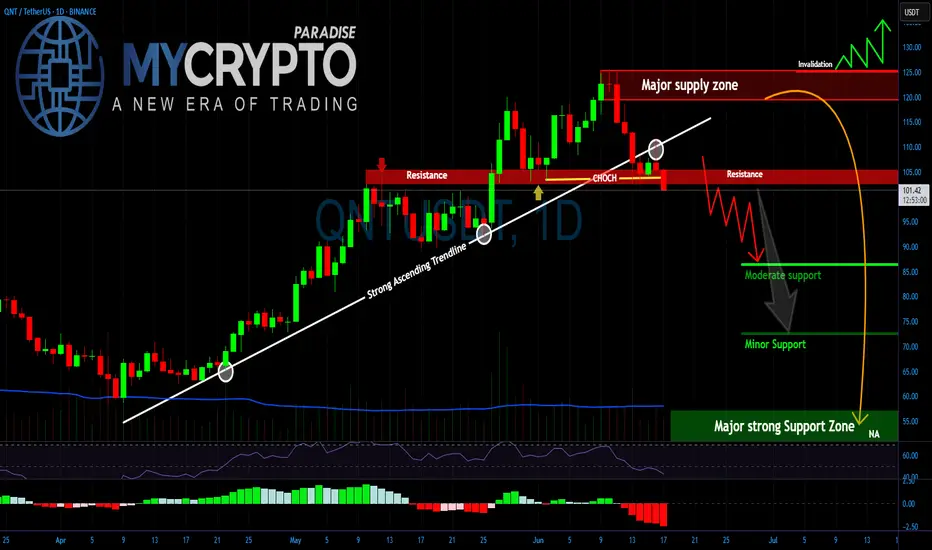
QNT Is Breaking Down — Are You ReadyYello Paradisers, Have you seen what just happened with #QNTUSDT? After weeks of grinding higher, the structure has cracked and that crack could turn into a landslide if you're not ready. This isn’t the time for hope or guesswork. It's the time for strategy.
💎#Quant has broken below a major ascending trendline that’s held since April, marking a pivotal shift in its momentum. The market just printed a clean Change of Character (CHoCH) around the $105–106 level, right at the confluence of a key support-turned-resistance zone. That CHoCH level, once a strong foundation for bullish continuation, has now flipped into a headwind. As long as the price stays below this range, we remain in the danger zone.
💎 Adding fuel to the fire is the major supply zone looming above, from $122 to $128. This area has already triggered rejection in the past and will now serve as the final invalidation for any short-term bullish dreams. A reclaim of this zone is highly unlikely in the near term, given the structure and momentum.
💎Now with the trendline cleanly broken and the market unable to hold higher lows, all eyes are on the lower support zones. The $85 region may provide a temporary cushion, but the real magnet lies deeper. We are closely watching the $72–75 area for signs of temporary relief, but the main high-probability reaccumulation zone is sitting all the way down at $55–60. This zone will likely attract smart money accumulation if the market gets there, it will not be by accident.
💎 This isn’t the time to be catching falling knives. Unless #QNT can reclaim the broken trendline and push back above the $106–110 range with conviction, the path of least resistance is down. That also means every lower high that prints now is an opportunity for trained eyes.
Stay ready. Stay focused. And always play the long-term game like a pro.
MyCryptoParadise
iFeel the success🌴
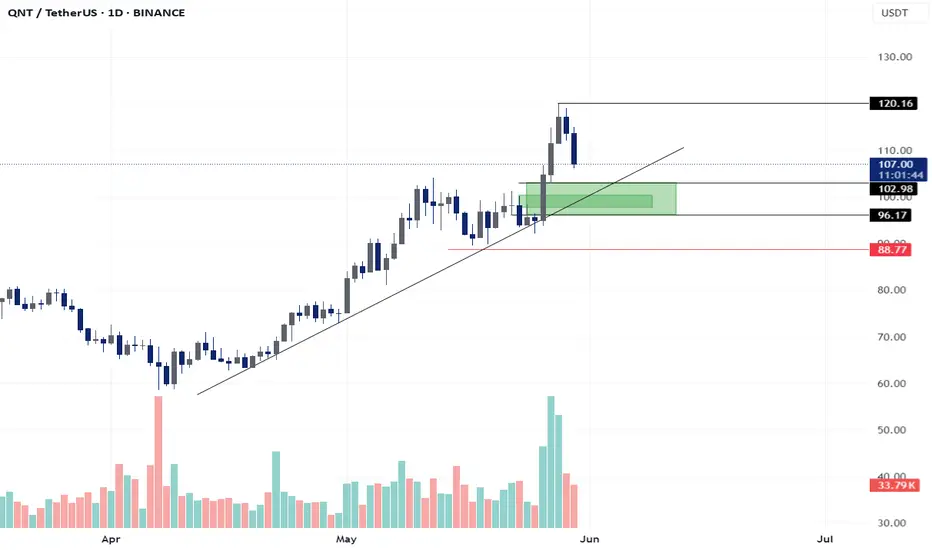
QNT - FVG Long Set-UPBINANCE:QNTUSDT
🔍 𝐊𝐞𝐲 𝐙𝐨𝐧𝐞𝐬:
Support Zone (Demand): $96.17–$102.98 (green box)
Former resistance turned support.
Aligns with ascending trendline – a critical confluence zone.
𝐒𝐭𝐨𝐩-𝐋𝐨𝐬𝐬 𝐋𝐞𝐯𝐞𝐥: $88.77
Below structural low and invalidation of bullish thesis.
Target Zone (Resistance): $120.16
Previous local high and psychological round numbe
#QNT/USDT#QNT
The price is moving in a descending channel on the 1-hour frame and is expected to continue upwards
We have a trend to stabilize above the moving average 100 again
We have a descending trend on the RSI indicator that supports the rise by breaking it upwards
We have a support area at the lower limit of the channel at a price of 86
Entry price 92
First target 98
Second target 103
Third target 110

QNTUSDT 2D AnalysisQNT ~ 2D Analysis
#QNT Buy on retesting this support block or buy after successfully breaking this resistance line with a short term target of at least 10%+.

TradeCityPro | QNT: Range Top Test in RWA Uptrend Structure👋 Welcome to TradeCity Pro!
In this analysis, I’m going to review the QNT coin — one of the RWA projects currently ranked 71 on CoinMarketCap with a market cap of $1.19 billion.
⏳ 4-Hour Timeframe
As you can see, there’s a clear uptrend along with a trendline that has pushed the price up to the 100.7 level.
💥 At the moment, the price has formed a range box between 93.1 and 100.7, with multiple touches on both ends. Currently, the price is testing the top of this range at 100.7 once again.
🔍 If the 100.7 resistance is broken, we can consider entering a long position. This trigger is valid for a long, and if confirmed, the price could potentially move toward the next target at 121.8.
✨ For a short position, we first need to see the trendline break and the 93.1 level get triggered. That would serve as our first confirmation of a possible trend reversal.
📉 A breakdown below the 50 level on the RSI would be the first momentum-based sign of this reversal. If selling volume also increases at the same time, we’ll have confirmation of a volume divergence.
⚡️ On the other hand, a break of the trendline itself might act as an early trigger, but I personally wouldn’t open a position on that alone — it’s too risky. As long as the price holds above 93.1, the overall uptrend remains intact.
📝 Final Thoughts
This analysis reflects our opinions and is not financial advice.
Share your thoughts in the comments, and don’t forget to share this analysis with your friends! ❤️

QNT is about to take off like a rocket soon (1D)The higher structure of QNT is bullish, but its internal structure has turned bearish.
Therefore, we can look for buy/long positions in fresh and unmitigated Demand zones.
Targets are marked on the chart.
A daily candle closing below the invalidation level will invalidate this analysis.
Do not enter the position without capital management and stop setting
Comment if you have any questions
thank you

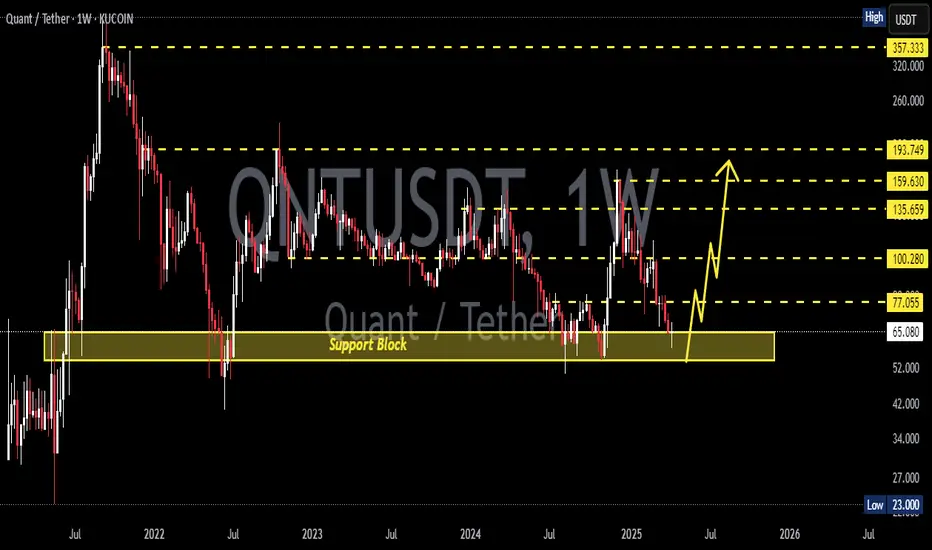
Quant's 2025 All-Time High Potential Revealed In This AnalysisQuant has been producing higher lows since June 2022, a solid base.
QNTUSDT is about to close its fourth week green and this week is a full green candle. A strong advance/bullish breakout and months of bearish action recovered to now trade within the bullish zone.
What is happening here is the same dynamic that will be happening across all the Altcoins. After a major low on 7-April we get growth, growth, growth. Allow for small swings because the market never moves straight down nor straight up, it fluctuates creating waves.
Down-waves, up-waves but something is certain, higher highs and higher lows long-term. We are now within a strong bullish phase.
The high in December 2024 produced the highest prices since October 2022 and was corrected to a long-term higher low. A higher high will happen next comes next and this is the beginning of this higher high. The easy target being $211 and this is a higher high but for this higher high to be technically relevant it has to go even higher so we are aiming for $230 or higher, $310.
Will Quant go beyond $310? It is possible and do-able, also highly probable. The $410 target is a strong target but can be done. Can I be honest with you? It is possible that Quant moves even higher producing a new All-Time High by the time the 2025 bull market runs its course.
Find more details on the chart.
Namaste.

TradeCityPro | QNT: Ranging Near Key Resistance in RWA Favorite👋 Welcome to TradeCity Pro!
In this analysis, I want to review the QNT coin for you. This project is one of the RWA projects that has been heavily hyped in recent months.
✔️ Currently, this coin has a market cap of $908 million and ranks 72 on CoinMarketCap.
⏳ 4-Hour Timeframe
On the 4-hour timeframe, as you can see, there is an upward trend along with a curved trendline that has caused the price to move from the bottom of 59.9 to 76.8.
💫 After the price reached the resistance at 76.8, a ranging box has formed, and volume has also been decreasing. A temporary support bottom has formed at the 73.8 area, and the price is ranging between these levels.
📊 Now, with the ranging box that has formed, the price has reached the curved trendline, and this trendline can potentially lead to bullish momentum entering the market.
💥 On the other hand, the RSI oscillator is also on important support at the 50 level, and if the price is supported by this trendline, the RSI moves upward again, and volume increases, we can enter a long position with the breakout of 76.8.
🔍 An important point about this entry is that there is a very strong resistance at the 80.1 area, and if you enter a position on the breakout of 76.8, you probably won't see much profit until the price reaches 80.1.
🎲 So basically, the 76.8 trigger is a preliminary trigger for the breakout of 80.1, and if I open a position on the breakout of 76.8, I won’t close it at 80.1 and will wait to see if the price breaks through the 80.1 area or not. In my opinion, this position is worth the risk because if 80.1 breaks, a very large reward could result from this position.
🔽 But if you want to take less risk, you can wait and open your position with the breakout of 80.1 itself. Naturally, since this area is a major resistance and the entry point is higher than 76.8, opening a position at that level will be harder and the likelihood of getting a proper confirmation candle is lower than with 76.8.
📉 For a short position, if we want to get a trigger from the chart itself, considering the decreasing volume and price reaching the curved trendline, if this trendline breaks and the 73.8 trigger is activated, we can enter a position. RSI confirmation would also be the break of the 50 area, and with that break, we could also get momentum confirmation.
🔑 But the point is that we must also consider market conditions. For example, in the current market conditions, the overall trend of Bitcoin and indexes like Total and Total2 has been bullish in recent weeks, and we can’t get bearish confirmation from these indexes.
✨ So it's possible that with the break of 73.8, the price moves downward, but because the indexes I mentioned also affect altcoins, with the continuation of their bullish trend, the downtrend of QNT may come to an end and its trigger may become a fakeout. That's why it’s better to wait for Bitcoin and the indexes to confirm a trend reversal before looking for short triggers.
📝 Final Thoughts
This analysis reflects our opinions and is not financial advice.
Share your thoughts in the comments, and don’t forget to share this analysis with your friends! ❤️

QNT is breaking out of the descending wedge upper trend line.QNT is now starting to trade outside the upper trendline of the descending wedge and is likely to make an attempt to move toward the equilibrium zone—or close to it.
This will be interesting to watch.
Good luck, and always use a stop-loss!

QNTUSDT 1WQNT ~ 1W Analysis
#QNT Buy gradually from here if you still have a Conviction on this coin with a short -term target of at least 15%+.
QNTUSD - Bullish PhaseGood tokenomics.
Medium caps entering a bullphase.
QNT is at a good level.
Thank you,
St.Gex
Not a trading advice!

QNT could double in price quicker than you think!The QNT charts are looking incredible right now, and all ISO 20022 tokens are now exhibiting the same, or very similar, internal five-wave patterns that I believe are about to move up to the next level.
Although I don't own any QNT and have no plans to, many of my followers do. Either way, the charts are starting to look like a nice slice of cherry pie.
Good luck, and always use a stop loss!

QNT analysis (12H)The price appears to have completed an ABC pattern and is now in wave D or X. The red zone is where sell/short positions can be considered.
Targets are marked on the chart.
A daily candle closing above the invalidation level will invalidate this analysis.
For risk management, please don't forget stop loss and capital management
Comment if you have any questions
Thank You

Good moment for buy QNT.Good moment for buy QNT. We are moved down and do not update local low. Will try to take the position when market will move down to test local low. The stop around point where was not updated the low for get good risk reward ratio. Will see...

#QNT Ready For Bullish Rally Despite Bearish Market Sentiment Yello, Paradisers! Is #QNTUSDT About to Break Out, or Will Bears Keep It Trapped? Let's check the latest setup of #Quant and see what might happen next:
💎#QNT has been trapped inside this wedge for months, making lower highs and lower lows. #QNTUSD is showing signs of a potential breakout, but there’s one key resistance level above that could decide everything.
💎Bulls need to break above $115, which has been a major rejection point. A clean breakout here could trigger a rally towards $140-$160, where the next strong resistance zone is waiting. The MACD is showing higher highs while price made lower lows, a classic bullish divergence. This signals that momentum is shifting in favor of buyers.
💎Strong support is around $80-$85, where buyers have stepped in multiple times. Losing this level would lead to a drop to $61-$55, the next major support zone. The Bulls have defended both of these levels before, so they will probably do so this time, too.
💎However, if the bears drag the price below the $55-$61 support level, the bullish setup will be invalidated. In such a case, the bears will drag the price to down levels further.
Stay focused, patient, and disciplined, Paradisers🥂
MyCryptoParadise
iFeel the success🌴

QNTUSDT - Price Projection & StrategyThe current QNT price action presents two key scenarios:
🔴 Bearish Path (Red Line)
QNT could first drop to ~$35 before establishing a strong support level, setting up for a major reversal.
🟢 Bullish Path (Green Line)
If QNT maintains current support levels and breaks resistance, it could enter a strong uptrend.
A steady climb could lead to key Fibonacci retracement levels around $313 - $346.
If momentum continues, price targets could extend toward $665+.
Profit-Taking Strategy
I plan to take profits at green box zones:
✅ First major target: $313 - $346
✅ Ultimate target: $665+

Quant (QNT): Entering a Bullish ScenarioStrong Upside Potential
Quant (QNT) has officially entered a bullish phase, as the price refused to drop below $84, signaling a strong buying zone and market confidence. Currently trading at $106, QNT is showing momentum to easily break through key resistance levels at $130 and $170 in the coming months.
If the bullish trend continues, QNT could be on track to challenge its all-time high and potentially set a new record by the end of 2025.
Key Levels to Watch
Support Zone: $84 (strong rejection area, confirming bullish sentiment).
Short-Term Resistance: $130 (first breakout level).
Mid-Term Target: $170 (key area before testing new highs).
Long-Term Potential: New all-time high by late 2025, depending on market conditions and demand for QNT’s blockchain solutions.
Conclusion: QNT Positioned for a Major Breakout
With solid support at $84 and a strong push above $106, QNT is poised for a significant rally. The next major moves include breaking $130 and $170, which would set the stage for a new all-time high by the end of 2025.

HMSTRUSDT UPDATEHMStrUSDT is a cryptocurrency trading at $0.0017. Its target price is $0.0023, indicating a potential 30%+ gain. The pattern is a Falling Wedge, a reversal pattern signaling a trend change. This pattern suggests the downward trend may be ending. A breakout from the wedge could lead to a strong upward move. The Falling Wedge is a positive signal, indicating a potential price surge. Investors are optimistic about HMStrUSDT's future performance. The current price may be a buying opportunity. Reaching the target price would result in significant returns. HMStrUSDT is poised for a potential breakout and substantial gains.
