SPY/QQQ Plan Your Trade Update : EPP Flag Setup CompleteI created this video to highlight the current EPP Flag setup in the SPY/ES.
It is my opinion that the market are about ready to ROLL OVER into a downward trend because of this current EPP setup.
Once the FLAG forms (in this case a BULLISH FLAG), the next phase is a BREAKDOWN INTO CONSOLIDATION.
It is my belief the current FLAG will prompt a breakdown in price - moving into a lower consolidation range.
I'm highlighting this EPP pattern to help everyone learn how to use them more efficiently.
Get ready. If I'm right, we're going to see a big move downward over the next 2-4+ days.
Get some...
#trading #research #investing #tradingalgos #tradingsignals #cycles #fibonacci #elliotwave #modelingsystems #stocks #bitcoin #btcusd #cryptos #spy #gold #nq #investing #trading #spytrading #spymarket #tradingmarket #stockmarket #silver
QQQ

SPY/QQQ Plan Your Trade for 4-24 : Carryover PatternToday's Carryover pattern suggests we'll see similar price action today to what we saw yesterday.
We will very likely see a little support in early trading today, followed by a moderate meltdown-type trend.
I'm not expecting much to happen today - but we could get some news or other data that may prompt some type of bigger move in the markets.
Yesterday evening, I shared an "Update" video with everyone. In that video, I highlighted some of my active trades.
I've gotten a few messages from followers asking if I can share more data related to my trades. I'm sorry, but that won't happen in these FREE Plan Your Trade videos.
I shared some of my trades yesterday to highlight how I had moved into a moderate Short/PUT position, trying to stay ahead of the bigger market trend.
In other words, I'm not chasing the nickels. I'm setup to try to profit from the DOLLARS.
Gold and Silver may stay somewhat muted over the next 48 hours. But, I do expect them to try to melt upward.
BTCUSD appears to be setting up a BULL TRAP. I, personally, don't trust this upward price move because it is counter to the EPP price structure. I could be wrong.
But right now, I just don't trust the upside move in BTCUSD, knowing the SPY/QQQ should move into a deeper MAJOR LOW in early May.
Again, these videos are designed to help you build your skills and find your own style of trading.
I really do hope all of you are benefiting from my continued work to deliver these videos.
GET SOME...
#trading #research #investing #tradingalgos #tradingsignals #cycles #fibonacci #elliotwave #modelingsystems #stocks #bitcoin #btcusd #cryptos #spy #gold #nq #investing #trading #spytrading #spymarket #tradingmarket #stockmarket #silver

QQQ - Your guess is as good as mineMarkets are all over the place. I know ground breaking info. I don't think there is any clear answer to what is next.
Even if Trump does reduce tariffs on China, they are still going to be some of the highest in recent history. However, it looks like Trump has flinched and China has the upper hand. That is just likely going to make Trump more erratic since his policies are emotional/ego driven and not strategic.
Overall, there are likely some short-term gains to be have as the market likes to always push up when not in an panic sell. For now, the worst of the news is over and the low from the other week is likely going to be the bottom for the near future. I expect stock to continue this up and down until the tariffs work there way through the system and we see the true effect on the economy.
We punched above the 20 day SMA yesterday and will likely test it for support today and tomorrow. If it holds, I wouldn't be surprised to see prices test the 200 day. Hard to know what crazy stuff Trump will do over the weekend, so we will have to see. Good luck and enjoy the ride.
$PLTR Trade: Buy $90.86 , Target $101.35Beep Beep. Hope everyone is taking care of their trading accounts during this volatile phase in the markets. I noticed an identical setup on the weekly from back in August 24' and I'm looking to take advantage. We have a trend reversal on the Tom Demark sequential that helps identify trend exhaustion through a 9 Count. Currently on a 2 Count, we're testing the gap while simultaneously testing the 10WMA at 90.86.There is also a weekly gap at 101.35 ... Entry would be the 10WMA. Target the weekly Gap. Trade is as follows:
Trade Idea - Swing NASDAQ:PLTR $95 Calls 4/25
Entry - 10 WMA @ $90.86
Target - Gap on Weekly at $101.35

SPY/QQQ Plan Your Trade Update For 4-23 : Rally-111 PatternToday's pattern really showed up pre-market.
Where was the rally today? It happened before the US markets opened for business.
The SPY/QQQ had already moved up into my upper resistance area on strong buying overnight.
I knew I had to run my father around most of the day, so I booked my profits this morning and tried to catch one little SPY rally (that didn't work out).
So, I started taking some positions for next week's potential downtrend, and I thought, "How much risk am I taking on these trades if the markets continue to move upward?"
I realized I would be taking about $1000 to $1400 in total risk, but my expiration date is near May 16. So my target for any profit really needs to be before May 10th or so.
If the markets do what I expect, I'll be sitting back, watching my profits grow as the markets trend downward into my May 2 Major Bottom (I hope).
I created this video to highlight the now partially confirmed inverted EPP pattern that setup the Ultimate High in early trading today.
Now that we've completed the inverted EPP pattern, we should be looking for the ES/SPY/QQQ to move downward, shift into a sideways/upward price flag. Then, break down into the new Consolidation phase.
Essentially, if my EPP patterns play out well, I timed my move away from longs/calls and into shorts/puts almost perfectly. Now, I just need to sit back and wait for the markets to make a move.
This is what trading is all about. You can't kick the markets to do what you want them to do. You have to learn to take what the markets give you and fall in line with market trends.
When you do that well, profits start to fall into your lap (if you are patient).
Follow along as I break down these market trends and learn how to develop your own skills.
GET SOME.
#trading #research #investing #tradingalgos #tradingsignals #cycles #fibonacci #elliotwave #modelingsystems #stocks #bitcoin #btcusd #cryptos #spy #gold #nq #investing #trading #spytrading #spymarket #tradingmarket #stockmarket #silver

April 23 Trade Journal & Stock Market Analysis April 23 Trade Journal & Stock Market Analysis
EOD accountability report: +2325 on Eval, didn't trade funded
Sleep: 10 hour, Overall health: :check:
— 9:00 AM Market Structure flipped bullish on VX Algo X3!
— 11:30 AM Market Structure flipped bearish on VX Algo X3!
— 12:30 PM VXAlgo ES X1 Buy signal (triple buy signal) B+ set up
— 1:33 PM VXAlgo YM X1 Sell Signal (triple sell signal) B+ set up
— 1:55 PM Market Structure flipped bullish on VX Algo X3!
— 2:30 PM Market Structure flipped bearish on VX Algo X3!
— 3:31 PM VXAlgo ES X1 Buy signal (double signal)
Next day plan--> Short 48m MOB
Video Recap -->

The Graveyard Of Hope!The Graveyard of Hope is littered with "Buy The Dippers."
How many times can "Buy The Dippers" lick the stove before they finally learn their lesson not to believe anything Trumpchenko says?
The Elona MAGA algorithm goes like this
Over promise
Under deliver
Lie
Declare victory
Leave or Victim Blame
Meanwhile, the economy falls into an economic recession/depression abyss!
I am A political. I call it as I see it. My religion is Economics, Charts, and money. They don't lie!
Click Boost, follow, and subscribe. Let's get to 5,000 followers so I can help more people navigate these crazy markets.
Don't smoke the hopium crackpipe. It will financially ruin you.

CHIP SECTOR TO CRASH SMH The chart posted is the SMH we are now in the final 5th wave and it is a classic 5th wave Diagonal in the 5th wave wave to form a double top into fib cycle peak .From here we should see a major break down in All chip stocks into Oct 2025 but we should see the first leg down low march 10/20th 2025 this should be a Very Bearish action world wide see spy and qqq as well . This is the warning to All traders EXIT INTO RALLIES THE BEST OF TRADES WAVETIMER

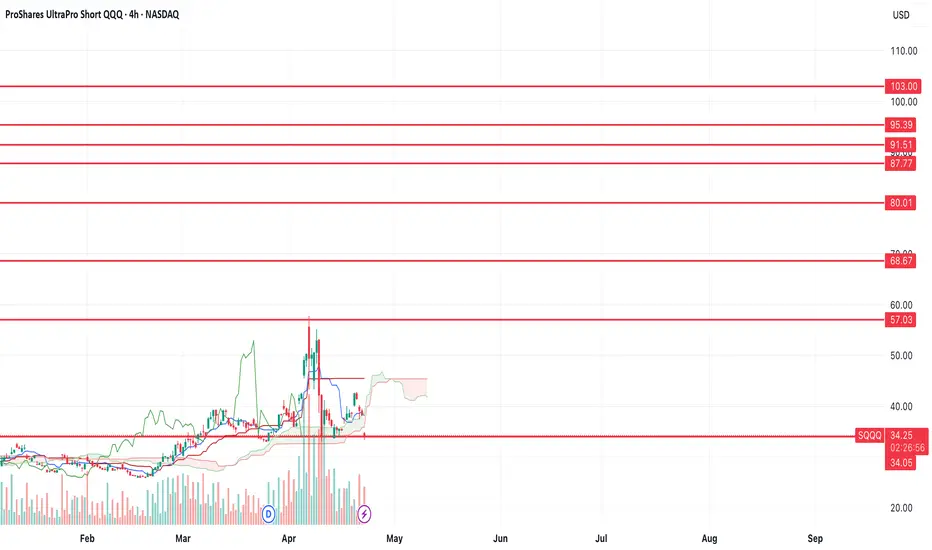
$SQQQ - $68-103 targetIf we look at the chart of SQQQ, we can see that we're holding support here at the $34 level.
If we continue to hold here, we'll have a failed head and shoulders breakdown. I think if we can break the highs at $57, it is very likely that we'll see $68+.
Let's see how it plays out in the coming weeks.
SPY/QQQ Plan Your Trade For 4-23 : Rally-111 PatternToday's RALLY pattern suggests the SPY/QQQ will continue to push higher, possibly breaking upper resistance near $550/493.
As I suggested in this video, I believe the upward price trend bias will continue into Friday (4-25) and suddenly shift into a BEARISH price trend/bias early next week.
The May 2-5 Major Bottom cycle low, my research predicts, will happen and should prompt a fairly strong downward price trend as we near the end of April and head into early May.
Gold and Silver will likely consolidate a bit over the next 24-48 hours. So, this is a great time to pick lower entry price levels for LONGS/CALLS.
Ultimately, I'm still expecting Gold to rally above $3750 before the end of May and attempt to target $4500++ before the end of June.
BTCUSD is moving into a potential "INVALIDATION" phase. Although I'm currently estimating the probability of that invalidation at about 20-30%, it is still a valid price trend.
I believe BTCUSD will shift into a downward price trend as the markets continue to unwind excesses through the May, July, and October lows, according to my cycles.
The big opportunity for traders over the next 48 hours is playing the upward trend bias in the SPY/QQQ - then moving into a mode of preparation for next week's breakdown/downward price trend in the SPY/QQQ.
So, play it smart. Follow the chart and don't try to be a superhero.
Play what is in front of you and prepare for the bigger price swings headed into next week and beyond.
Get some.
#trading #research #investing #tradingalgos #tradingsignals #cycles #fibonacci #elliotwave #modelingsystems #stocks #bitcoin #btcusd #cryptos #spy #gold #nq #investing #trading #spytrading #spymarket #tradingmarket #stockmarket #silver

April 22st Trade Journal & Stock Market Analysis** April 22st Trade Journal & Stock Market Analysis**
EOD accountability report: +325
Sleep: 3 hour, Overall health: tired
**Daily Trade Signals based on VX Algo System**
— 9:00 AM Market Structure flipped bullish on VX Algo X3!
10:20 AM VXAlgo NQ X1 Sell Signal
10:30 AM VXAlgo ES X1 Sell Signal
10:51 AM VXAlgo ES X1 Sell Signal
11:20 AMVXAlgo ES X1 Sell Signal (Triple signal) C+ set up
1:12 PM VXAlgo NQ X3 Sell Signal (Double X3 signal)
1:30 PM Market Structure flipped bearish on VX Algo X3!
3:00 PM Market Structure flipped bullish on VX Algo X3!
3:10 PM VXAlgo ES X1 Sell Signal (Triple signal) C+ set up

SPY/QQQ Plan Your Trade Update For 4-22 : EPP StructuresThis video highlights why the Excess Phase Peak pattern is so important for traders to understand and follow.
Imagine being able to see into the future and to be able to plan/project price action in a way that is like putting together building blocks (or Leggos).
That is what the Excess Phase Peak pattern represents for all traders.
Once you understand it and learn to use it, you'll see how it presents very clear opportunities for you to plan and execute fantastic trades in any market.
Fibonacci Price Theory, Energy Cycles, & The Excess Phase Peak patterns are really the core structures of price.
Elliot Wave is fantastic for "after the fact" type of analysis. IMO, you don't really know how the EW count is truly structured until after the current major wave structure is complete (meaning you are 2-3 waves into the new (counter-trend) structure.
Watch this video and try to think about how I'm taking the EPP patterns to learn to plan out opportunities for price based on STRUCTURE - not indicators or averages.
This is how the markets work.
Pay attention and GET SOME.
#trading #research #investing #tradingalgos #tradingsignals #cycles #fibonacci #elliotwave #modelingsystems #stocks #bitcoin #btcusd #cryptos #spy #gold #nq #investing #trading #spytrading #spymarket #tradingmarket #stockmarket #silver

SPY Plan Your Trade For 4-22 : Breakaway In Counter TrendToday's pattern suggests the markets are moving in a counter-trend mode and that we may see a Breakaway type of price bar.
The current trend is Bearish. Thus, I believe the current Counter-Trend is Bullish.
As many of you already know. I picked up some Calls off the lows yesterday after noticing a complete EPP pattern (Ultimate Low) setup about 75 minutes before the end of the regular trading day on 4-21.
My opinion, overall, is that we are still stuck within a consolidation phase. But that doesn't mean we can't see the SPY/QQQ move higher (toward the upper consolidation high) or roll back downward (toward the lower consolidation low).
I do believe we are moving into a moderate upward price trend over the next 3-4+ days where price will attempt to retest the 525-535+ level on the SPY, then ROLL into a top and start a sharp downtrend.
This volatility presents an incredible opportunity for traders. Staying ahead of these trends is key to improved success.
The SPY Cycle Patterns are fairly clear. We've moved into consolidation, and the price is very volatile. The Counter Trend pattern today may setup a 3-4+ day minor rally in the SPY/QQQ.
But, ultimately, I believe the SPY/QQQ will roll downward into the May Cycle lows - just as I have been predicting for the past 45+ days.
Don't get greedy. Play the immediate trend and learn to identify the EPP patterns on 5-minute charts.
Today should be a very good day for traders.
Get some.
#trading #research #investing #tradingalgos #tradingsignals #cycles #fibonacci #elliotwave #modelingsystems #stocks #bitcoin #btcusd #cryptos #spy #gold #nq #investing #trading #spytrading #spymarket #tradingmarket #stockmarket #silver

Plan Your Trade Update For 4-21 : Waiting For The EPP SetupThis video is, hopefully, going to help many of you learn to use the Excess Phase Peak (EPP) pattern more efficiently.
For months, I've been trying to teach all of you to use this pattern to efficiently identify and trade some of the biggest price moves.
Remember, price only does TWO THINGS - TREND or FLAG.
These components are essential to the EPP pattern setup.
First, price must TREND into a peak or trough.
Second, price must pullback from the peak or trough.
Third, price must move into a SIDEWAYS/FLAGGING formation.
Forth, price must break away from the sideways/flagging formation and attempt to TREND into the new consolidation phase.
Fifth, once the new consolidation phase starts, price will trend and flag within the consolidation range for a period of time - before...
Sixth, price will attempt to break up or down to the Ultimate High/Low.
This chart of the ES/SPY will show you how I used my analysis to "front-load" my positions before the Easter holiday weekend.
I've been telling all of you the markets would likely attempt to move a little bit higher, trying to target 525-535 (if we are lucky). Then, price would roll into a topping formation and move downward towards my May 3-6th low (estimate).
Last Thursday, I decided to throw on two positions to protect against any big news that may cause the markets to collapse over the holiday weekend.
I picked up :
4 SDS CALL options @ $23 expiring on May 16
3 XLF PUT options @ $47 expiring on May 16
Both of those trades worked out perfectly this morning. I booked 2 of the XLF and 2 of the SDS for profits near 1030 AM PT. Lovely.
Next, in between phone calls and loading up my car for a short trip, I noticed a beautiful EPP pattern setting up in the ES, and that EPP pattern has already reached what I believe to be the Ultimate Low.
I tried to get into 2 SPY Call options @ $512 and held my breath to see if I timed the entry well.
NOT.
I took a $280+ loss on those two Calls.
I waited a bit longer to see what price did, and after the price setup a base below $510 on the SPY, I loaded up on two more SPY Calls @ $510 and two SSO calls @ $67 about 70-80 minutes before the end of trading.
The way I looked at it, I already had my downside trades placed from last Thursday, and I just added some upside exposure while my downside trades were profitable.
I didn't know if the SPY would rally or not, but the EPP Ultimate Low setup suggested NOW is the time to buy.
So, I kept both downside and upside trades active to protect my account overnight.
The SPY rallied into the close, and I ended up making some nice profits off that EPP Ultimate Low.
Now, I'm going to wait to see what happens tomorrow morning and try to BOOK my upside trades in profits while letting my longer-term downside trades play out into early/mid May.
This is trading. The entire purpose of trading, like I trade, is to position for the best opportunities and try to catch the GIFTS the market throws at you as often as possible.
Nothing is guaranteed, but price ultimately shows us everything we need to know.
Watch this video to see if you understand the EPP Ultimate Low that prompted me to buy my CALLS today.
If so, then you are starting to GET IT, and that is a very big step towards improving your trading skills.
Get some.
#trading #research #investing #tradingalgos #tradingsignals #cycles #fibonacci #elliotwave #modelingsystems #stocks #bitcoin #btcusd #cryptos #spy #gold #nq #investing #trading #spytrading #spymarket #tradingmarket #stockmarket #silver

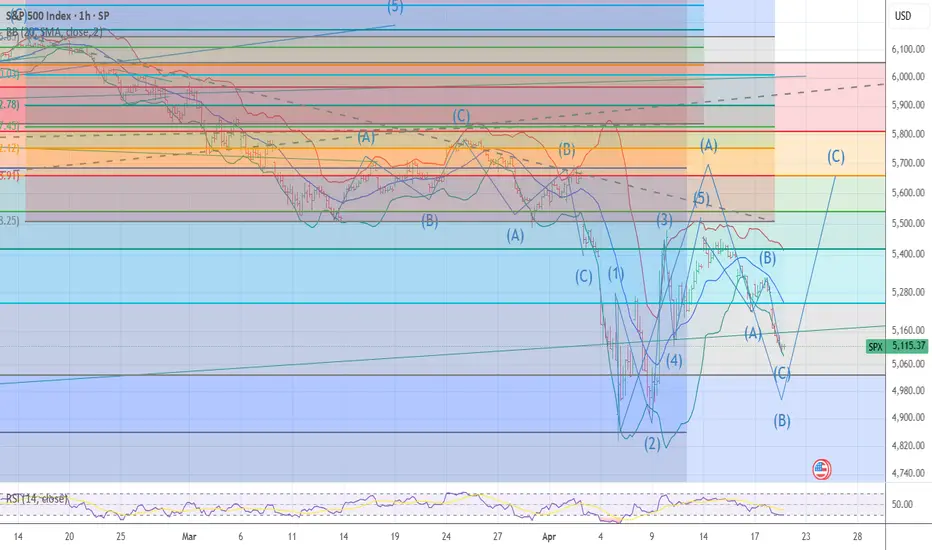
Noise, S&P Scenario, Gold BubbleThank you to the tradingview community for engaging and supporting my content.
After another rough start to the week, we have a bit of a crossroads ahead for the S&P
1) We revisit the April 7 lows and poke lower with bear trap opportunities
2) We hold Monday April 21 lows and grind back up to gap fill and revisit 5400-5500 resistance
3) We go nowhere with a lot of intraday volatility and noise (between the April 7 low and the April 9 high)
The markets are on high alert
DXY
Gold
Bitcoin
US Bonds vs Treasuries (yields rising)
Trump is more vocal about threatening the FED or firing Powell and the concern is truly unprecedented
Trade War pause is still ongoing, China is being vocal as well to make sure countries don't simply line up to support the US. For all of this to calm down, US and China have to play nice. China is likely able to hold the line longer than the US in the near-term
Thanks for watching!!!

$QQQ - Headed for the Next Leg DownNASDAQ:QQQ - Headed for the Next Leg Down
Bearish Wedge broke down today!
Measured Move: $377.15
Measured Timeframe: 06May
Below my H5_D Indicator and the Wr% is in motion down to the Green Barrier.
All signs are pointing LOWER!
Not Financial Advice

I am CALLING A BOTTOM TODAY I MOVED95% long 5109/5079 today The chart posted is the sp 500 I called for a sharp decline back to 5100 it has formed a ABC down I look for a sharp rally back to 5644/5669 Now before the next leg down today is wave Blow ,Best of trades WAVETIMER
$TSLA in penalty box. Stock remains range bound. After the new administration was elected in Nov 2024, AMEX:TSLY stock had a huge bull run since then. It doubled between Nov 2024 to Dec 2024. Since the stock has sold off heavily and has lost more than 50% of its value. It recently bounced back from the lows of 214 $ which was the 0.785 Fib Retracement level if we plot the Fib levels from its highs to the lows. And then it bounced back lower 254 $ which is the 0.618 Fib Level.
AMEX:TSLY is steadily trading within these 2 Fib levels and seems that it fails to break out of this pattern. The stock seems to build a base between 250 and 214 which can be a good place to accumulate the stock. With Elon distracted by DOGE affairs it seems we are missing any catalyst for this stock. So NASDAQ:TSLA fans can keep on accumulating here and wait for a breakout. But to all my NASDAQ:TSLA fans there are already breaks out in other large caps in progress. Look at $MSFT. More regarding NASDAQ:MSFT in the upcoming blogs
Verdict: NASDAQ:TSLA accumulate between 214 – 250 $ if you need to. Else look for other mega caps.

NVDA Rounding Topping Pattern!I started warning about NASDAQ:NVDA back on Nov. 4th, 2024, and we all saw a healthy -30% decline since then.
Updating that chart reveals a rounding topping pattern in place. Despite the 30% collapse, the pattern remains as bearish as ever.
CAUTION is in order!

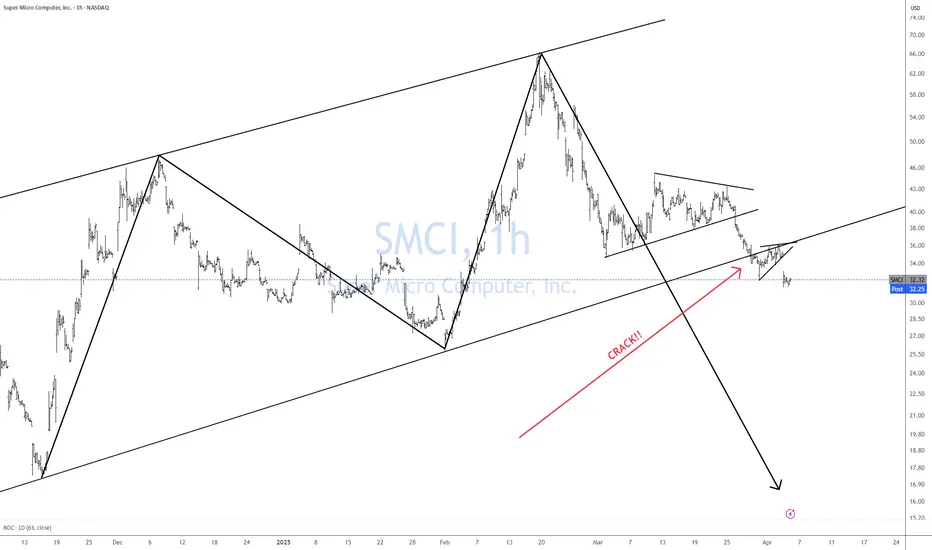
SMCI CRACK!!I called the absolute top in SMCI back on April 4th, 2024.
see chart below.
This year I am once again calling a CRACK!! lower. No, it is not seasonal it is just happenstance. ))
This is a very simple trade as most of my trades are.
Bulls take your money and GO!!
$2.29 to $20.00 in massive +773% $UPXI while overall market redDoes it get any better than this? Finding a power runner stock of the day in early premarket which turns out to run $2 to $20 in about 2 hours while the rest of the market drops to new lows of the year?
NASDAQ:UPXI

SPY/QQQ Plan Your Trade For 4-21 : Inside Breakaway PatternToday's Inside Breakaway pattern may not show up as I would expect.
An Inside Breakaway pattern suggests the OPEN will be within the Body range of the previous bar - I don't see that happening today.
The Breakaway portion of the pattern is much more likely to happen today with Gold/Silver moving much higher and BTCUSD moving slightly higher today. It appears Safe-Haven assets are THE THING right now.
That would suggest the US Dollar and US-Dollar based assed would continue to fall (move downward) as devaluation and contraction in the global economy continues to play out.
If you watched my video (posted late last night), you already know my data suggests there is almost no reason for the markets to mount a rally right now. The only thing I can see that would drive a big rally from these lows would be some incredible news that the world is immediately going back to somewhat normal in terms of GCB spending and Global Trade. I don't see that happening.
I know there are a lot of emotions related to these Tariff wars and global trade. Heck, almost anything that goes on in the world right now is full of emotions.
I urge all traders to STEP BACK. Think of the markets like an engine that runs on the quality of AIR, FUEL, SPARK, LUBRICATION, STRUCTURAL MECHANICAL PARTS, & INTAKE/OUTPUT CAPACITY.
If you start to think about the markets (global markets) as a big engine, while thinking of individual economies (by country) as smaller engines, it starts to make a little more sense (at least in my mind).
Every country runs its own engine (see the components above). If some of those components are failing, then that country's economy will falter a bit.
And that faltering economy may put additional pressure on the global economy/engine.
It takes a lot to destroy a functional economy. I mean A LOT. War, Total Destruction of government/law/society. Maybe even some type of internal conflict.
But, even then, the economy will still have roots and will fall back to core elements.
So, don't worry about all of these people telling you "the world is going to CRASH in the next 2 years because of Trump". That is highly unlikely.
What is more likely is that the world will "re-settle expectations" related to future growth and output. Strengthening economies where needed and building up the core elements of global trade/economies over many months.
So, if you are worried or don't know what to do right now, move your positions into CASH and wait it out a bit.
There will be lots of opportunities for you to pick the right time to start trading again.
There is no reason why you have to try to FORCE the markets to adhere to your wants (they never do that anyway).
Just wait it out, keep learning, and plan/time your trade efficiently.
Get some...
#trading #research #investing #tradingalgos #tradingsignals #cycles #fibonacci #elliotwave #modelingsystems #stocks #bitcoin #btcusd #cryptos #spy #gold #nq #investing #trading #spytrading #spymarket #tradingmarket #stockmarket #silver

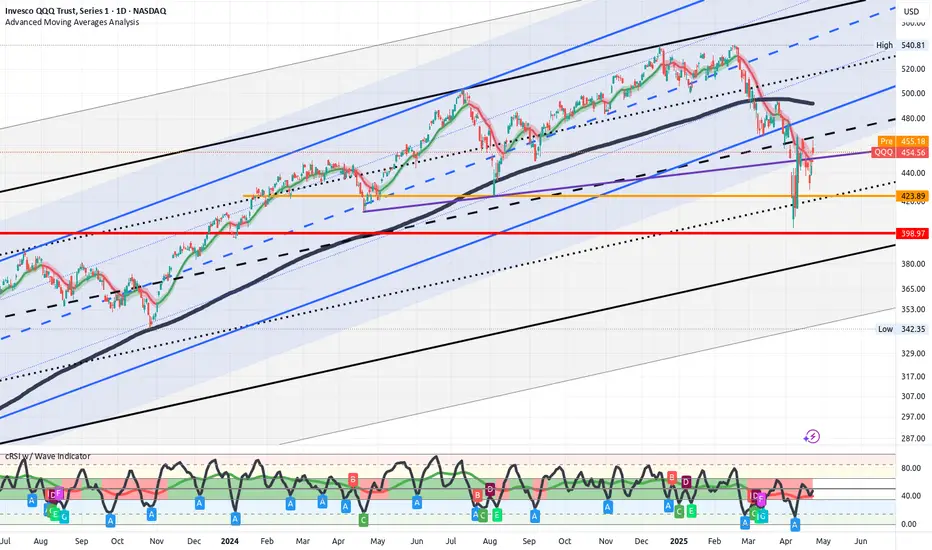
QQQ, Weekly RSI has reached oversold territory just 4 other timeIt's also came at or near a long-term bottom.
If you're a long-biased trader looking for high-probability entries, this setup deserves your attention.
The weekly RSI just hit oversold territory — something that’s only happened 4 times in the last 10 years. Each of those times? It marked a major bottom or the start of a strong bullish trend.
We’re also bouncing near long-term horizontal support (~$420) and holding above a rising trendline that’s defined the bull market since 2018.
If price continues to hold this zone and RSI starts curling back up, I’ll be looking to go long.
Stop below $420. Reward-to-risk looks solid if momentum confirms.
Not calling the exact bottom — just positioning where the risk makes sense.
