$QQQ - All eyes on the $472.88 LowNASDAQ:QQQ - The rally off of the lows has been in three waves thus far. For the downtrend to continue, price must take out 472.88 . If not, the market could unfold a double zigzag or a more bullish scenario, i.e. a 1-2/i-ii setup.
QQQ

3/21 Gap Fill Bullish BounceUS indices are poised to fill downside gaps from Friday's close. Could be good for a bounce w/ upside cash gap targets higher.

SPY/QQQ Plan Your Trade For 3-28-25 : Carryover in Counter TrendToday's pattern suggests the SPY/QQQ will attempt to move downward in early trading. The SPY may possibly target the 564-565 level before finding support. The QQQ may possibly attempt to target the 475-476 level before finding support.
Overall, the downward trend is still dominant.
I believe the SPY/QQQ may find some support before the end of trading today and attempt to BOUNCE (squeeze) into the close of trading.
Gold and Silver are RIPPING higher. Here we go.
Remember, I've been telling you of the opportunities in Gold/Silver and other market for more than 5+ months (actually more than 3+ years). This is the BIG MOVE starting - the BIG PARABOLIC price rally.
BTCUSD has rolled downward off the FWB:88K level - just like I predicted. Now we start the move down to the $78k level, then break downward into the $58-62k level looking for support.
Love hearing all of your success stories/comments.
GET SOME.
Happy Friday.
#trading #research #investing #tradingalgos #tradingsignals #cycles #fibonacci #elliotwave #modelingsystems #stocks #bitcoin #btcusd #cryptos #spy #gold #nq #investing #trading #spytrading #spymarket #tradingmarket #stockmarket #silver

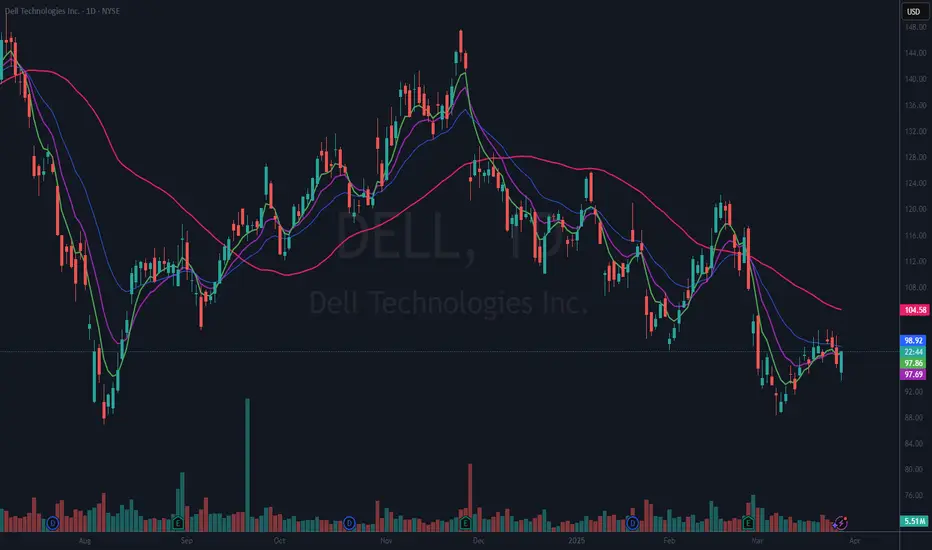
$DELL Ready for a Dumpster Dive?NYSE:DELL I got long on this one Feb 14th and I was stopped out just a few days later. I am looking at it again because they are a big supplier for AI hardware needs, and I think they are over sold. (Just because I think that does not make it so.)
Here is what I am looking at. Today’s candle is a clear rejection of heading lower (at least for today). If we can get a follow through candle tomorrow, I will look to take this long with a clearly defined risk just below today’s candle. Which if it follows through would be a nice higher low.
If you like this idea, please make it your own and make sure it fits your trading plan.
$DE Breaking Out of Flat Base?I went long NYSE:DE on Mar 5th after it bounced right back over the 50 DMA (red). It had been choppy, so I waited to add to the position until today. Why today? If you look you can see the pattern of the candles kept getting tighter and consolidating around the shorter term EMAs. I had drawn in what felt to me to be a resemblance of a flat base pattern. It broke above that with conviction this morning, so I have added to bring up to a full-size position.
My stop on the added portion will be just below the LOD and the remaining stop has been moved up to the most recent higher low.
If you like this idea, please make sure it fits with your trading plan. These are simply my ideas.

SPY/QQQ Plan Your Trade For 3-27-25 : Breakaway PatternToday's Breakaway pattern suggests the markets will continue to melt downward (possibly attempting to fill the Gap from March 24).
I strongly believe the SPY/QQQ are completing the "rolling top" pattern I suggested would happen near or after the March 21-24 TOP pattern my deeper cycle research suggested was likely.
At this point, things are just starting to line up for a broader market decline while the current EPP pattern plays out as a Breakdown of the EPP Flagging formation (moving into consolidation).
Gold and Silver are RIPPING higher. Yes, I do expect a little bit of volatility near these recent highs. But, I also expect metals to continue to rally higher from these levels over the next 10-15+ days. Watch the video.
Bitcoin is stalling/topping - just as I suggested it would months ago.
Now we see how the market move into this new trending phase and how far this current trend will drive price trends. I believe the SPY/QQQ/Bitcoin will all continue to move downward while Gold/Silver move (RIP) higher on this breakaway move.
This is a PERFECT trader's market.
Get some.
#trading #research #investing #tradingalgos #tradingsignals #cycles #fibonacci #elliotwave #modelingsystems #stocks #bitcoin #btcusd #cryptos #spy #gold #nq #investing #trading #spytrading #spymarket #tradingmarket #stockmarket #silver

$KRE REGIONAL BANK Crash? Identical Setup to March 23'Identical Setup to 23' Regional Bank Crash. As always, not sure what the trigger will be, but I will do my best to keep everyone updated as usual. Target of $58 from $60s reached. I'll be expecting a bit more come June. Watch for the sideways movement and rally until then.

I'll be honest here friends it's not looking good...I'll be honest here friends it's not looking good...
This may have been a Dead Cat Bounce on the NASDAQ:QQQ and AMEX:SPY friends.
GAP fills in both names lead to Bear Flag Breakdowns which in my mind leads to the next leg down.
Rejecting 200DMA on the NASDAQ:QQQ and losing control on the AMEX:SPY
Markets are hanging on slightly, lets see what happens the rest of the week.
Not financial advice

US Cash Market Goes 'Flippant'. Understanding Revenge in TradingFirst of all, revenge trading is a destructive pattern of behavior in trading where individuals make impulsive and emotionally-driven decisions in an attempt to recoup previous losses. This practice is not limited to novice traders; even experienced traders can fall prey to it. The primary emotions driving revenge trading include anger, frustration, greed, fear, and shame, which cloud judgment and lead to irrational decision-making.
Causes of Revenge Trading
Emotional Response: Traders often react emotionally to significant losses, feeling compelled to immediately recover their losses without adequate analysis or strategy.
Lack of Discipline: Deviating from established trading plans and risk management principles is common in revenge trading.
Psychological Triggers: Feelings of injustice, anger, or a desire for vengeance against the market can trigger revenge trading.
Consequences of Revenge Trading
Financial Losses: Revenge trading often results in larger losses due to riskier trades and poor timing.
Emotional Burnout: The stress and frustration from repeated losses can lead to emotional exhaustion and decreased trading performance.
Career Impact: Persistent revenge trading can erode confidence and lead to a trader questioning their abilities.
Real-Life Examples of Revenge Trading
Increasing Position Size: A trader experiences a significant loss and decides to double or triple their position size in the next trade, hoping to quickly recover their losses. This action disregards risk management principles and often leads to even greater losses.
Ignoring Stop-Loss Orders: After a loss, a trader might hold onto a losing position longer than planned, hoping it will turn around. This behavior ignores established stop-loss orders and can result in further financial damage.
Chasing Trades: A trader feels compelled to enter trades without proper analysis, driven by the urge to recoup losses quickly. This impulsive behavior can lead to a series of poor trading decisions.
Market Reversal Scenario: A trader suffers a loss due to a sudden market reversal. In an attempt to recover, they enter a trade in the opposite direction without thorough analysis, which can exacerbate their losses.
Wish more examples? Watch recent one below 👇👇
How to Avoid Revenge Trading
To avoid revenge trading, traders should focus on maintaining discipline and adhering to their trading strategies. This includes:
Taking Breaks: After a loss, taking time to reassess the market and calm emotions can help prevent impulsive decisions.
Sticking to Plans: Adhering to established trading plans and risk management principles is crucial.
Emotional Awareness: Recognizing emotional triggers and taking steps to manage them can help prevent revenge trading.
In conclusion, revenge trading is a HARMFUL AND DANGEROUS practice that can lead to significant financial and emotional consequences. Understanding its causes and recognizing its signs are essential steps in avoiding this behavior and maintaining a successful trading career.
--
Best wishes,
@PandorraResearch Team 😎

SPY/QQQ Plan Your Trade for 3-26-25 : Flat-Down PatternToday's Flat-Down pattern for the SPY/QQQ suggests the markets will consolidate in a sideways channel, generally drifting downward.
As I've been warning all of you for the past month+, the market will likely roll over into a topping formation over the next few days, then start an aggressive downward trend targeting $525-535 on the SPY.
Today's video covers some details related to my expectations and how traders can prepare for the bigger moves I see pending.
Gold and Silver are poised for a potentially BIG BREAKOUT move to the upside. And I still believe Gold/Silver are going to rally another 15-20% within the next 30-45 days.
Bitcoin should follow the SPY/QQQ into a "rollover top" type of pattern then shift into a downward price trend over the next few days.
Everything is following my predictions/expectations almost perfectly.
Now, we try to profit from some of these big moves.
Go get some.
#trading #research #investing #tradingalgos #tradingsignals #cycles #fibonacci #elliotwave #modelingsystems #stocks #bitcoin #btcusd #cryptos #spy #gold #nq #investing #trading #spytrading #spymarket #tradingmarket #stockmarket #silver

QQQ Will Explode! BUY!
My dear friends,
Please, find my technical outlook for QQQ below:
The price is coiling around a solid key level - 481.04
Bias - Bullish
Technical Indicators: Pivot Points Highanticipates a potential price reversal.
Super trend shows a clear buy, giving a perfect indicators' convergence.
Goal - 498.55
Safe Stop Loss - 471.31
About Used Indicators:
The pivot point itself is simply the average of the high, low and closing prices from the previous trading day.
Disclosure: I am part of Trade Nation's Influencer program and receive a monthly fee for using their TradingView charts in my analysis.
———————————
WISH YOU ALL LUCK

BEARISH ALT WAVE PEAKING NOWThe chart posted is the Bearish alt we should Not rally anymore is I am correct and if there is a bearish alt. I am looking for a 3 wave drop in the form of an abc decline we should decline to a window of .786 in total of the rally from 5504 or Make a small new low to 5489. Then we should rally very sharp in a 5 wave rally to 50 % or .618 of the The drop from 6147 This is the ONLY BEARISH WAVE COUNT Best of trades WAVETIMER

SPY/QQQ Plan Your Trade For 3-25-25 : Top PatternToday's Top Pattern suggests the SPY/QQQ will find resistance slightly above yesterday's closing price level and attempt to roll over into a bearish price trend.
Watch today's video to see which levels I believe will be the top for the SPY & QQQ.
I do expect metals to rally over the next 3+ weeks and I'm watching for this morning's bounce to carry onward and upward.
Bitcoin should be rolling downward off that FWB:88K top level I predicted months ago.
We are moving into a topping phase - so get ready for the markets to attempt to ROLL DOWNWARD over the next 5+ trading days into a deeper low price level.
Get some.
#trading #research #investing #tradingalgos #tradingsignals #cycles #fibonacci #elliotwave #modelingsystems #stocks #bitcoin #btcusd #cryptos #spy #gold #nq #investing #trading #spytrading #spymarket #tradingmarket #stockmarket #silver

Nasdaq - The Most Decisive Point Ever!Nasdaq ( TVC:NDQ ) might break below all structure:
Click chart above to see the detailed analysis👆🏻
After breaking above the major channel resistance trendline just a couple of months ago, the Nasdaq is now being dominated by bears and starting to break everything back to the downside. So far we didn't see any confirmation but the next couple of days will decide just everything.
Levels to watch: $20.000, $16.000
Keep your long term vision,
Philip (BasicTrading)

SPY/QQQ Plan Your Trade for 3-24-25 : Bozu Trending PatternToday's Bozu Trending pattern suggests a very aggressive price move is likely. I believe this move will be to the upside after my weekend research suggested we are moving into a "blow-off" topping pattern that will act as a Bull Trap.
Overall, I belive the SPY/QQQ have about 2-3 days up upward price trending early this week, then the markets will suddenly roll into a topping pattern and start to aggressively move downward.
The next base/bottom of the continued downward price trend sets up in early/mid April. The March 21-24 base/bottom is likely the minor base/bottom we have seen over the past 3-5+ days.
I believe the breakdown in the SPY/QQQ late this week and into next week will result in a new lower low - causing the Consolidation phase of this downturn to extend down to the 520-525 level on the SPY.
Bitcoin is very close to my $88,000 upper target level (only about $250 off that level). Get ready, BTCUSD should make an aggressive move downward after stalling near the FWB:88K level peak.
Gold and Silver are moving into a trending mode. I believe both Gold and Silver will rally this week and into the next few weeks as we expand into the Expansion phase.
Buckle up. If my research is correct, we are going to see a BIG ROLLOVER this week.
Get some.
#trading #research #investing #tradingalgos #tradingsignals #cycles #fibonacci #elliotwave #modelingsystems #stocks #bitcoin #btcusd #cryptos #spy #gold #nq #investing #trading #spytrading #spymarket #tradingmarket #stockmarket #silver

Trading Is Not Gambling: Become A Better Trader Part III'm so thankful the admins at Tradingview selected my first Trading Is Not Gambling video for their Editor's Pick section. What an honor.
I put together this video to try to teach all the new followers how to use analysis to try to plan trade actions and to attempt to minimize risks.
Within this video, I try to teach you to explore the best opportunities based on strong research/analysis skills and to learn to wait for the best opportunities for profits.
Trading is very similar to hunting or trying to hit a baseball... you have to WAIT for the best opportunity, then make a decision on how to execute for the best results.
Trust me, if trading was easy, everyone would be making millions and no one would be trying to find the best trade solutions.
In my opinion, the best solution is to learn the skills to try to develop the best consistent outcomes. And that is what I'm trying to teach you in this video.
I look forward to your comments and suggestions.
Get some.
#trading #research #investing #tradingalgos #tradingsignals #cycles #fibonacci #elliotwave #modelingsystems #stocks #bitcoin #btcusd #cryptos #spy #gold #nq #investing #trading #spytrading #spymarket #tradingmarket #stockmarket #silver

$BABA HARMONICS Suggest move is over with a possible $95 TargetNot sure if I'm doing this correctly but please do chime in and help out if you can. What this is, is an addition to my previous post about BABA coming back down to EARTH. I'm just adding another chart to reinforce the idea.

$BABA on its way to $120s into AprilI would honestly be surprised if it doesnt gap down this Monday before the open. The weekly imo, looks like a mess atm and could gap into $120s easy. If it doesn't, I would expect some consolidation for a fall into the First week of April. We're right at the golden pocket retrace at the .618, very common retracement level, if we look at Fibs with a bearish perspective and measure a retrace back to the lower golden pocket at 1.61 fib from highs, $112.30 would be my ultimate target if we can break $126. $126 opens the flood gates to our ultimate target at $112.

NIKE INC. AMERICAN SHOOES LOOSING GLOSS, AHEAD OF U.S. RECESSIONNIKE Inc. or Nike is an American multinational company specializing in sportswear and footwear.
The company designs, develops, markets and sells athletic footwear, apparel, accessories, equipment and services.
The company was founded by William Jay Bowerman and Philip H. Knight more than 40 years ago, on January 25, 1964, and is headquartered in Beaverton, Oregon.
As of July 15, 2024, NIKE (NKE) shares were down more than 33 percent in 2024, making them a Top 5 Underperformer among all the S&P500 components.
Perhaps everything would have been "normal", and everything could be explained by the one only unsuccessful December quarter of 2023, when the Company’s revenue decreased by 2 percentage points to $12.6 billion, which turned out to be lower than analyst estimates.
But one circumstance makes everything like a "not just cuz".
This is all because among the Top Five S&P500 Outsiders, in addition to NIKE, we have also shares of another large shoe manufacturer - lululemon athletica (LULU), that losing over 44 percent in 2024.
Influence of macroeconomic factors
👉 The economic downturn hurts most merchandise retailers, but footwear companies face the greatest risk to loose profits, as higher fixed costs lead to larger profit declines when sales come under pressure.
👉 The Nasdaq US Benchmark Footwear Index has fallen more than 23 percent since the start of 2024 as consumer spending is threatened by continued rising home prices, banks' reluctance to lend, high lending rates, and high energy and energy costs. food products - weaken.
👉 In general, the above-mentioned Footwear Sub-Industry Index continues to decline for the 3rd year in a row, being at levels half as low as the maximum values of the fourth quarter of 2021.
Investment Domes worsen forecasts...
👉 In the first quarter of 2024, Goldman Sachs made adjustments to its forecast for Nike shares, lowering the target price to $120 from the previous $135, while maintaining a Buy recommendation. The company analyst cited ongoing challenges in Nike's near-term growth trajectory as the main reason for the adjustment, anticipating potential underperformance compared to market peers, noting that Nike's 2025 growth expectations have become "more conservative."
👉 Last Friday, Jefferies Financial Group cut its price target from $90.00 to $80.00, according to a report.
👉 Several other equity analysts also weighed in on NKE earlier in Q2 2024. In a research note on Friday, June 28, Barclays downgraded NIKE from an "overweight" rating to an "equal weight" rating and lowered their price target for the company from $109.00 to $80.00.
👉 BMO Capital Markets lowered their price target on NIKE from $118.00 to $100.00 and set an overweight rating on the stock in a research report on Friday, June 28th.
👉 Morgan Stanley reaffirmed an equal-weight rating and set a $79.00 price target (up from $114.00) on shares of NIKE in a research report on Friday, June 28th.
👉 Oppenheimer reiterated an outperform rating and set a $120.00 price target on shares of NIKE in a research report on Friday, June 28th.
👉 Finally, StockNews.com downgraded NIKE from a "buy" rating to a "hold" rating in a research report on Friday, June 21st.
...and it becomes a self-fulfilling prophecy
Perhaps everything would have been fine, and all the deterioration in forecasts could have been attributed to the stretching spring of price decline, if not for one circumstance - it is not the ratings that are declining due to the decline in share prices, but the shares themselves are being pushed lower and lower, as one after another depressing ones are released analytical forecasts from investment houses.
16 years ago. How it was
On January 15, 2008, shares of many shoe companies, including Nike Inc. (NKE) and Foot Locker Inc. (FL) fell after investment giant Goldman Sachs (GS) slashed its stock price targets, warning that the U.S. recession would drag down the companies' sales in 2008 as consumers spend more cautiously. "The recession will further increase the impact of the key headwind of a limited number of key commodity trends needed to fuel consumer interest in the sector," Goldman Sachs said in a note to clients.
In early 2008, Goldman downgraded athletic shoe retailer Foot Locker to "sell" from "neutral" and cut its six-month share price target from $17 to $10, saying it expected U.S. sales margins to continue to decline in 2008 despite store closures.
The downgrade was a major blow to Foot Locker, which by early 2008 had already seen its shares fall 60 percent over the previous 12 months as it struggled with declining sales due to declining demand for athletic shoes at the mall and a lack of exciting fashion trends in the market. sports shoes.
Like now, at those times Goldman retained its recommendation rating to “buy” Nike Inc shares, based on general ideas about the Company’s increasing weight over the US market, topped off with theses about the Company’s international visibility, as well as robust demand ahead of the Beijing Olympics.
However Goldman lowered its target price for the shares from $73 to $67 ( from $18.25 to $16.75, meaning two 2:1 splits in Nike stock in December 2012 and December 2015).
Although Nike, at the time of the downturn in forecasts, in fact remained largely unscathed by the decline in demand for athletic footwear among US mall retailers, it reported strong second-quarter results in December 2007 (and even beating forecasts for strong demand for its footwear in the US and growth abroad) , Goldman Sachs' forecasts for Nike's revenue and earnings per share to decline were justified.
Later Nike' shares lost about 45 percent from their 2008 peaks, and 12 months later reached a low in the first quarter of 2009 near the $40 mark ($10 per share, taking into account two stock splits).
The decline in Foot Locker shares from the 2008 peaks 2009 lows was even about 80 percent, against the backdrop of the global recession and the banking crisis of 2007-09.
Will history repeat itself this time..!? Who knows..
However, the main technical graph says, everything is moving (yet) in this direction.

SPY/QQQ Plan Your Trade for 3-21-25 : BreakAway PatternToday's Breakaway pattern may show up in the form of an Island Top or break-away to the upside if my analysis is correct.
I see the markets stalling over the past few days, potentially setting up a "last breakaway" type of pattern today.
I've highlighted how these "last" patterns work where price sets up a peak or trough (in this case a peak) as a last/exhaustion move and how this move can sometimes be very aggressive.
I urge traders to stay cautious today as we are moving into a MAJOR REVERSAL weekend.
I believe the markets will suddenly change direction next week (early) and will move back into downward trending by March 25-26.
Gold and Silver may rally today if the markets move into that Exhaustion Peak pattern. Keep an eye out for Gold/Silver/Bitcoin to potentially rally today and into early next week.
Overall, traders should stay very cautious as we move into next week's peak/top/rollover.
Don't get too aggressive trying to prepare for the rollover or any potential upside move over the next 3-5+ days.
Let the markets show us what and when we need to be aggressive.
Get Some.
#trading #research #investing #tradingalgos #tradingsignals #cycles #fibonacci #elliotwave #modelingsystems #stocks #bitcoin #btcusd #cryptos #spy #gold #nq #investing #trading #spytrading #spymarket #tradingmarket #stockmarket #silver

US100/NASDAQ100/QQQ same thing, failed to reclaim the trendlineSame trendline retest failed on the US100/QQQ after 3 attempts. I suspect lower low will be happening before we bounce.

$DIS keeping it simple, fake pump to $102 ishSimple chart. Seeing some NYSE:DIS flow coming in to the upside short term. Chart looks ok. Giving $100c 4/17 a try. Fill at $3.25.
WSL

MASSIVE $QQQ BOUNCE INCOMING!MASSIVE NASDAQ:QQQ BOUNCE INCOMING!🚀
I believe we are setting up for a run to the 200DMA around $494ish🎯
- Wr% is uptrending after breaking out of Bearish WCB
- MACD is uptrending with the histogram rising
- RSI uptrending and broke out of bearish box
- Stochastic uptrending into the sweet spot after
breaking out of bearish box
We keep rejecting off the H5_S by wicking off it, which is bearish, but all other indicator show bullishness...
I could be wrong, but it's what the probabilities of everything and my GUT tell me.
Not financial advice
