Just in caseI'm accumulating this, I feel a hard corrections is coming. If it drops I'll buy more. I need some hedge on my portfolio.
QQQ

Index struggles at Fibonacci resistance amid concerns.The index appears unable to break through its Fibonacci resistance, which is expected given the prolonged impulsive trend and upcoming elections, alongside rising 'no landing' fears. Earnings reports are solid, and with financials (XLF) looking strong, I'm not concerned. The financial sector often serves as a leading indicator for the broader index, so I view the current 2-3 week stagnation as normal. I still see the biggest opportunity in the AI narrative, and will look to buy during pullbacks.

SPY/QQQ Plan Your Trade For 10-23 : Gap/Breakaway PatternToday's Pattern suggests the SPY will attempt to move higher in a potential Gap/Breakaway mode.
I read this as a potential for an opening price gap (likely higher) and trending upward throughout most of today.
I will point out that I believe the QQQ will not follow this same pattern. The expectation I drew earlier with my SPY Cycle Patterns suggests the QQQ will attempt to consolidate today - possibly moving slightly downward.
This can, and often does, happen when we get a divergence between the SPY & QQQ.
Gold & Silver appear to be moving into my expected Rally phase over the next 4+ trading days. I believe Gold and Silver will attempt to rally about 2.5% to 3.5% higher before reaching a peak near 10-29~10-30.
Bitcoin is consolidating in the Phase #4 Excess Phase peak pattern - just as I suggested. Watch for support to form near 65,600 or slightly higher. I believe this congestion phase will last until after November 2-4 - be aware.
Get some.
#trading #research #investing #tradingalgos #tradingsignals #cycles #fibonacci #elliotwave #modelingsystems #stocks #bitcoin #btcusd #cryptos #spy #es #nq #gold

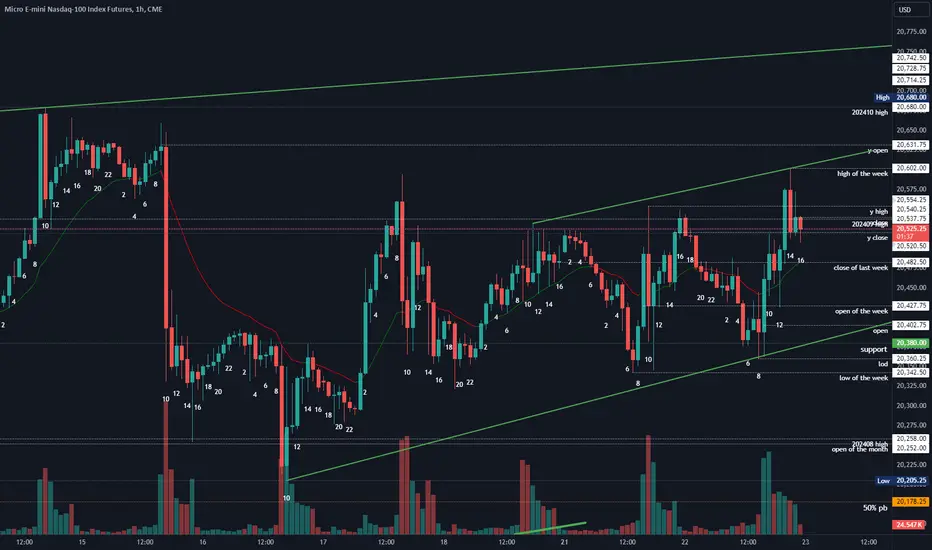
2024-10-22 - priceactiontds - daily update - nasdaqGood Evening and I hope you are well.
tl;dr
Indexes - Sideways again. No deeper meaning to it. Nasdaq has not touched the daily 20ema over the last days but is creeping higher again. Lows are bought so it’s reasonable to expect bears to give up unless something unexpected happens (e.g. very bad earnings but the probability is very low). Bull wedge has not a lot of room anymore, so the odds of a big breakout, this week, are good.
nasdaq e-mini futures
comment : We are moving in a nested bull channel inside the bigger bull wedge. We are making higher highs and higher lows again but barely. Buying above 20500 has been unprofitable for a week now but also selling below 20400. One side will give up soon, can wait for the bigger breakout instead of trading this trading range. Having said that, bulls are still in control since bears could not even touch the daily ema for two weeks now.
current market cycle: Bull trend (nested bull wedges)
key levels: 20000 - 21000
bull case: Bulls grinding this higher again but we also see decent selling in between. It’s buy low and sell high inside the channel. Don’t overstay your welcome in positions and don’t bet on a breakout. Their next target is a breakout above the current channel and a retest of 20700. Above that they would need a daily close above 20700 and then market is free to retest 21000+ again.
Invalidation is below 20300.
bear case: Bears need a daily close below 20300. If they get that, next target would be 20200 and then they have a decent chance of testing 19900 again, where the bull trend line from August runs through. So even if they get all that, the downside is probably very limited for now.
Invalidation is above 20700.
short term: Neutral
medium-long term: Very likely a retest of the ath before I expect a correction 10% or more, before another year end rally. I do think we see 21000 before we see 19600.
current swing trade: Nope
trade of the day: Buying the US open 20400 since previous support was 20340ish and upside potential was to 20500 at least.
SPY/QQQ Plan Your Trade EOD Update : Rally ContinuationThis quick update related to my SPY/GOLD cycle patterns, and other research/predictions, is to help you plan and prepare for the pending rally phase in the markets.
Based on my research, the markets will likely pause a bit tomorrow, Wednesday, and move into a basing/bottoming phase - where price will attempt to develop support.
From that support, I see a fairly strong rally taking place on Thursday and lasting into late- Monday/mid-Tuesday next week.
As I have urged traders to stay cautious over the next 15+ days (elections and liquidity issues), this may be a great time to play the last rally phase before the 3-5 day pullback just before the US elections.
Watch this video. Follow my research.
If you are new to what I'm doing, then watch my Plan Your Trade videos for a week or two. See if you like my style of analysis and if it helps you improve your trading.
My objective is to help as many traders as possible. I'm not 100% accurate in my predictions - but I believe my research is uncomparable to others in what I'm capable of presenting/sharing with all of you.
Get some.
#trading #research #investing #tradingalgos #tradingsignals #cycles #fibonacci #elliotwave #modelingsystems #stocks #bitcoin #btcusd #cryptos #spy #es #nq #gold

QQQ What Next? SELL!
My dear subscribers,
My technical analysis for QQQ is below:
The price is coiling around a solid key level - 494.52
Bias - Bearish
Technical Indicators: Pivot Points Low anticipates a potential price reversal.
Super trend shows a clear sell, giving a perfect indicators' convergence.
Goal - 492.20
About Used Indicators:
By the very nature of the supertrend indicator, it offers firm support and resistance levels for traders to enter and exit trades. Additionally, it also provides signals for setting stop losses
———————————
WISH YOU ALL LUCK

SPY/QQQ Plan Your trade For 10-22: Gap Reversal In Counter-TrendToday's Gap Reversal in Counter Trend mode should resolve as a moderate downward early price trend - possibly transitioning into a base/bottom and turning higher near the end of the trading day today.
Looking at the charts, it appears price is actually leading my SPY Cycle Patterns by about 12+ hours right now. Why?? I don't actually know why - but it appears price is anticipating the cycle patterns a bit early.
Given the heightened sense of concern related to the elections, price may be rolling through stages of liquidity and volatility with only about 15 days to go before the elections.
Either way, as I suggested, this week is going to be tough to trade with the markets moving into a pause phase ahead of the elections. Most traders are trying to position assets away from the markets or are planning on riding things out past the elections right now.
I continue to suggest traders scale back allocation levels this week and next because of the issues related to liquidity in the markets.
Look for the SPY/QQQ to attempt to find a base and try to melt upward near the end of trading today.
Gold & Silver should stay rather muted today.
Bitcoin is consolidating - just as I suggested.
Get some.
#trading #research #investing #tradingalgos #tradingsignals #cycles #fibonacci #elliotwave #modelingsystems #stocks #bitcoin #btcusd #cryptos #spy #es #nq #gold

10/22 Triple divergence is playing out. How deep?Overview:
The AMEX:SPY closed down by only 0.16%, despite opening lower than Friday’s close. During the second trading hour, the index dropped 0.5% but managed to recover the losses throughout the day. Only a few AMEX:SPY stocks ended in the green, with Nvidia gaining 4.14%. Despite this minor pullback, the index has seen six consecutive weeks of growth, and one red weekly candle wouldn't derail a bull run that has gained 23% since the start of the year.
The tech-heavy NASDAQ:QQQ also closed in the green, up 0.19%, thanks to Nvidia’s boost.
The U.S. Leading Indicator Index (LEI) fell by 0.5% month-over-month to 99 in September, a steeper decline than the expected -0.3% and more significant than the -0.2% drop in August, according to The Conference Board’s report on Monday. From March through September 2024, the LEI dropped 2.6%, exceeding the 2.2% decline in the previous six-month period.
"Weakness in factory new orders continued to be a major drag on the US LEI in September as the global manufacturing slump persists," said Justyna Zabinska-La Monica, senior manager of Business Cycle Indicators at The Conference Board. "Additionally, the yield curve remained inverted, building permits declined, and consumers' outlook for future business conditions was tepid."
This index has been decreasing since March 2022, and Monday’s reading officially places it below its lowest point during the COVID-19 period in April 2020. However, the rate of decline appears to be slowing.
Meanwhile, companies are still reporting better-than-expected earnings. Some well-known names reporting today include GE Aerospace (Boeing's engine supplier), Philip Morris, Verizon, General Motors, 3M, Enphase, and Invesco (owners of the QQQ ETF).
The CME Watch Tool now shows an 11.1% chance of no rate cut on November 7th, up from last week’s 9.3%.
While BTC dropped 2.40% on Monday, BlackRock still bought $329 million worth of BTC ETFs. It’s almost amusing to think that BlackRock could be acting as someone’s exit liquidity. The firm now owns 362,192 bitcoins, valued at $23.169 billion.
BTC TA:
W: Unfortunately for the bulls, BTC closed last week at $69k, which is below the highs of the last two bullish waves in late March and early June.
D: Monday ended with a 2.40% correction—much needed after last week's strong rally. A timely release of pressure increases the likelihood of the bull run continuing. An important level to maintain is $66.9k, as it’s the point of control for this recent rally starting from October 10th. The next support levels are $65.8k and the key yearly support at $62.7k. Breaking below $62.7k would invalidate the current bullish wave. On the bearish side, Monday’s candle engulfed the previous five trading days (including the weekend). Before the pullback, the RSI hit 70.
4h: As we spotted and wrote about in our previous letter - the 4-hour chart showed MACD, CVD, and RSI divergences, with three consecutive declining peaks as the price continued climbing. The correction began on Sunday evening, and it may take more than a day to fully play out. The key level to hold now is $66.8k—if it breaks, the price may fall to the daily level of $65.8k. So far, it’s holding.
1h: The 1-hour chart looks bullish, as the $66.9k level is holding, with some bullish MACD and RSI divergence showing.
Alts Relative to BTC: ETH, SOL, and NEAR have not declined as much as BTC. However, SUI has dropped more significantly by 5%, and TAO by 9%. APT is unexpectedly pumping, while DOGE is up by 27.30%. Seems like alts are diverging from BTC correction. At least the aren't collapsing 7 - 10%, which was the case in the past with BTC falling by 2.4%.
Bull Case: BTC could be correcting slightly before resuming the bull run. If a recession is avoided, Trump wins the election, and rates are cut, the outlook remains positive.
Bear Case: BTC may have reached an old resistance level without breaking it, confirming it as a solid resistance, and initiating a deeper correction.
Fear and Greed Index: The index is back to Neutral at 57, down from the Greed territory of 60 over the weekend.

QQQ UP UP AND AWAY! BULL MARKET JUST GETTING STARTED? PT INSIDE!NASDAQ:QQQ
LET THY BULLS RUN! 🐂
My 2025 EOY Price Target is...🥁🥁🥁...
🎯 $560
Not Financial Advice. 🖖
#QQQ #NASDAQ100 #Nasdaq #Futures #futurestrading #StockMarket #options

SPY/QQQ Plan Your Trade For 10-21: Gap Potential PatternToday's pattern suggests an opening price Gap is likely. Given the markets are trading slightly lower this morning, this Gap potential plays very well with my Roadmap trading outline from last week. I highlighted the need to sell out of positions last Friday and look to buy into the Gap Potential pattern today.
If the markets rally off this opening gap pattern, we could see a nice move in the SPY up to 587-588+.
Gold and Silver are rallying again. But be aware today is a TOP pattern for Gold/Silver. That means both Gold & Silver will attempt to identify resistance and move away (lower) from that resistance level.
Bitcoin looks to have moved into the Ultimate Peak level on an intermediate-term Excess Phase Peak pattern. Additionally, the deeper low sets up a longer-term Excess Phase Peak pattern that suggests Bitcoin has entered the Consolidation Phase (#3).
Because of this, I suspect Bitcoin will fall below the FWB:67K level and potentially move into broad consolidation for a minimum of at least 5-6 weeks.
These Consolidation phases in longer-term Excess Phase Peak patterns can be brutal for traders. The volatility of these consolidation phases can present real challenges and last about 50% of the time it took to Flag. Given this information, we may see many weeks of consolidation within a range in Bitcoin - possibly lasting into December 2024.
This will be a tough week for traders. Try to stay aware of the bigger picture and play the rotation headed into next week.
Get some.
#trading #research #investing #tradingalgos #tradingsignals #cycles #fibonacci #elliotwave #modelingsystems #stocks #bitcoin #btcusd #cryptos #spy #es #nq #gold

QQQ: Market of Sellers
Remember that we can not, and should not impose our will on the market but rather listen to its whims and make profit by following it. And thus shall be done today on the QQQ pair which is likely to be pushed down by the bears so we will sell!
❤️ Please, support our work with like & comment! ❤️

$SPY Outlook for OCT 21, 2024AMEX:SPY headed into this week is an inside bar / 1 / harami.
Means an explosive move is coming.
Got a 2-1-2 going into Monday.
The overall market structure is still bullish with higher lows and higher highs.
There's no real catalyst ' yet ' for a big bearish move.
I'd watch how Sunday night's global opens and see what transpires during the London session of NYSE:ES SEED_ALEXDRAYM_SHORTINTEREST2:NQ
There still a GAP downside that was not completely filled last week.
#SPY is in this rising wedge pattern and been respecting the TL (Green/Red).
The pivot for SPY will be 583.99 - 584.55.
If the bulls hold above that, you will see 585.39 get taken and then potentially 586.12. Failure by the bears to stop the move up and 587/587.35/588 will be on the path.
If the bears take control and break the pivot zone, then you will see 583.67 / 583.2 / 582.6 / 582.33 and 581.82 / 581.5 / 580.9
Market Structure starts to change with a break of 582.16.
A true MSS comes at 565 break.
Keep in mind, there is a divergence between NASDAQ:QQQ and AMEX:SPY
This is NOT FINANCIAL ADVISE!
#SPY #MSFT NASDAQ:AAPL #AAPL NASDAQ:AMZN #AMZN NASDAQ:QQQ #QQQ #ICT NYSE:ES #ES SP:SPX #SPX #thestrat SEED_ALEXDRAYM_SHORTINTEREST2:NQ AMEX:SPY #NQ NASDAQ:MSFT NASDAQ:TSLA #TSLA NASDAQ:NVDA NASDAQ:AMD #NVDA #AMD

Stock Market TSLA NVDA AAPL AMZN META GOOG MSFT AnalysisQQQ Forecast
Nvidia Stock NVDA Forecast Technical Analysis

$TSLA - BEAR FLAG $174 PT, Medium Term PT $138 at Double BottomBear Flag is setting up nicely like the previously bear flag. Length of Pole - Measured downside move to a price objective of $174. There is also a major gap that hasn't been filled. The stock will eventually fill the gap with a support at a double bottom of $138. Overall, Tesla is more bearish and than bullish. Short on further downside. Fundamentally, it is trading at an egregiously overvalued Forward PEG of 6.53 and a forward PE of 81 while growth is expected to be stagnant YOY with no concrete evidence of renewed growth for the next year. Even if you assume the company gets back to 50% growth next year, its current valuation on forward PEG and PE would still be overvalued and would need time to grow into its valuation.

10/17 Give us a healthy pull back. Overview:
The AMEX:SPY continues its upward trajectory, hitting new all-time highs. The bullish momentum is supported by more companies exceeding earnings expectations this week. Despite rising unemployment and persistent inflation, corporations are posting record profits. It’s a reminder that the stock market and the economy don’t always move in sync.
The NASDAQ:QQQ , representing big tech, is hovering near its all-time high but struggling to break through. The Federal Reserve reported fewer initial jobless claims at 241k, a decrease from last week, but still higher than the average over the last three years. The CME Watch Tool now indicates a 9.3% chance of no rate cut in the next meeting on November 7th, influenced by these labor market figures.
Meanwhile, a surge in BTC ETF purchases has been observed throughout the week. Yesterday, BlackRock acquired $309 million worth, nearly tripling its average of $117.4 million. This marks their fourth consecutive day of buying. Even Grayscale joined the action. Altogether, $1.854 billion flowed into BTC ETFs this week. This could either mark the peak of the sixth bullish wave or set up a breakout from the year-long bullish flag pattern. BTC saw an 8% rise this week, making it one of the top five best-performing weeks of the year, including February's pump following BTC ETF approval. However, the volume remains lower than expected. For a full trend confirmation, we need institutional whales to join in. If we are indeed breaking out of the bullish flag, the volume should match levels seen at the beginning of the bull run in October and November 2023, when weekly volumes were 80-100% higher than this week.
BTC Technical Analysis:
W: On the weekly chart, BINANCE:BTCUSDT candle wick has reached July's open and close but hasn't tested its highs around $70k. A close above $68.2k this week would be a bullish signal. We still have Friday, but the weekend isn’t likely to bring much action.
D: BTC has been at the upper Bollinger Band for four consecutive days without any correction or pullback. The candles are reminiscent of the week of September 3rd, which saw an 8.5% pump, followed by a fake breakout and an additional 4.54% rise before a sharp decline wiped out all gains within ten days. A healthy pullback could target the $64-68k range—but of course, the bullish sentiment says, "No pullbacks on the way to the moon!"
4h: The current pump started at the key 2024 level of $62.7k, rising in three waves. The third push had lower volume, signaling a price-volume divergence. RSI has exceeded 70 twice and is now trending down, showing divergence with the price. On-Balance Volume (OBV) and Cumulative Volume Delta (CVD) also indicate divergence. Without a clear shooting star candle with high volume, nothing is confirmed yet. We might see some sideways action over the weekend before a possible breakout on Sunday evening.
1h: Bearish.
Alts Relative to BTC: ETH, SOL, and NEAR are showing weakness. None have reached their July peaks like BTC, and they have all pulled back after this week’s pump. Quick question: Does MKR have a bottom?
Bull Case: If we continue breaking out of the bull flag, the pump could extend into next week, with potential gains of another 6-8%. If Trump wins and crypto rallies, rates could be cut in November and December, bringing them down to 4.25-4.50%.
Bear Case: We could continue oscillating within the $58-70k range, and we are currently at the upper end.
Fear and Greed Index: Currently at 58, still Neutral, but it touched the Greed level of 60 yesterday.

SPY/QQQ Plan Your Trade For 10-18 : Tmp-Bottom PatternHappy Friday,
Today's pattern is a Tmp-Bottom pattern for the SPY Cycle Patterns. This pattern usually acts as price attempting to find immediate support in early trading, then moving into a moderate melt-up rally.
After yesterday's big opening gap (higher) on the SPY, I suspect the SPY & QQQ will attempt to rally back to those highs and possibly attempt to break those highs today.
In other words, I believe yesterday's opening price high was a reaction price level where price ran into immediate resistance. After watching price roll downward and now attempt to melt upward in overnight trading, I interpret this move as "failing to continue to establish new lower lows". Thus, price then shifts into a mode of "must attempt to make higher highs".
If my analysis is correct, we'll see the SPY/QQQ melt upward off the Tmp-Bottom pattern and possibly attempt to move up 1.25-1.50%+ today.
Gold and Silver are playing out very nicely - still moving in a solid rally phase.
Bitcoin continues to consolidate sideways. The length of time Bitcoin has consolidated could present a very big breakout or breakdown pattern over the next 2 to 5+ days.
So, be aware that any move away from the #3 & #4 consolidation phase of the Excess Phase Peak pattern could resolve into a very big price move for Bitcoin.
Currently, I suggest the downward price move has a slight advantage - simply because of the failed new highs (price rejection). But, that could change in an instant with a confirmed higher high/higher close.
Get some.
#trading #research #investing #tradingalgos #tradingsignals #cycles #fibonacci #elliotwave #modelingsystems #stocks #bitcoin #btcusd #cryptos #spy #es #nq #gold

Can NVDA hit 200 USD in Q1 2025?🔸Time to update the NVDA trade setup, previously was expecting
a correction in this market, based on fundamentals we are definitely
overextended, however NVDA so far is trading purely based on momentum
ignoring the fundumentals. It's the star stock of the 2024 stock market.
🔸Previous strong uptrend, we broke above key psychological S/R at 100 usd. Right now we got a compression setup, expecting limited upside / pullback heading into US elections, having said that probably any downside beyond 115/120 usd is very limited. current floor set at 100/110 USD.
🔸Compressing into wedge formation, most likely we will break out
to the upside following a shallow pullback in November 2024.
Also November/December is a very strong seasonal period for US stock
market, so it's really hard to recommend short selling NVDA.
🔸Recommended strategy bulls: expecting pullback near 114/118 USD
in November going into elections, limited downside beyond 110 USD.
BUY/HOLD near 114/118 TP bulls is 200 USD, which is almost 75% upside.
Most likely we will reach target somewhere in Q1 2025, probably January.
🎁Please hit the like button and
🎁Leave a comment to support our team!
RISK DISCLAIMER:
Trading Futures , Forex, CFDs and Stocks involves a risk of loss.
Please consider carefully if such trading is appropriate for you.
Past performance is not indicative of future results.
Always limit your leverage and use tight stop loss.

2024-10-17 - priceactiontds - daily update - nasdaqGood Evening and I hope you are well.
tl;dr
Indexes - Bullish spikes on all of them but markets closed mixed. All closed with a big tail above and we are where we closed yesterday. Near but still above the daily 20ema, near bull trend lines but also with bulls not strong enough to get a big breakout above with follow through. Most of the current patterns are in their last stages and the breakout will happen over the next days. I am neutral for now and scalp in both directions.
nasdaq e-mini futures
comment: Fugly chart and yes. Nested bull wedges on the daily chart and on the 1h we have a triangle and a broad bear channel since we are making lower lows and lower highs. Which one to trade? Yeah… 20400 is kinda the midpoint of this and unless bulls get a big breakout above 20700 or bears below 20200, it’s best to fade bigger moves or join momentum. If earnings are good, this will melt again but for now I do think the market should have traded higher by now, if bulls would have wanted this bad.
current market cycle: Bull trend (nested bull wedges)
key levels: 20000 - 21000
bull case: Bulls grinding this higher but they also have only 1 daily bar closing above 20500 for 3 months. Will they give up or strongly break above on good earnings? I would not bet on the latter. Clear bull wedge on the daily chart and we are trading near the lower trend line and daily 20ema. Support should be very strong here and we can probably expect more sideways movement for 1-3 days.
Invalidation is below 20160.
bear case: Bears reject everything above 20500 but they are not able to get follow through selling. No bear wants to sell near the daily 20ema and until we close below it with a strong bear bar, I highly doubt we move much. Given the 3 months inside this bull wedge, I do favor the bears slightly to break below but just very slightly. Can you short this now? Absolutely not.
Invalidation is above 20700.
short term: Neutral
medium-long term: Very likely a retest of the ath before I expect a correction 10% or more, before another year end rally. Embrace the volatility.
current swing trade: Nope
trade of the day: Selling 20500 continues to be profitable… Selling the open was a banger trade. Bears also got a second and even third chance.

Semiconductors vs. Nasdaq: Key Indicator of Tech MomentumIntroduction:
The ratio between semiconductors NASDAQ:SMH and the Nasdaq 100 NASDAQ:QQQ serves as a key indicator of tech sector momentum and near-term risk sentiment. When SMH outperforms QQQ, it signals a "risk-on" environment, reflecting strong demand for semiconductors and overall tech sector health. Conversely, if QQQ outperforms SMH, it suggests a "risk-off" environment, pointing to concerns over weakening chip demand.
Analysis:
Risk Sentiment: The SMH-to-QQQ ratio provides insights into tech momentum. A higher SMH performance often indicates robust chip demand, a positive signal for the broader tech sector. On the other hand, when QQQ outperforms, it signals caution, possibly reflecting waning demand for semiconductors.
Bullish Outlook: Recently, the SMH-to-QQQ ratio has formed a higher low, reinforcing a bullish outlook for semiconductors. This higher low is a positive sign not just for the semiconductor industry but for the broader market as well, as semiconductors often lead market rallies.
Conclusion:
The recent bullish signal in the SMH-to-QQQ ratio suggests tech sector strength, with semiconductors likely leading the way. This is a critical metric for assessing near-term market momentum, so traders should keep a close eye on this ratio to gauge potential shifts in sentiment. What’s your take on this trend? Feel free to share your thoughts in the comments!
Charts: (Include relevant charts showing the SMH-to-QQQ ratio and the higher low formation)
#Semiconductors #Nasdaq #TechSector #SMH #QQQ #RiskOn

TSLA Best Level to BUY/HOLD 30% gains ABCD fractal🔸Hello traders, today let's review 4hour price chart for TSLA.
Recently we gapped down back into trading range, based on previous
update I still maintain neutral outlook until we complete the
re-accumulation structure, details see idea below.
🔸Having said that I'm expecting a decent 30% bounce in TSLA based
on the ABCD price fractal. ABCD fractal from 2023 projected into
the current market structure, point D expected near 188 usd timewise
most likely December/January. This will be a good reload for the bulls.
🔸Recommended strategy bulls: Bulls wait for pullback to complete
near 188 / point D and BUY/hold for a 30% bounce play. Exit/TP at 250 USD.
good luck traders!
🎁Please hit the like button and
🎁Leave a comment to support our team!
RISK DISCLAIMER:
Trading Futures , Forex, CFDs and Stocks involves a risk of loss.
Please consider carefully if such trading is appropriate for you.
Past performance is not indicative of future results.
Always limit your leverage and use tight stop loss.

SPY/QQQ Plan Your Trade For 10-17 : CarryOver In CarryOver ModeGood morning,
Great to see the ES/NQ rallying higher this morning - in perfect alignment with my SPY Cycle Patterns & predictions.
Gold & Silver are also moving slightly higher - but remember My Gold patterns suggest Gold & Silver will consolidate a bit in early trading today.
BTCUSD is a really interesting chart, in my opinion. The multiple Excess Phase Peak patterns are playing into a potentially very large downward price move.
Pay attention to all of the content in this video today because we are moving into the end of this week - which means we need to prepare for the volatility that starts next week.
As I keep suggesting to everyone, trading is about attempting to time the best opportunities for success. Knowing when something may happen that creates an opportunity, setting your risk levels, and going for it.
I wish I could tell you, "Trading is like picking red or black". It's not.
Trader's have to develop almost a 6th sense to be able to see and visualize what is most likely to happen in the future. My tools help me see into the future a bit, but a lot of my analysis comes from within my head.
Anyway, the best way for you to learn these skills is from someone who can mentor you and show you what they are seeing on the chart. Teaching you the skills to improve your own abilities to make better decisions.
That is what I'm doing.
Over time, you will learn to use these techniques to make better decisions and become a better trader (at least that is my objective).
Get some.
#trading #research #investing #tradingalgos #tradingsignals #cycles #fibonacci #elliotwave #modelingsystems #stocks #bitcoin #btcusd #cryptos #spy #es #nq #gold

SPY/QQQ Plan Your Trade: 10-16 UpdateLearn to watch for signs of major market contagion by watching key sectors.
In my opinion, the biggest sectors: Like Transportation, Financials, Gold, and Crude Oil, will lead any major market collapse - often by 7-10+ days.
This videos highlights what I believe most traders need to watch in terms of understanding when/where opportunities are for long trades while attempting to gauge risks related to any type of broad market collapse event.
Spend some time looking over this custom Crash Index and let me know if you see any correlations related to when the SPY/QQQ move more than 7-8% downward in any sudden price moves...
(XLF+IYT+GDX+XOP)/4
Get Some.
#trading #research #investing #tradingalgos #tradingsignals #cycles #fibonacci #elliotwave #modelingsystems #stocks #bitcoin #btcusd #cryptos #spy #es #nq #gold

SPY/QQQ Plan Your Trade For 10-16: BreakAway PatternToday's video highlights what I believe may be a shift in market trend - which can happen.
My SPY Cycle Pattern highlight expected price activity/range based on a number of factors: Fibonacci price theory, Gann analysis, Tesla Price Amplitude theory, and more.
Yet, the one thing my SPY Cycle Pattern do not take into consideration is TIME.
Price shifting slightly forward or backward: where price exhibits an activity/range one day before or one day after the Pattern Date has happened before.
I've seen big CRUSH patterns happen +/- one day. I've seen topping/bottoming patterns happen +/- one day.
Possibly, we just experienced the sideways contraction I was expecting for Wednesday of this week happen on Tuesday of this week. This type of "time shift" if not out of the question in terms of how price reacts to external news/data.
What this means is we may be in for a moderate upside melt-up type of rally in the SPY/QQQ over the next 3+ trading days.
Gold & Silver are moving clearly into the Phase #4 of an inverted Excess Phase Peak pattern. If my analysis is correct, Gold and Silver will rally to a new "Ultimate High" throughout this process.
Bitcoin may have already reached the Ultimate High after yesterday's breakout rally phase. We need to watch the $68k level to see if price fails to rally above that level.
The next two weeks of trading should be very interesting for all of us - moving into an election and watching the global markets attempt to adjust for opportunities/risks.
Remember, ultimately, all of your decision-making should focus on three things:
_ Preserving Capital
_ Identifying Opportunities
_ Containing Risks
No matter what happens over the next three+ weeks, there will be time for more trading after the elections and in 2025 and beyond. Trading is a long game - where the #1 priority is to preserve capital while trying to find the best opportunities for profits.
Get some.
#trading #research #investing #tradingalgos #tradingsignals #cycles #fibonacci #elliotwave #modelingsystems #stocks #bitcoin #btcusd #cryptos #spy #es #nq #gold
